Incremental value of advanced
cardIac ImagIng modalItIes for
dIagnosIs and patIent management
focus on real-time three-dimensional
echocardiography and magnetic
resonance imaging
nina ajmone marsan
The research described in this thesis was performed at the Department of Cardiology of the Leiden University Medical Center, Leiden, The Netherlands
Cover: Nina Ajmone Marsan
Lay-out and printing: Optima Grafische Communicatie, Rotterdam, The Netherlands
ISBN: 978-94-6169-133-0
Copyright© Nina Ajmone Marsan, Leiden, the Netherlands. All rights reserved. No part of this book may be reproduced or transmitted, in any form or by any means, without permission of the author.
Financial support to the costs associated with the publication of this thesis from Philips Healthcare is gratefully acknowledged. Additional gratitude goes to Meda Pharma, Boeh-ringer Ingelheim, Biotronik and Boston Scientific Nederland BV.
Incremental value of advanced cardiac imaging
modalities for diagnosis and patient management
focus on real-time three-dimensional echocardiography
and magnetic resonance imaging
proefschrift
ter verkrijging van
de graad van Doctor aan de Universiteit Leiden, op gezag van Rector Magnificus prof. mr. P.F. van der Heijden,
volgens besluit van het College voor Promoties te verdedigen op donderdag 3 november 2011
klokke 16:15 uur
door
nina ajmone marsan
geboren te Rome, Italië in 1976
promotIecommIssIe
Promotores: Prof. dr. J.J. Bax
Prof. dr. M.J. Schalij Overige leden: Dr. V. Delgado
Dr. E.R. Holman
Prof. dr. P. Nihoyannopoulos (Imperial London Hammersmith Hospital) Prof. dr. A. de Roos
Dr. H.F. Verwey
Prof. dr. E.E. van der Wall
To my parents and to Rutger
table of contents
General introduction and outline of the thesis 13
part I
real-tIme three-dImensIonal
echocardIography
chapter 1 Real-time three dimensional echocardiography: current and future clinical applications.
27
Heart 2009
part Ia
real-time three-dimensional echocardiography
as a novel approach to assess left ventricular size,
function and dyssynchrony.
chapter 2 Predicting response to CRT. The value of two- and
three-dimensional echocardiography. 53
Europace 2008
chapter 3 Real-time three-dimensional echocardiography permits quantification of left ventricular mechanical dyssynchrony and predicts acute response to cardiac resynchronization therapy.
67
J Cardiovasc Electrophysiol 2008
chapter 4 Real-time three-dimensional echocardiography as a novel approach to quantify left ventricular dyssynchrony: a comparison study with phase analysis of gated myocardial perfusion SPECT.
85
J Am Soc Echocardiogr 2008
chapter 5 Usefulness of multimodality imaging for detecting differences in temporal occurrence of left ventricular systolic mechanical events in healthy young adults.
101
Am J Cardiol 2009
chapter 6 Tri-plane tissue Doppler imaging: a novel 3-dimensional imaging modality that predicts reverse left ventricular remodeling after cardiac resynchronization therapy.
117
Heart 2008
chapter 7 Left ventricular dyssynchrony assessed by two 3-dimensional imaging modalities: phase analysis of gated myocardial perfusion SPECT and tri-plane tissue Doppler imaging.
133
Eur J Nucl Med Mol Imaging 2008
chapter 8 Noninvasive imaging of cardiac venous anatomy with 64-slice multi-slice computed tomography and noninvasive assessment of left ventricular dyssynchrony by 3-dimensional tissue synchronization imaging in patients with heart failure scheduled for cardiac resynchronization therapy.
151
Am J Cardiol 2008
part Ib
real-time three-dimensional echocardiography
for the assessment of left atrium volumes and
function.
chapter 9 Real-time three-dimensional echocardiography as a novel approach to assess left ventricular and left atrium reverse remodeling and to predict response to cardiac resynchronization therapy.
169
Heart Rhythm 2008
chapter 10 Comparison of left atrial volumes and function by real-time three-dimensional echocardiography in patients having catheter ablation for atrial fibrillation with persistence of sinus rhythm versus recurrent atrial fibrillation three months later.
187
Am J Cardiol 2008
part II
contrast-enhanced echocardIography
chapter 11 Safety of contrast-enhanced echocardiography within 24
h after acute myocardial infarction. 203
Eur J Echocardiogr 2008
chapter 12 Real-time 3-dimensional echocardiography early after acute myocardial infarction: incremental value of echo-contrast for assessment of left ventricular function.
213
Am Heart J 2009
chapter 13 Impact of left ventricular dyssynchrony early on left ventricular function after first acute myocardial infarction.
231
Am J Cardiol 2010
chapter 14 Reduced left ventricular torsion early after myocardial
infarction is related to left ventricular remodeling. 245
Circ Cardiovasc Imaging 2010
part III
magnetIc resonance ImagIng
part IIIa
magnetic resonance imaging for the assessment
of left ventricular dyssynchrony and myocardial
viability.
chapter 15 Comparison between tissue Doppler imaging and velocity-encoded magnetic resonance imaging for measurement of myocardial velocities, assessment of left ventricular dyssynchrony, and estimation of left ventricular filling pressures in patients with ischemic cardiomyopathy.
269
Am J Cardiol 2008
chapter 16 Magnetic resonance imaging and response to cardiac resynchronization therapy: relative merits of left ventricular dyssynchrony and scar tissue.
283
Eur Heart J 2009
chapter 17 Agreement and disagreement between contrast-enhanced magnetic resonance imaging and nuclear imaging for assessment of myocardial viability.
301
Eur J Nucl Med Mol Imaging 2009
chapter 18 Three-dimensional echocardiography for the preoperative
assessment of patients with left ventricular aneurysm. 317
Ann Thoracic Surg 2011
part IIIb
magnetic resonance imaging for the assessment
of valvular heart disease.
chapter 19 Mitral valve and tricuspid valve blood flow: accurate quantification with 3D velocity-encoded MR imaging with retrospective valve tracking.
337
Radiology 2008
chapter 20 Quantification of functional mitral regurgitation by real-time 3D echocardiography: comparison with 3D velocity-encoded cardiac magnetic resonance.
355
JACC Cardiovasc Imaging 2009
part Iv
Incremental value of advanced ImagIng
modalItIes In cardIac resynchronIzatIon
therapy
chapter 21 Left ventricular rotational mechanics in acute myocardial infarction and in chronic (ischemic and nonischemic) heart failure patients.
373
Am J Cardiol 2009
chapter 22 Effects of cardiac resynchronization therapy on left ventricular twist.
387
J Am Coll Cardiol 2009
chapter 23 Cardiac resynchronization therapy as a therapeutic option in patients with moderate-severe functional mitral regurgitation and high operative risk.
407
Circulation 2011
chapter 24 Effect of cardiac resynchronization therapy on cerebral
blood flow. 425
Am J Cardiol 2010
chapter 25 Cardiac resynchronization therapy in patients with ischemic versus non-ischemic heart failure: Differential effect of optimizing interventricular pacing interval.
437
Am Heart J 2009
chapter 26 Comparison of time course of response to cardiac resynchronization therapy in patients with ischemic versus nonischemic cardiomyopathy.
453
Am J Cardiol 2009
Summary and Conclusions 467
Samenvatting en Conclusies 477
List of publications 487
Acknowledgements 497
Curriculum Vitae 501
General introduction and
outline of the thesis
15 General introduction and outline of the thesis
general IntroductIon and outlIne of the thesIs
Conventional echocardiography is the most commonly used imaging technique in clinical cardiology, due to its non-invasive approach and wide-availability. Diagnosis, therapeutic management and monitoring of patients with cardiovascular diseases are mostly based on
echocardiographic assessments 1, 2, including left ventricular (LV) volumes and ejection
frac-tion (EF), LV thickness and wall mofrac-tion abnormalities, LV diastolic funcfrac-tion measurements, and valvular stenosis or regurgitation severity. However, conventional echocardiography is characterized by several important limitations: 1) for the quantification of LV volumes and EF, 2-dimensional (2D) echocardiography relies on significant geometric assumptions, it might
be affected by oblique or “foreshortened” views and showed modest reproducibility 3; 2) LVEF
and the conventional assessment of LV diastolic function have been shown to be not sensi-tive enough to detect subtle myocardial systolic and diastolic dysfunction that may occur
in several cardiac conditions and should be the target for an early therapeutic approach 4;
furthermore, these conventional measurements are not sophisticated enough to describe
thoroughly the complex LV mechanics 4; 3) 2D echocardiography permits only limited
cross-sectional views, which make in some cases the interpretation and diagnosis of cardiac pathologies, and in particular of valvular disease, extremely complex and achievable only by experienced operators; 4) image quality is often an important issue that may significantly affect the accuracy of this imaging modality.
Advances in echocardiography have more recently provided novel approaches, which may overcome the abovementioned limitations. Real-time 3D echocardiography (RT3DE), tissue Doppler imaging (TDI), 2D speckle tracking imaging and contrast-enhanced echocardiog-raphy have demonstrated their incremental value over conventional echocardiogechocardiog-raphy for the assessment of global and regional LV function and for a better understanding of cardiac mechanics4–7.
In addition, non-echocardiographic imaging modalities, such as multi-detector row com-puted tomography and magnetic resonance imaging (CMR) provide high-resolution images of the cardiac structures and therefore important additional information. In particular, CMR has emerged as the gold standard technique for the assessment of LV volumes and function
and for the identification and quantification of myocardial scar/fibrotic tissue 8, 9.
Therefore, advanced cardiac imaging modalities may play a crucial role to improve the diagnosis process and the clinical management of patients with different cardiac diseases, including heart failure, valvular heart disease, myocardial infarction and atrial fibrillation.
16
General introduction and outline of the thesis
real-time three-dimensional echocardiography
Thanks to significant technological developments, RT3DE is now readily available as a clini-cally applicable imaging technique and allows for the assessment of the whole heart in 3 di-mensions, including all LV segments and unlimited image plane orientations. Therefore using this novel modality, quantification of LV size and function (but also of left atrium and of right ventricle) does not rely anymore on geometric assumptions and has been shown to be more
accurate as compared to conventional echocardiographic measurements 6. Fu r t h e r m o r e ,
regional LV function can be fully assessed based on the 3D endocardial motion of volumetric segments, giving the opportunity of having complete dynamic information on LV chamber contraction (Chapter 1, Figure 3). Therefore, accurate evaluation of LV regional motion can be performed in patients with ischemic cardiomyopathy. Furthermore, temporal sequence of regional myocardial contraction can be studied and measures of LV dyssynchrony can be derived and applied in patients with advanced heart failure referred for cardiac
resynchroni-zation therapy (CRT) 10.
Finally, the 3D approach permits a direct visualization of the complex anatomy and the sophisticated functional mechanisms of the cardiac valves (in particular of the mitral valve), allowing for a unique evaluation of valve morphology and for an accurate assessment of valvular disease severity 11, 12.
assessment of myocardial velocity and deformation
Tissue Doppler imaging and more recently 2D speckle tracking imaging have been introduced for the quantification of myocardial velocity and deformation (strain). These techniques have been largely validated against sonomicrometry and are proposed as novel approaches for a
more sensitive and accurate assessments of global and regional LV function4, 13–15.
In particular, TDI is an echocardiographic modality characterized by high frame rate (until 200 fps) and which is able to record myocardial velocities thanks to specific filter settings that
exclude the blood flow high velocities 16. This modality can also be applied to a 3D dataset,
displaying simultaneously 3 apical views (tri-plane modality) and therefore including all myocardial segments into account and avoiding potential problems of heart rate variability (Chapter 2, Figure 3). In clinical practice, TDI has been validated for the estimate of LV filling
pressures 17, 18, measuring the early diastolic relaxation (E’) of the mitral annulus segments,
and for the assessment of LV dyssynchrony, identifying the delay between myocardial
peak systolic velocities of different LV segments 19, 20. However, the measure of myocardial
velocities does not reflect only the active contraction of the myocardium but is also strongly influenced by the tethering of the adjacent segments or translation motion. Therefore, in certain cases (especially of ischemic cardiomyopathy), it might not be an accurate measure
17 General introduction and outline of the thesis
of myocardial contractility. Conversely, myocardial deformation (strain) can be obtained as spatial derivative, integrated over time of myocardial velocity and reflects more closely the active component of myocardial contraction (Chapter 2, Figure 1). Therefore, it has been applied, together with strain rate (deformation velocity), as a promising direct measure of
myocardial contractility 21. Being TDI a Doppler-based technique, however, makes these
measures dependent on the insonation angle of the ultrasound beam and therefore limited in case of suboptimal alignment, such as in the evaluation of apical segments and of radial and circumferential deformation.
Two-dimensional speckle tracking imaging in turn, permits and angle-independent as-sessment of myocardial strain (and strain rate) in multiple directions (longitudinal, radial and circumferential), tracking over time in standard grey-scale 2D images the presence of natural
acoustic markers (so-called speckles), equally distributed within the myocardial wall. Using
this technique, regional and global LV contractility can be therefore accurately quantified and LV dyssynchrony can be assessed looking at the time sequence of LV segmental
deforma-tion 14, 22. In addition, more complex cardiac mechanics can be studied. The human heart for
example has a specific helical arrangement of the myofibers with a right-hand orientation from the base towards the apex in the endocardial layers and a left-hand orientation in the epicardial layers. This spiral architecture of the myofibers leads to the typical LV systolic wring-ing motion as a result of an opposite rotation of LV apex and base. The gradient between apex and base in the rotation angle along LV longitudinal axis is called twist and contributes
significantly to LV systolic function, in addition to myocardial shortening and thickening 23.
Speckle tracking imaging allows the quantification of LV twist as the net difference between apical (counterclockwise) and basal (clockwise) rotations and as a novel parameter of global
LV performance (Chapter 22, Figure1) 24.
contrast-enhanced echocardiography
In patients with suboptimal acoustic windows, intravenous echocardiographic contrast is normally administered to improve endocardial border delineation, to increase accuracy and reproducibility of regional and global LV function assessment and to detect intracavitary
thrombus 5, 7. RT3DE image quality is highly dependent on the acoustic window, due to a
lower spatial and temporal resolution as compared to 2D echocardiography. Accordingly, adequate endocardial border delineation may be difficult with this imaging modality, even in the presence of relatively good 2D image quality. Few studies explored the feasibility of RT3DE, in relation to the image quality, for the assessment of LV systolic function and reported
a relative high prevalence of uninterpretable or poor quality RT3DE images 25. However, data
regarding the use of contrast agents during RT3DE are scarce and only few studies evaluated
the feasibility and accuracy of contrast-enhanced RT3DE 26.
18
General introduction and outline of the thesis
Contrast-enhanced echocardiography may be particularly important in the management of patients presenting with acute myocardial infarction, in which urgent and repeated echocar-diographic examinations are indeed crucial in order to evaluate LV global and regional func-tion and to exclude infarcfunc-tion complicafunc-tions. Furthermore, this approach enables evaluafunc-tion of myocardial perfusion and microvascular integrity, providing valuable information about
myocardial viability, which is an important prognostic factor after infarction 27. Alternative
diagnostic imaging techniques (i.e. transesophageal echocardiography, radionuclide ven-triculography and cardiac magnetic resonance) are conversely more invasive or expensive.
Substantial safety data already exist for the use of echocardiographic contrast in stable
patients with known or suspected cardiac disease 28. However, safety data on
contrast-echo-cardiography in critically ill patients and particularly in patients within 24 hours of acute myocardial infarction are lacking. As a consequence, the use of this echocardiographic approach in these patients is limited, although of potential great importance. Contrast-echocardiography could in fact provide information on the extent of infarction, which is crucial, together with other parameters such as LV dyssynchrony and novel measurement of LV mechanics, to predict LV functional recovery or development of LV remodeling, and
long-term morbidity and mortality 27.
magnetic resonance imaging
CMR is currently considered the gold standard for the assessment of several cardiac measure-ments, providing highly accurate and reproducible data.
In particular, it was proven to be far superior to other techniques for quantification of LV volumes and EF, and for the assessment of LV regional wall motion and segmental thickness. Therefore, it has been used as a reference technique for the quantification of LV size and
function in validation studies of different imaging modalities, including RT3DE 6.
In addition, CMR with delayed-gadolinium enhancement is considered the gold standard for the assessment of myocardial infarction extent. This technique in fact offers a direct visualization of scar/fibrotic tissue with high spatial resolution, enabling distinction between
subendocardial and transmural myocardial involvement (Chapter 16, Figure 1)8. Therefore, it
is widely applied for the assessment of myocardial viability and for treatment optimization and risk stratification of patients with ischemic LV dysfunction.
Velocity encoded CMR is also particularly suitable for determining trans-valvular blood flow, providing quantitative information on moving spins, and has been recently proposed as
a reference method for the assessment of valvular heart disease 29, 30. However, conventional
single-slice one-directional velocity encoded CMR showed some limitations, mainly due to the fact that the acquisition plane can not be adapted to the systolic-diastolic motion of the valves. A more accurate approach is offered by the 3D 3-directional velocity encoded
19 General introduction and outline of the thesis
CMR with retrospective valve tracking. This technique is able to cover the complete velocity vector field of the blood flow and to correct for the through-plane myocardial motion in the apical-basal direction (Chapter 20, Figure 1). This approach can be therefore applied for the assessment of all 4 cardiac valves in one acquisition and to accurately evaluate potential flow
abnormalities (valve stenosis or regurgitation) 8, 31.
When applied for myocardial wall motion measurement, velocity encoded CMR may ob-tain similar data to that provided by TDI, without the limitations of the acoustical window, and can be used for the assessment of myocardial velocities. As above-mentioned, potential clinical applications might be therefore in the assessment of LV diastolic function and for
the measures of LV dyssynchrony 32, 33. More recently, CMR has also been proposed for the
assessment of LV dyssynchrony looking at the changes in radial wall motion over time 34. With
this approach, which includes the identification of the endocardial and epicardial border of a series of short axis slices, the temporal sequence of LV segments contraction can be studied and measures of LV dyssynchrony can be derived.
CMR therefore provides unique detailed information about cardiac morphology and function, as well as assessment of myocardial viability, LV dyssynchrony and quantification of trans-valvular flows. This comprehensive approach is particularly useful in heart failure patients, especially as potential candidates to CRT.
objectIves and outlIne of the thesIs
The objectives of this thesis were to investigate the incremental value of advanced cardiac imaging modalities for diagnosis and patient management in different cardiac disease. In part I, current and future applications of RT3DE will be introduced. The use of this technique for the quantification of LV volumes and function and for the assessment of LV dyssynchrony is explored in heart failure patients before and after CRT implantation (Part IA). In particular, different 3D measures of LV dyssynchrony, based on the full volume approach (Chapter 2, 3 and 4) or on the tri-plane approach (Chapter 5, 6 and 7), are applied to improve candidate selection for CRT and to predict favorable response after implantation. In Part IB, RT3DE is applied in patients with atrial fibrillation or heart failure for the quantification of left atrium volume and for the assessment of different left atrial functions (conduit function, active contraction, reservoir function).
part II will discuss the additional diagnostic and prognostic value of contrast-enhanced echocardiography, particularly in patients within 24 hours after acute myocardial infarction. Safety and accuracy (in combination with RT3DE) of this modality in this specific group are evaluated. In addition, the incremental value of myocardial infarction extension, as assessed with myocardial perfusion analysis, to predict LV remodeling after infarction is explored together with novel measures of LV performance (LV twist).
20
General introduction and outline of the thesis
The use of CMR for a comprehensive assessment of patients with different cardiac disease
will be the focus of part III. Novel CMR approaches for an accurate and reproducible measure
of LV dyssynchrony are proposed and applied in heart failure patients in order to predict significant LV reverse remodeling after CRT implantation (Part IIIA). In addition, the value of CMR for the assessment of myocardial viability is discussed in different groups of patients (heart failure, LV aneurysm, ischemic cardiomyopathy, Part IIIA). Part IIIB explores the values of CMR in valvular heart disease, and particularly as a reference technique for the assessment of mitral regurgitation severity.
Finally in part Iv, novel physiopathological aspects in CRT patients will be studied using
advanced echocardiographic imaging modalities. In particular, this part of the thesis evalu-ates the effect of CRT on: 1) LV rotational mechanics, as assessed by speckle tracking strain analysis; 2) severity of mitral regurgitation, especially in patients with high operative risk; 3) cerebral blood flow, as measured by transcranial Doppler. Furthermore, whether the etiology of heart failure and biventricular pacemaker settings (when optimized) have a significant influence on response to CRT is further explored.
21 General introduction and outline of the thesis
references
1. Dickstein K, Cohen-Solal A, Filippatos G et al. ESC Guidelines for the diagnosis and treatment of acute and chronic heart failure 2008: the Task Force for the Diagnosis and Treatment of Acute and Chronic Heart Failure 2008 of the European Society of Cardiology. Developed in collaboration with the Heart Failure Association of the ESC (HFA) and endorsed by the European Society of Intensive Care Medicine (ESICM). Eur Heart J 2008;29:2388-2442.
2. Vahanian A, Baumgartner H, Bax J et al. Guidelines on the management of valvular heart disease: The Task Force on the Management of Valvular Heart Disease of the European Society of Cardiol-ogy. Eur Heart J 2007;28:230-268.
3. Gordon EP, Schnittger I, Fitzgerald PJ, Williams P, Popp RL. Reproducibility of left ventricular volumes by two-dimensional echocardiography. J Am Coll Cardiol 1983;2:506-513.
4. Mor-Avi V, Lang RM, Badano LP et al. Current and evolving echocardiographic techniques for the quantitative evaluation of cardiac mechanics: ASE/EAE consensus statement on methodology and indications endorsed by the Japanese Society of Echocardiography. J Am Soc Echocardiogr
2011;24:277-313.
5. Hoffmann R, von BS, Kasprzak JD et al. Analysis of regional left ventricular function by cineven-triculography, cardiac magnetic resonance imaging, and unenhanced and contrast-enhanced echocardiography: a multicenter comparison of methods. J Am Coll Cardiol 2006;47:121-128. 6. Mor-Avi V, Jenkins C, Kuhl HP et al. Real-time 3-dimensional echocardiographic quantification of
left ventricular volumes: multicenter study for validation with magnetic resonance imaging and investigation of sources of error. JACC Cardiovasc Img 2008,1:413-423
7. Thomson HL, Basmadjian AJ, Rainbird AJ et al. Contrast echocardiography improves the accuracy and reproducibility of left ventricular remodeling measurements: a prospective, randomly as-signed, blinded study. J Am Coll Cardiol 2001;38:867-875.
8. Kim RJ, Fieno DS, Parrish TB et al. Relationship of MRI delayed contrast enhancement to irrevers-ible injury, infarct age, and contractile function. Circulation 1999;100:1992-2002.
9. Kwon DH, Halley CM, Carrigan TP et al. Extent of left ventricular scar predicts outcomes in ischemic cardiomyopathy patients with significantly reduced systolic function: a delayed hyperenhance-ment cardiac magnetic resonance study. JACC Cardiovasc Imaging 2009;2:34-44.
10. Kapetanakis S, Kearney MT, Siva A, Gall N, Cooklin M, Monaghan MJ. Real-time three-dimensional echocardiography: a novel technique to quantify global left ventricular mechanical dyssynchrony.
Circulation 2005;112:992-1000.
11. Poh KK, Levine RA, Solis J et al. Assessing aortic valve area in aortic stenosis by continuity equation: a novel approach using real-time three-dimensional echocardiography. Eur Heart J
2008;29:2526-2535.
12. Pepi M, Tamborini G, Maltagliati A et al. Head-to-head comparison of two- and three-dimensional transthoracic and transesophageal echocardiography in the localization of mitral valve prolapse.
J Am Coll Cardiol 2006;48:2524-2530.
13. Amundsen BH, Helle-Valle T, Edvardsen T et al. Noninvasive myocardial strain measurement by speckle tracking echocardiography: validation against sonomicrometry and tagged magnetic resonance imaging. J Am Coll Cardiol 2006;47:789-793.
14. Brown J, Jenkins C, Marwick TH. Use of myocardial strain to assess global left ventricular function: a comparison with cardiac magnetic resonance and 3-dimensional echocardiography. Am Heart J
2009;57:102-105.
22
General introduction and outline of the thesis
15. Reisner SA, Lysyansky P, Agmon Y, Mutlak D, Lessick J, Friedman Z. Global longitudinal strain: a novel index of left ventricular systolic function. J Am Soc Echocardiogr 2004;17:630-633.
16. Sutherland GR, Stewart MJ, Groundstroem KW et al. Color Doppler myocardial imaging: a new technique for the assessment of myocardial function. J Am Soc Echocardiogr 1994;7:441-458. 17. Nagueh SF, Middleton KJ, Kopelen HA, Zoghbi WA, Quinones MA. Doppler tissue imaging: a
non-invasive technique for evaluation of left ventricular relaxation and estimation of filling pressures.
J Am Coll Cardiol 1997;30:1527-1533.
18. Paulus WJ, Tschope C, Sanderson JE et al. How to diagnose diastolic heart failure: a consensus statement on the diagnosis of heart failure with normal left ventricular ejection fraction by the Heart Failure and Echocardiography Associations of the European Society of Cardiology. Eur Heart J 2007;28:2539-2550.
19. Bax JJ, Bleeker GB, Marwick TH et al. Left ventricular dyssynchrony predicts response and progno-sis after cardiac resynchronization therapy. J Am Coll Cardiol 2004;44:1834-1840.
20. Bax JJ, Abraham T, Barold SS et al. Cardiac resynchronization therapy: Part 1--issues before device implantation. J Am Coll Cardiol 2005;46:2153-2167.
21. Urheim S, Edvardsen T, Torp H, Angelsen B, Smiseth OA. Myocardial strain by Doppler echocar-diography. Validation of a new method to quantify regional myocardial function. Circulation
2000;102:1158-1164.
22. Delgado V, Ypenburg C, van Bommel RJ et al. Assessment of left ventricular dyssynchrony by speckle tracking strain imaging comparison between longitudinal, circumferential, and radial strain in cardiac resynchronization therapy. J Am Coll Cardiol 2008;51:1944-1952.
23. Sengupta PP, Korinek J, Belohlavek M et al. Left ventricular structure and function: basic science for cardiac imaging. J Am Coll Cardiol 2006;48:1988-2001.
24. Notomi Y, Lysyansky P, Setser RM et al. Measurement of ventricular torsion by two-dimensional ultrasound speckle tracking imaging. J Am Coll Cardiol 2005;45:2034-2041.
25. Tighe DA, Rosetti M, Vinch CS et al. Influence of image quality on the accuracy of real time three-dimensional echocardiography to measure left ventricular volumes in unselected patients: a comparison with gated-SPECT imaging. Echocardiography 2007;24:1073-1080.
26. Krenning BJ, Kirschbaum SW, Soliman OI et al. Comparison of contrast agent-enhanced versus non-contrast agent-enhanced real-time three-dimensional echocardiography for analysis of left ventricular systolic function. Am J Cardiol 2007;100:1485-1489.
27. Dwivedi G, Janardhanan R, Hayat SA, Swinburn JM, Senior R. Prognostic value of myocardial vi-ability detected by myocardial contrast echocardiography early after acute myocardial infarction.
J Am Coll Cardiol 2007;50:327-334.
28. Dolan MS, Gala SS, Dodla S et al. Safety and efficacy of commercially available ultrasound contrast agents for rest and stress echocardiography a multicenter experience. J Am Coll Cardiol
2009;53:32-38.
29. Buck T, Plicht B, Kahlert P, Schenk IM, Hunold P, Erbel R. Effect of dynamic flow rate and orifice area on mitral regurgitant stroke volume quantification using the proximal isovelocity surface area method. J Am Coll Cardiol 2008;52:767-778.
30. Stewart RA, Raffel OC, Kerr AJ et al. Pilot study to assess the influence of beta-blockade on mitral regurgitant volume and left ventricular work in degenerative mitral valve disease. Circulation
2008;118:1041-1046.
31. Westenberg JJ, Danilouchkine MG, Doornbos J et al. Accurate and reproducible mitral valvular blood flow measurement with three-directional velocity-encoded magnetic resonance imaging.
J Cardiovasc Magn Reson 2004;6:767-776.
23 General introduction and outline of the thesis
32. Delfino JG, Bhasin M, Cole R et al. Comparison of myocardial velocities obtained with magnetic resonance phase velocity mapping and tissue Doppler imaging in normal subjects and patients with left ventricular dyssynchrony. J Magn Reson Imaging 2006;24:304-311.
33. Westenberg JJ, Lamb HJ, van der Geest RJ et al. Assessment of left ventricular dyssynchrony in pa-tients with conduction delay and idiopathic dilated cardiomyopathy: head-to-head comparison between tissue doppler imaging and velocity-encoded magnetic resonance imaging. J Am Coll Cardiol 2006;47:2042-2048.
34. Chalil S, Stegemann B, Muhyaldeen S et al. Intraventricular dyssynchrony predicts mortality and morbidity after cardiac resynchronization therapy: a study using cardiovascular magnetic resonance tissue synchronization imaging. J Am Coll Cardiol 2007;50:243-252.
part I
Real-time three-dimensional
echocardiography
chapter 1
Real-time three dimensional
echocardiography: current and future
clinical applications
n ajmone marsan
, L F Tops, P Nihoyannopoulos, E R Holman, J J Bax
Heart 2009;95:1881–90.
29 Real-time three dimensional echocardiography: current and future clinical applications
IntroductIon
Conventional echocardiography is the most commonly used imaging technique in clinical cardiology. However, the complex cardiac anatomy and the sophisticated functional mecha-nisms of the cardiac structures require a transition from a 2-dimensional (2D) to a 3-dimen-sional (3D) approach. In fact, conventional 2D echocardiography makes significant geometric assumptions for the quantification of cardiac size, and only permits cross-sectional views for interpretation of cardiac pathologies. Real-time 3D echocardiography (RT3DE) may over-come most of these limitations and is now readily available as a clinically applicable imaging technique 1.
Early approaches to 3D echocardiography were based on off-line and time-consuming reconstructions of a series of 2D images obtained by either a freehand scanning or a
me-chanically driven rotating transducer 2. Current generation 3D echo-transducers consist of
a fully sampled matrix array of more than 3000 simultaneously active ultrasound elements that provide a real-time volumetric scanning with rapid post-processing. Recently, this novel technology has also been applied to a new generation transesophageal probes, broadening
the possibility of clinical applications 3,4. The main advantages of a 3D echocardiographic
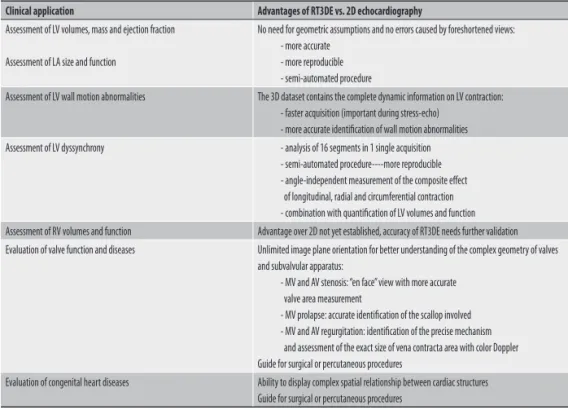
Table 1. Current clinical applications of real-time 3-dimensional echocardiography (RT3DE) and its advantages over conventional 2-dimensional (2D) echocardiography.
Clinical application Advantages of RT3DE vs. 2D echocardiography
Assessment of LV volumes, mass and ejection fraction
Assessment of LA size and function
No need for geometric assumptions and no errors caused by foreshortened views: - more accurate
- more reproducible - semi-automated procedure
Assessment of LV wall motion abnormalities The 3D dataset contains the complete dynamic information on LV contraction: - faster acquisition (important during stress-echo)
- more accurate identification of wall motion abnormalities Assessment of LV dyssynchrony - analysis of 16 segments in 1 single acquisition
- semi-automated procedure----more reproducible - angle-independent measurement of the composite effect of longitudinal, radial and circumferential contraction - combination with quantification of LV volumes and function Assessment of RV volumes and function Advantage over 2D not yet established, accuracy of RT3DE needs further validation Evaluation of valve function and diseases Unlimited image plane orientation for better understanding of the complex geometry of valves
and subvalvular apparatus:
- MV and AV stenosis: “en face” view with more accurate valve area measurement
- MV prolapse: accurate identification of the scallop involved - MV and AV regurgitation: identification of the precise mechanism and assessment of the exact size of vena contracta area with color Doppler Guide for surgical or percutaneous procedures
Evaluation of congenital heart diseases Ability to display complex spatial relationship between cardiac structures Guide for surgical or percutaneous procedures
AV: aortic valve; LA: left atrium; LV: left ventricle; MV: mitral valve; RV: right ventricle
Chapter 1
30
approach are summarized in Table 1. In this article, the role of RT3DE for the assessment of cardiac chambers size and function and for the evaluation of valvular and congenital heart diseases will be reviewed. In addition, the potential future applications of RT3DE will be discussed.
assessment of left ventrIcular sIze and functIon
The most common indication for performing an echocardiogram in adult patients is the as-sessment of left ventricular (LV) size and function. Diagnostic clues, prognostic implications and important therapeutic decisions rest upon the results of this evaluation that conse-quently needs to be as accurate and reproducible as possible.
Figure 1. Example of 3D left ventricular model obtained by post-processing of a full-volume 3D dataset, acquired in a normal subject. In the upper panel, the 3D dataset is automatically cropped (according to the interface of the software Q-Lab, Philips Medical Systems) to visualize the 4-chamber view (top left), the 2-chamber view (top right) and the short-axis view (bottom left). After first identifying the apex and mitral annulus on the end-diastolic and end-systolic frames (using 5 reference points), an automated endocardial tracing is generated for each frame and may be manually adjusted as required. From this, the 3D cast (bottom right) of the LV is created and LV volumes and ejection fraction are obtained. In the lower panel, LV volume is plotted over time throughout the cardiac cycle.
31 Real-time three dimensional echocardiography: current and future clinical applications
Quantification of lv volumes
The conventional 2D quantification of LV volumes is based on the biplane method of discs
(Simpson’s rule) 5. This method assumes that the LV can be represented by a series of stacked
discs with different diameters. However, this assumption may fail in the presence of an ir-regular LV shape (in case of an LV aneurysm), wall motion abnormalities and oblique or “fore-shortened” views of the ventricle. All these issues have important impact on the accuracy of this approach. In addition, it has been demonstrated that conventional 2D echocardiography has a relatively modest inter- and intra-observer agreement and cut-plane reproducibility in
sequential studies 6. In contrast, RT3DE enables a largely automated analysis of LV volumes,
based on direct endocardial surface detection (Figure 1), and therefore avoids the need for geometric assumptions and is not hampered by foreshortened views. Several single-center studies have compared RT3DE with magnetic resonance imaging (MRI) that is currently
con-sidered the gold standard for the assessment of LV volumes 7–11. These studies showed that
conventional 2D echocardiography consistently underestimates LV volumes (mean bias with MRI for LV end-diastolic volume: 70±39 ml) and demonstrated the superiority of RT3DE in both accuracy and reproducibility (mean bias with MRI: 15±28 ml). Recently, RT3DE was also validated with a standardized protocol in a multi-centre setting with variable levels of
experi-ence 12. In this study, RT3DE demonstrated to be an accurate tool, with only a minimal bias
compared to MRI. Furthermore, this bias could be optimized easily by tracing the endocardial border to include the trabeculae in the LV cavity.
evaluation of lv mass and shape
Several studies have demonstrated that an increased LV mass is an independent predictor
of adverse cardiovascular outcomes, particularly in hypertensive patients 13. Calculation of
LV mass by either M-mode or 2D echocardiography suffers from the same limitations previ-ously described for LV volume quantification. A new method derived from the full-volume 3D dataset is based on the identification of the LV epicardial and endocardial boundaries, providing the volume of LV myocardium. Next, LV mass is calculated multiplying myocardial volume for the specific weight of the myocardium. This method is rapid and reproducible
and has a better agreement with MRI as compared to conventional methods 14–16. In addition,
RT3DE may be of great value for the analysis of LV shape. This technique can be applied with a qualitative approach to detect more accurately the presence of aneurysmatic, hypertrofic or non-compacted regions. In addition, RTDE can provide a quantitative approach with a 3D derived sphericity index that showed to accurately reflect LV shape and to be an early and
independent predictor of LV remodeling after acute myocardial infarction 17.
Chapter 1
32
assessment of lv global and regional function
Assessment of global LV function is frequently performed using visual interpretation or “eye-balling”, providing an estimate of LV ejection fraction (LVEF). This subjective interpretation may be comparable to the existing quantification methods derived from 2D LV volumes, and has limited reproducibility. In turn, RT3DE, based on 3D LV volumes, provides more accurate and reproducible quantification of LVEF with significant impact upon clinical decision-making 18,19.
Similarly, evaluation of regional LV function with conventional 2D echocardiography is routinely performed by visually integrating endocardial motion and wall thickness. However, endocardial segments that are poorly visualized may be incorrectly interpreted, and discrete areas of hypokinesis can be missed because these are areas are not included in the standard 2D views. Furthermore, transducer positioning errors may result in inadequate imaging planes. Therefore, the interpretation of wall motion abnormalities is extremely dependent on the experience of the reader and has a poor reproducibility. Since any possible 2D view is included in the 3D dataset and can be obtained by “cropping” the LV full-volume, RT3DE offers the opportunity of having the complete dynamic information on LV chamber contrac-tion and to consistently reproduce the same imaging plane in sequential exams. Besides the conventional 2-, 4- and 3-chambers views, multiple parallel short axis slices can be used for systematic analysis of wall motion abnormalities. In addition, RT3DE has the potential of quantitative evaluation of regional LV function based on segmental analysis of 3D
endocar-dial motion 8,20. However, no studies have validated RT3DE for this specific analysis.
Figure 2. On the left panel, an example of moderate-to-poor quality RT3DE. In particular, the LV anterior and lateral walls are not visible. On the right panel, the improvement of endocardial border delineation with optimal LV chamber opacification in the same patient during contrast-enhanced RT3DE. The 3D dataset is cropped to extract multiple short-axis views at different levels of the LV.
33 Real-time three dimensional echocardiography: current and future clinical applications
In the subset of patients with inadequate RT3DE images, echo contrast agents could be of incremental value, as previously demonstrated for 2D echocardiography. Initial studies have shown that intravenous administration of echo contrast during RT3DE improves LV endocar-dial border visualization, increasing the feasibility, accuracy and reproducibility of both LV
volumes quantification and LV global and regional function assessment 21,22 (Figure 2).
rt3de during stress echocardiography
Considering the superiority over 2D echocardiography for the evaluation of LV global and regional function, RT3DE can be also applied in stress testing. This technique, in fact, has several potential advantages in this setting: 1) shorter scanning time, due to the simultane-ous acquisition of 3 imaging planes (tri-plane imaging) or of a complete full-volume dataset, instead of the serially acquired 3 apical views; 2) no need to change the transducer position, avoiding a false-positive or negative stress echo due to imaging plane errors; 3) inclusion of the whole LV in one acquisition, with the potential of analyzing the standard long axis
views but also multiple parallel short axis slices 23. Initial studies showed similar sensitivity
and specificity for 2D and 3D stress echo, but with a dramatically shorter scanning time 24.
Limitations of the clinical application may be related to the image quality, which is still lower
than 2D echocardiography (but may be improved with the use of eco contrast) 25, and to the
temporal resolution, which may be unsatisfactory especially during peak stress.
assessment of lv dyssynchrony
In the last years, several studies emphasized the importance of LV dyssynchrony assessment
to improve the selection of candidates to cardiac resynchronization therapy (CRT) 25,26, beyond
the application of the current guidelines. However, data from the recent PROSPECT study revealed that standard echocardiography and tissue Doppler imaging (TDI) had modest reproducibility for the assessment of LV dyssynchrony and yielded modest
sensitivity/speci-ficity for prediction of response to CRT 27. More recently, 3D echocardiographic approaches
have been proposed for assessment of LV dyssynchrony. Color-coded TDI has been used in combination with tri-plane imaging, which allows for simultaneous visualization of the 3
apical views and may be able to improve the reproducibility of TDI measures 28. Furthermore,
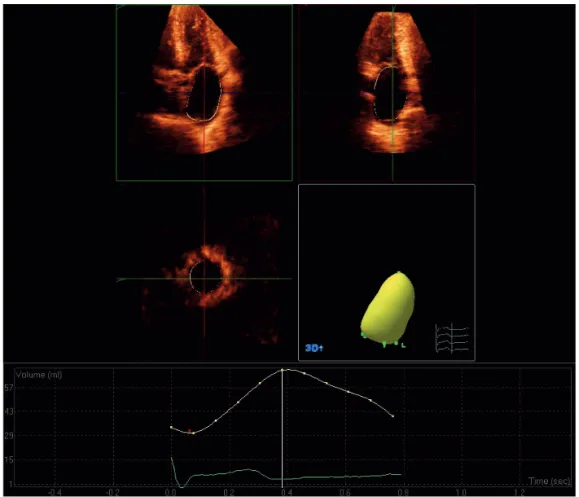
RT3DE has been proposed as a promising technique for assessment of LV dyssynchrony based on analysis of LV regional volumetric changes. The LV 3D model is divided in 17 standard sub-volumes. For each volumetric segment, it is possible to derive time-volume data during the cardiac cycle and assess the time taken to reach the minimum systolic volume (Tmsv) (Figure 3). When all segments reach the minimum systolic volume at the same time, the LV
Chapter 1
34
has synchronous contraction. Conversely, in a dyssynchronous ventricle a dispersion of the Tmsv is evident. The standard deviation of Tmsv for 16 segments (excluding the true apex) can be used as a marker of global LV dyssynchrony and can be expressed as a percentage of cardiac cycle rather than in ms to avoid the confounding effect of the heart rate. In this way, the ‘systolic dyssynchrony index’ (SDI) can be obtained. Therefore, in one acquisition RT3DE includes all myocardial segments and, measuring the regional volumetric changes, it evalu-ates the composite effect of longitudinal, radial and circumferential contraction. Kapetanakis
et al29 demonstrated the feasibility of SDI assessment in a large group of patients and normal
subjects. The authors found an average SDI of 3.5% in normal individuals. In the patient population, the SDI showed an inverse correlation with LVEF and mean values ranged from 4.5% to 15.6% according to the degree of LV systolic dysfunction. Recently, the value of the SDI index for the prediction of CRT response was studied, both acutely and late after device Figure 3. Example of the 3D LV model generated by post-processing of a RT3DE dataset and subdivided by the software in 17 sub-volumes (left panel). Right lower panel: for each volumetric segment, it is possible to derive time-volume curves over the cardiac cycle and assess the time needed to reach the minimum systolic volume (Tmsv, red dots). In this example, LV contraction is dyssynchronous and the standard deviation of 16 segment Tmsv, expressed in percentage of the cardiac cycle (SDI) is 11.7%.
Right upper panel: example of parametric image, which employs color-coding (blue indicating early mechanical activation and orange-red is late activation) to represent Tmsv. In this heart failure patient, the infero-postero-lateral wall (segments 4, 5, 6, 10 and 11) is clearly the latest activated region.
35 Real-time three dimensional echocardiography: current and future clinical applications
implantation. Marsan et al 30,31 demonstrated that a cut-off value of SDI of 6.4% has high
sensitivity and specificity (88% and 85% respectively in a long-term follow-up study) and good reproducibility. The currently available software can also provide parametric images with a visual color-coded summary (in polar plot format) of LV regional contraction timings and a rapid identification of the latest activated LV wall (Figure 3).
In summary, RT3DE has several potential advantages over other echocardiographic tech-niques for the assessment of LV dyssynchrony: 1) LV dyssynchrony analysis is combined with highly accurate quantification of LV size and function which enables simultaneous evaluation of therapy success, 2) RT3DE includes all LV segments in the dyssynchrony analysis, using an angle-independent measurement, 3) RT3DE uses a semi-automated procedure potentially resulting in more reproducible measurements, and it allows for a rapid assessment of the area of latest mechanical activation.
assessment of left atrIum sIze and functIon
Left atrium (LA) enlargement is associated with several cardiovascular diseases and is a well known predictor of adverse cardiovascular outcomes, including atrial fibrillation, heart failure, stroke and death 32,33. Accurate assessment of LA size is therefore crucial and, as
recommended, should be based on LA volume measurement 5. For this purpose, 2D
echo-cardiography is the most commonly used imaging technique, although it relies on significant geometric assumptions and has poor test-retest reproducibility. Recently, RT3DE has been validated against MRI and showed to be more accurate and reproducible than 2D
echocar-diography for LA volume assessment 34,35, applying the same algorithm previously described
for the LV (Figure 4). This technique can be used to quantify LA maximum volume (LAmax, just before mitral valve opening), but also minimum volume (LAmin, just before mitral valve
closure) and the volume before atrial active contraction (LApreA, obtained from the last frame
before mitral valve reopening). All LA volumes should be indexed to the body surface area 5.
By providing a detailed analysis of the phasic changes of LA volumes throughout the
cardiac cycle, RT3DE enables the assessment of different LA functions 36–38. In fact, during
LV systole and isovolumic relaxation, LA operates as a “reservoir” that receives blood from pulmonary veins and stores energy in form of pressure; during early diastole, it operates as a “conduit” for transfer blood into the LV; during late diastole, the LA “active” contraction
contributes to LV stroke volume by 20–30% 39. Using RT3DE, several studies suggested to
explore these different functions assessing the following indices36–38:
1) Atrial expansion index = [(LAmax – Lamin)/LAmin] x100, which is considered an index of LA reservoir function and is influenced by LA wall stiffness and systolic displacement of the mitral annulus.
Chapter 1
36
2) Passive atrial emptying fraction (LApassive) = [(LAmax – LApreA)/LAmax] x100, as an index of LA conduit function, which is mainly related to LV diastolic function.
3) Active atrial emptying fraction = [(LApreA – LAmin)/LApreA] x100, as an index of LA active function. The major determinants of this function are the heart rhythm, the intrinsic
contractility of the atrial myocardium and LApreA (according to the Frank-Starling effect).
Recent studies have used RT3DE to assess LA volume and function in different cardiac diseases, such as mitral valve diseases, atrial fibrillation, heart failure. Furthermore, the effect of specific therapies, such as cardiac resychronization therapy, atrial fibrillation ablation and
mitral valve repair 31,40 on LA volume and functions has been evaluated. Using RT3DE, reverse
remodeling of the LA and improvement in LA function has been demonstrated.
Figure 4. Assessment of LA volumes using RT3DE. Automatic border detection (yellow line) is obtained marking 5 reference points in the apical 2- and 4-chamber views (upper panel) and manual corrections can be made to exclude the LA appendage and the pulmonary vein ostia. The LA 3D model is automatically provided by the software (right lower panel) and can be evaluated also using the short-axis view (left lower panel). The changes in LA volumes during the heart cycle are plotted as a curve.
37 Real-time three dimensional echocardiography: current and future clinical applications
assessment of rIght ventrIcular sIze and functIon
Because of its complex geometry, the assessment of right ventricular (RV) volumes and function is extremely challenging. Conventional 2D echocardiography may be therefore inadequate, because it relies on significant geometrical assumptions. However, an accurate assessment of RV size and function is of great importance because of the diagnostic and prognostic implications in several cardiac diseases. Without the need for geometrical model-ling, RT3DE showed to be able to improve the accuracy and reproducibility of RV volumes
quantification, as compared to 2D echocardiography 41,42. Furthermore, a new software for
the 3D dataset post-processing, specifically adapted for RV morphology, has recently been
Figure 5. Example of a 3D right ventricular (RV) reconstruction in a normal subject, using a dedicated software (TomTec Imaging Systems, Munich, Germany). The RV 3D model (upper panel) is obtained applying a semiautomated border detection algorithm over a complete cardiac cycle and RV end-diastolic (EDV) and end-systolic (ESV) volumes are automatically displayed, together with RV stroke volume (SV) and RV ejection fraction (RVEF).
Chapter 1
38
introduced (Figure 5). Tamborini et al applied this software in a large population for the assessment of RV volume and ejection fraction and found this analysis feasible and not
time-consuming 43.
valvular heart dIseases
The study of valvular heart diseases is one of the most important application of RT3DE. This technique is in fact ideally suited for a comprehensive assessment of the geometry of valves and subvalvular apparatus, given the non-planar anatomy and the complex function of these structures. By cropping the 3D dataset, unique “en face” views from both sides of the valve can be generated in real-time. Furthermore, any other possible oblique cut-plane or so-called multiplanar reconstructions (MPRs) can be easily obtained. Consequently, this approach certainly provides a more complete picture of valve diseases and may also lead to a better communication of the echocardiographic findings to the surgeon and to a more appropriate choice of treatment.
mitral valve
RT3DE has provided important insights into mitral valve (MV) physiopathology and signifi-cantly contributed to the understanding of its anatomy and function. This technique was able to demonstrate the saddle shape of the annulus and the important interrelationship between
mitral leaflets, chordae, papillary muscles and the LV 44. Dedicated software, such as 4D
MV-Assessment (TomTec Imaging systems, Unterschleissheim, Germany) and MV-Quantification (Philips Medical System, Bothell, Washington, USA), are now available to derive 3D quantifica-tion of the MV annulus dimension, leaflet surface, tenting volume, aorto-mitral angle and papillary muscles geometry (Figure 6).
In patients with mitral stenosis, RT3DE can provide accurate planimetry of the valve orifice area, identifying the correct plane of the valve opening and obtaining, by cropping the im-age, the real smallest orifice area (Figure 7). Compared with 2D traditional planimetry and Doppler-derived methods (pressure half-time, proximal isovelocity surface area), RT3DE showed the best agreement (r = 0.9) with the invasive measurement (mitral orifice area
obtained using the Gorlin formula) and lower intra- and inter-observer variability 45,46.
Fur-thermore, this approach is less influenced by cardiac rhythm and hemodynamic conditions. In addition, RT3DE provides an accurate visualization of the degree of leaflet thickness, com-missural fusion and calcification and can be applied after percutaneous mitral valvuloplasty to assess the commissural splitting.
39 Real-time three dimensional echocardiography: current and future clinical applications
P
1
2
Figure 6. 3D reconstruction of mitral valve (MV) anatomy using MV-Quantification software (Philips Medical System, Bothell, Washington, USA) from transesophageal 3D images. In the first panel an example of normal MV anatomy. In the second panel an example of a prolapsed (P3) MV. From these models, several measurements of MV annulus, leaflets and subvalvular apparatus can be derived. Furthermore, the aorto-mitral relationship can be studied. A = anterior leaflet; AL = antero-lateral commisure; Ao = aortic valve; P = posterior leaflet; P = postero-medial commisure.
Figure 7. Mitral valve stenosis: 3D transversal section viewed from the apex of the left ventricle. The commissural fusion is clearly visible and the residual smallest mitral valve orifice can be measured directly (yellow line) identifying the correct plane.
Chapter 1
40
The presence of MV prolapse is often over- or under-estimated using conventional 2D echocardiography, due to its non-planar leaflet-annulus relationship. In turn, RT3DE permits detailed visualization of the scallops involved, the chordal anatomy and the annulus enlarge-ment that is often coexisting (Figure 6). Recently in more than 100 patients undergoing MV repair, Pepi et al demonstrated the accuracy of transthoracic and transesophageal RT3DE,
as compared to 2D echocardiography, for the localization of MV prolapse 47. Transthoracic
RT3DE (90%) and 2D transesophageal (85%) approaches showed similar accuracy, slightly lower than transesophageal RT3DE (96%) but significantly higher than 2D transthoracic echocardiography. In particular, RT3DE was highly accurate also in patients with complex MV prolapse (commissural lesions, bileaflet lesions, P1 and P3 prolapse), helping the surgeon to plan an appropriate procedure and improving the likelihood of MV repair.
With the advent of a fully-sampled matrix array transducer, the application of Color Dop-pler RT3DE has become feasible, although still with a low temporal resolution. This modality
Figure 8. Direct assessment of size and shape of mitral valve effective regurgitant orifice area (EROA). The 3D dataset is manually cropped by an image plane perpendicularly oriented to the jet direction until the narrowest cross-sectional area of the jet. EROA is measured by manual planimetry (white line) of the color Doppler signal tilting the image in an ‘en face’ view.
41 Real-time three dimensional echocardiography: current and future clinical applications
provides important information to grade the severity of mitral regurgitation, crucial for ap-propriate patient management and timing of surgical intervention. In fact, Color Doppler RT3DE, allowing for an unlimited plan orientation and in particular for an “en face” view of the MV, provides a direct assessment of size and shape of the effective regurgitant orifice area (EROA), obviating the geometric assumptions applied by 2D echocardiography (Figure 8). Initial studies showed the incremental value of RT3DE measurements of EROA over 2D proximal isovelocity surface area and vena contracta width methods. The studies by Iwakura et al 48 and Kahlert et al 49 emphasized the importance of a 3D approach in patients with functional MR, in whom 2D echocardiography significantly underestimated the size of the regurgitant orifice.
Figure 9. Example of percutaneous aortic valve replacement in a patient with severe aortic stenosis (aortic valve area = 0.72 cm2). In the upper panel, a 3D short-axis view of the aortic valve with extensive calcifications of the 3 cusps. The moment when the catheter goes through LV outflow tract and the aortic valve is depicted in the left lower panel. Of note, no echo-markers for the identification of the exact position of the balloon are available so far. In the lower right panel, a 3D image of the aortic valve prosthesis, with a clear visualization of the leaflets inside the stent.
Chapter 1
42
other valves
Compared with MV, experience visualizing aortic valve with RT3DE is limited, because of the low accessibility (in the far field) and the thin cusps. Most of the studies on aortic valve dis-eases have been performed using a real-time 3D transesophageal approach with a feasibility
in over 80% of patients (more in native than in prosthetic valves) 50. In patients with aortic
stenosis, preliminary studies showed that the direct planimetry of the valve orifice is more
accurate using RT3DE as compared to conventional 2D echocardiography 51. In addition, the
evaluation of the stenosis severity by the continuity equation was more accurate using a 3D
approach for LV outflow tract measurement 52. Recently, 3D transesophageal
echocardiogra-phy has also been proposed as a new tool to guide and monitor percutaneous aortic valve
replacement (Figure 9) 53.
The utility of RT3DE for the study of RV valves (tricuspid and pulmonary) has not been comprehensively explored. However, this technique has the unique capability of obtaining the short-axis plane of the tricuspid valve (TV) with a simultaneous visualization of the three leaflets that is not possible to achieve with conventional 2D echocardiography. This characteristic opens new opportunities for the evaluation of TV stenosis, regurgitation and congenital diseases. So far, initial observations, mostly in the pediatric population, showed
promising results using RT3DE for the study of TV anatomy (annulus and leaflets) 54,55.
congenItal heart dIseases
Three-dimensional echocardiography, using both reconstructions methods and real-time analysis, has been applied to detect several forms of congenital heart diseases. This tech-nique permits a complete visualization of the complex spatial relationships of the cardiac lesions without extending the examination time. Furthermore, it provides a realistic and almost specimen-like preview of the surgical anatomy that facilitates planning of the surgi-cal treatment. In patients with atrial or ventricular septal defects for example, RT3DE allows accurate evaluation of type, size, location and motion of the defect as well as the spatial relationships with the adjacent structures (Figures 10 and 11). Furthermore, measurement of the magnitude of shunting and information about adequacy of rims for device closure can be
also obtained 53,56,57. RT3DE also showed to reliably define anatomic details of bicuspid aortic
valves, Tetralogy of Fallot, patent ductus arteriosus, sinus of Valsalva aneurysm, Ebstein’s
anomaly, subvalvular membranes and several other complex congenital diseases 58.
43 Real-time three dimensional echocardiography: current and future clinical applications
future applIcatIons
Considering the abovementioned advantages over conventional 2D echocardiography, it is likely that RT3DE will become a routine part of most echocardiographic examinations. Furthermore, future advances in transducer and computer technology will allow for min-iaturized probes with larger scanning volume, higher spatial and temporal resolution and more sophisticated and completely automated quantification software (including 3D speckle tracking analysis for assessment of myocardial strain and torsion mechanics).
Particularly promising is the potential application of RT3DE to guide intracardiac proce-dures, mainly using the transesophageal approach. In fact, this technique may be useful in various transcatheter interventions: 1) percutaneous MV annuloplasty, for the identification Figure 10. Left atrial view of an atrial septal defect using RT3DE. The size and the localization in relation with the aorta are clearly depicted. More important, the presence of a small rim surrounding the defect can be identified.
Chapter 1
44
of the coronary sinus and quantification of the angle between the aortic orifice and the MV plane; 2) percutaneous aortic valve replacement, for the selection of the correct size and position of the prosthesis and on-line monitoring of the procedure; 3) atrial septal defect and
patent foramen ovale closures with occluder devices 53; 4) elecrophysiological procedures,
guiding the transeptal puncture and the positioning of the ablation catheters in the LA,
eventually in combination with electroanatomical mapping systems 59. In all these
proce-dures, transesophageal RT3DE may improve the imaging guidance and reduce the radiation exposure from fluoroscopy.
conclusIons
RT3DE has made an important transition from a research tool to a clinically applicable imag-ing technique. Main advantages of this modality over conventional 2D echocardiography are the accurate quantification of cardiac chamber size and function and the possibility of unlimited image plane orientations for better understanding of valvular or congenital heart diseases.
Figure 11. Real-time 3D echocardiogram (sagittal view) of a patient with a double outlet right ventricle with a large ventricular septum defect (see arrow).