ORIGINAL RESEARCH ARTICLE
Relationship between Physical Activity and Health Related Quality
of Life among Pregnant Women
DOI: 10.29063/ajrh2018/v22i3.9
Aliyu Lawan
1*, Adedapo W. Awotidebe
2, Adewale L. Oyeyemi
1, Adamu A. Rufa‟i
1and Adetoyeje
Y. Oyeyemi
1Department of Medical Rehabilitation (Physiotherapy), University of Maiduguri, Nigeria1; Department of Physiotherapy, Bayero University Kano, Nigeria2
*For Correspondence: Email: [email protected]; Phone: +234 8034889200
Abstract
The study aimed to investigate the association between health-related quality of life (HQoL) and physical activity (PA) among pregnant women. Sample of pregnant women (N= 398; mean age=27.86±5.15 years) were surveyed using the Pregnancy Physical Activity and Health Related Quality of Life (SF 12) Questionnaires. Spearman correlation coefficient and logistic regression analyses were used to determine the bivariate relationship and association between HQoL and PA intensities and domain respectively. Overall, sedentary behaviour was positively albeit tenuously related to HQoL (r=0.111, P<0.01) whereas sport/exercise was the only domain of PA tenuously associated with the Physical health of HQoL (r=0.142, p<0.01). Also, pregnant women with sufficient PA were 4 times likely to report good quality of life in physical component not in the mental component of HQoL (OR: 4.33, 95% CI: 1.36-13.80). In conclusion, sports/exercise may be an important domain of PA to target when delivering interventions to improve the physical wellbeing among pregnant women in Maiduguri, Nigeria. (Afr J Reprod Health 2018; 22[3]: 80-89).
Keywords: Sedentary Behaviour, Physical Activity, Quality of life, Pregnancy
Résumé
L'étude visait à étudier le rapport entre la qualité de vie liée à la santé (QVLS) et l'activité physique (AP) chez les femmes enceintes. Un échantillon de femmes enceintes (N = 398; âge moyen = 27,86 ± 5,15 ans) a été interrogé à l‘aide des questionnaires «Activité physique pendant la grossesse et qualité de vie liée à la santé» (SF 12). Le coefficient de corrélation de Spearman et les analyses de régression logistique ont été utilisés pour déterminer la relation à deux variables et l'association entre les intensités QVLS et AP et le domaine, respectivement. Dans l'ensemble, le comportement sédentaire était positivement, bien que faiblement, lié à QVLS (r = 0,111, P <0,01), alors que le sport / exercice était le seul domaine de PA faiblement associé à la santé physique de QVLS (r = 0,142, p <0,01). De plus, les femmes enceintes ayant suffisamment de AP étaient 400 fois plus susceptibles de déclarer une bonne qualité de vie dans la composante physique que dans la composante mentale de la QVLS (OR: 4,33, IC à 95%: 1,36-13,80). En conclusion, le sport / exercice peut être un domaine important de l'AP à cibler lors de la prestation d'interventions visant à améliorer le bien-être physique chez les femmes enceintes à Maiduguri, au Nigeria. (Afr J Reprod Health 2018; 22[3]: 80-89).
Mots-clés: comportement sédentaire, activité physique, gestation, grossesse
Introduction
Pregnancy is an important period that is accompanied by several physical and emotional changes1. Those changes can alter the pregnant women‘s ability to function in their various roles, thereby impacting on their physical activity performances2 and quality of life3. Active lifestyle
The benefit of physical activity in pregnancy is well established across various populations7.8. It is recommended that, in absence of medical and obstetric complications, pregnant women should aim to perform at least 30 minutes or more of moderate intensity physical activity daily, and/or exercise 3 - 5 times weekly for a minimum of 15 - 30 minutes9. Despite the established health related benefits attributed to physical activity during pregnancy, retrospective and prospective data on physical activity during pregnancy shows decrease physical activity intensity and duration as pregnancy advances by shifting toward performing less intense, more comfortable modes of activity with lower energy expenditure10.
Several theories have been proposed on improving adherence to physical activity and healthy behavior. A model based on cognitive theory proposed that future physical activity behaviour of an individual is dependent primarily on whether engaging in physical activity will lead to positive or negative outcomes11. A socio-ecological model that emphasizes the physical environmental factors as important determinants of health behaviour has been used to promote physical activity adherence in adult population12,
13
. Previous studies have shown decline in physical activity among pregnant women even in the Western developed world, particularly the USA, Europe and Australia, where the built environments and community design is good and motivating physical activity12, 14. Similar findings exist in the developing world such as Nigeria, Ethiopia and Cameroon where the built environments and community design may be considered poor and not motivating physical activity15-17.
Promotion of healthy behavior may therefore be dependent on the perceived positive health benefit and wellbeing benefit that is harnessed from the continuity of such an action18. The concept of health-related quality of life is used in a multidimensional concept in public health to refer to a person or group‘s perceived physical and mental health status19 and may also be used to measure perceived benefit from such action. Many studies have focused on
Methods
Participants and study design
This study was an analytic cross-sectional survey of 398 pregnant women attending the antenatal clinic of University of Maiduguri Teaching Hospital. Sample size was estimated using the population descriptive statistics formula with p = .50 and d = .05, Z = 1.96 for the 95 percent confidence level29. The proportion of 50% was determined based on a previous study within the same population of pregnant women30. Pregnant women in any of the three trimesters of pregnancy that had no recent or history of trauma or known co-existing medical or orthopedic condition which might limit ambulatory capability were recruited for the study.
Data collection instruments
The Pregnancy Physical Activity Questionnaire (PPAQ) was used to assess physical activity during pregnancy and consists of 32 activities: household/caregiving activities (thirteen items), occupational activities (five items), sports/exercise activities (eight items), transportation activities (three items), and inactivity (three items). The PPAQ measures the frequency and duration of activities and gives an intensity value to each activity. The activities can be analyzed by type, by intensity or for the total energy expenditure. The total time spent in physical activity per week was calculated by multiplying the self- reported time spent on each physical activity per day by the activity intensity based the on PPAQ. Pregnant women who reported more than 2h of moderate intensity of physical activity per week were deemed to meet the international guideline9,31,32. Activities were also categorized as sedentary (<1.5 METs), light intensity (1.5- <3.0 METs), moderate intensity (>3.0 - <6.0 METs), and vigorous intensity (>6.0 METs) based on the items type as categories in the questionnaire. The PPAQ was validated by 7 days of testing with accelerometer measurements in a group of 54 pregnant women twice with two weeks interval and demonstrated acceptable evidence of validity31.
Health related Quality of Life Questionnaire Short Form 12 (SF12) was used to determine the quality of life of the participants. The SF-12 is a multipurpose short form survey with 12 questions derived from the SF-36 Health Survey33. The questions were combined, scored, and weighted to create two scales that provide glimpses into mental and physical functioning and overall health-related-quality of life. The questionnaire has a good reliability (ICC=0.78) and validity (r=0.56-0.61)34. Responses to the twelve questions were on a Likert scale on the administered questionnaire and scored questionnaire was later entered into the computer on the internet software version of the questionnaire to obtain the overall scores. There are two component score; the Physical Component Score (PCS) and the Mental Component Score (MCS). The two scores (PCS and MCS) were based on a percentage score and an average score for both the PCS and MCS was calculated to obtain the quality of life score for the pregnant women. The scale uses a cut-off for an individual‘s score to determine variability from the population which is based on the standard error of measurement. The calculated 95% confidence interval for the general population Physical Composite Scale was ±6.97; and for the Mental Composite Scale was ±6.2433. Therefore, each derived score of the quality of life and its composites (PCS and MCS) were determined to be either below average (poor), average or above average (good) score and those that were within average were rated to be moderate.
Study procedure
on a 95% agreement using the two-way random Intraclass Correlation (ICC=0.69, 95% CI=0.59-0.77). The research assistant being a female was helpful in taking the measurement for the pregnant women. The participants‘ language of preference and a one-on-one detailed explanation about the research was offered. Pregnant women were screened and those with any orthopedic and systemic conditions that may interfere with the study were excluded. A written informed consent from the participants was obtained.
The questionnaire was administered and anthropometric measurement of weight, height, and waist and hip circumference were obtained. Height was measured using a Stadiometer and weight with a weighing scale (Hanna bathroom scale model, China. BNo: 29072184). The measurements of body height and weight of the participants was performed with the subject wearing light indoor clothing and no shoes. While an inelastic tape rule (150cm long. Butterfly brand, China) was used to measure hip and waist circumference using the greater trochanter and umbilicus as reference points for the hip and waist circumferences respectively. The waist-hip ratio was derived by dividing the waist circumference by the hip circumference of the participants. Height and circumferential measurements were recorded to the nearest 0.1 centimeter (cm), while weight was measured to the nearest 0.1 kg.
Data analysis
Descriptive statistics of mean and standard deviation, and frequencies and percentages were computed to summarize the socio-demographics, physical activity and quality of life score for the participants. One-way ANOVA (for continuous data) and Chi square statistics (for categorical data) were used as appropriate to compare trimester of pregnancy across socio-demographic, anthropometrics, physical activity and quality of life scores of the pregnant women. The Spearman correlation coefficient was used to determine the relationship between quality of life composites scores and physical activity domains and intensities. Also, a separate logistic regression analyses for sufficient physical activity as dependent variable was
conducted with the full sample to calculate the unadjusted and adjusted odd ratios (ORs) and 95% confidence intervals (CI) for each category of poor, moderate and good composite score on physical and mental domains and the overall quality of life. Adjustments were made for socio-demographic and anthropometric variables in the regression analyses. Data was analyzed using SPSS version 22.0 (SPSS, Chicago, IL), at an alpha level of p< 0.05.
Results
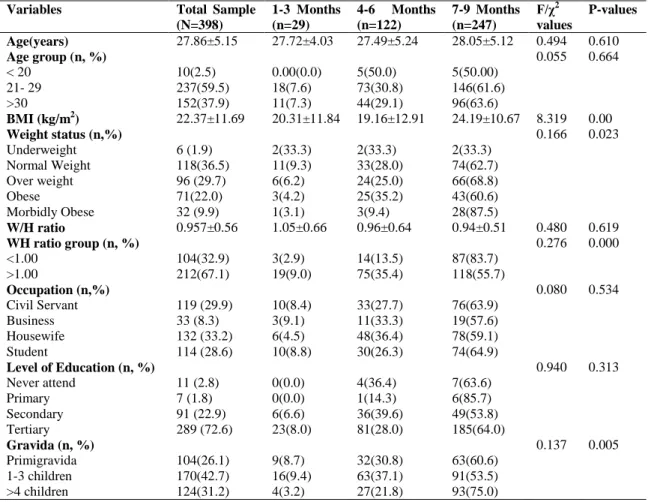
Four hundred and twenty-two pregnant women were provided with a questionnaire, out of which 398 returned the completed survey, giving a response rate of 94.3%. The mean age of the participants was 27.86±5.15, twenty-nine (7.29 %) were in the first trimester, 122 (30.65%) in the second trimester and 247 (62.06%) in the third trimester. Majority of the pregnant women were multiparous (73.9%) of which 72.6% had a tertiary level of education. There were no differences in the type of occupation (χ2
=0.08; p>0.53) and educational level (χ2
=0.94; p>0.31) among the pregnant women by the trimesters of pregnancy. However, significant differences were found in BMI (F=8.32, p=0.001) and WH ratio (χ2
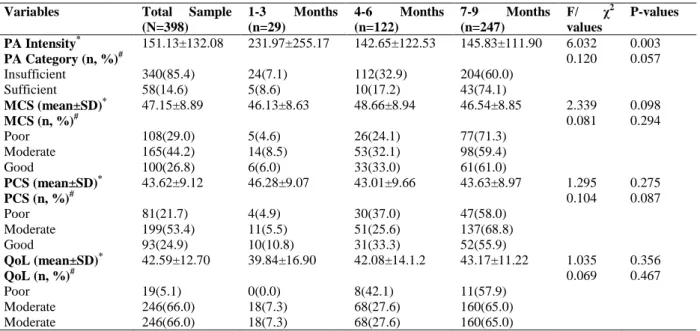
=0.28, p=0.001) across the trimesters of pregnancy. The characteristics of the participants are shown in table 1. The mean physical activity intensities achieved by the pregnant women was 151.13±132.08 MET-min/wk, and only 58 (14.6%) pregnant women achieved the recommended level of physical activity (table 2). There was a significant difference in physical activity intensities by trimester of pregnancy (F=6.03, p=0.003) but the number of pregnant women that achieve enough level of physical activity across the trimesters of pregnancy was insignificant (F=0.12, p=0.06).
Table 1: Socio-demographic characteristics, physical activity, and quality of life among the pregnant women
Variables Total Sample (N=398)
1-3 Months (n=29)
4-6 Months (n=122)
7-9 Months (n=247)
F/χ2
values
P-values
Age(years) 27.86±5.15 27.72±4.03 27.49±5.24 28.05±5.12 0.494 0.610
Age group (n, %) 0.055 0.664
< 20 10(2.5) 0.00(0.0) 5(50.0) 5(50.00)
21- 29 237(59.5) 18(7.6) 73(30.8) 146(61.6)
>30 152(37.9) 11(7.3) 44(29.1) 96(63.6)
BMI (kg/m2) 22.37±11.69 20.31±11.84 19.16±12.91 24.19±10.67 8.319 0.00
Weight status (n,%) 0.166 0.023
Underweight 6 (1.9) 2(33.3) 2(33.3) 2(33.3)
Normal Weight 118(36.5) 11(9.3) 33(28.0) 74(62.7)
Over weight 96 (29.7) 6(6.2) 24(25.0) 66(68.8)
Obese 71(22.0) 3(4.2) 25(35.2) 43(60.6)
Morbidly Obese 32 (9.9) 1(3.1) 3(9.4) 28(87.5)
W/H ratio 0.957±0.56 1.05±0.66 0.96±0.64 0.94±0.51 0.480 0.619
WH ratio group (n, %) 0.276 0.000
<1.00 104(32.9) 3(2.9) 14(13.5) 87(83.7)
>1.00 212(67.1) 19(9.0) 75(35.4) 118(55.7)
Occupation (n,%) 0.080 0.534
Civil Servant 119 (29.9) 10(8.4) 33(27.7) 76(63.9)
Business 33 (8.3) 3(9.1) 11(33.3) 19(57.6)
Housewife 132 (33.2) 6(4.5) 48(36.4) 78(59.1)
Student 114 (28.6) 10(8.8) 30(26.3) 74(64.9)
Level of Education (n, %) 0.940 0.313
Never attend 11 (2.8) 0(0.0) 4(36.4) 7(63.6)
Primary 7 (1.8) 0(0.0) 1(14.3) 6(85.7)
Secondary 91 (22.9) 6(6.6) 36(39.6) 49(53.8)
Tertiary 289 (72.6) 23(8.0) 81(28.0) 185(64.0)
Gravida (n, %) 0.137 0.005
Primigravida 104(26.1) 9(8.7) 32(30.8) 63(60.6) 1-3 children 170(42.7) 16(9.4) 63(37.1) 91(53.5) >4 children 124(31.2) 4(3.2) 27(21.8) 93(75.0)
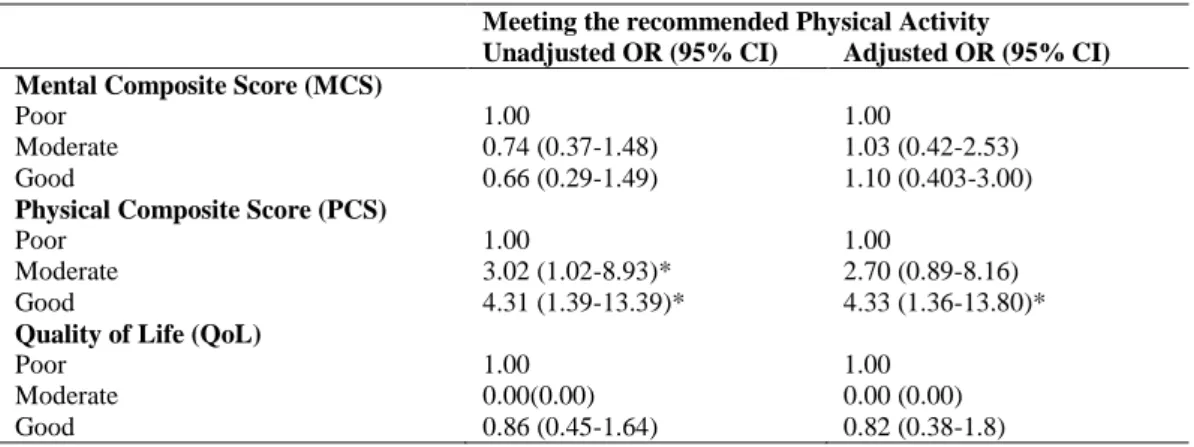
―sedentary activities‖ and quality of life (r=0.111, p<0.05) and between only one domain (sports/exercise activities) and PCS (r=0.142, p<0.01). Out of the nine items of perceived quality of life tested, only two items (moderate and good) of the PCS are associated with enough physical activity (table 4). Pregnant women that shows a moderate (OR=3.02, 95% CI= 1.02-8.93) and good (OR=4.31, 95% CI=1.39-13.39) PCS were thrice and four times respectively more likely to achieved enough physical activity compared to those who perceived poor PCS. However, after adjusting for socio-demographic and anthropometric variables only pregnant women that perceived their PCS as good (OR=4.33, 95% CI=1.36-13.80) were more likely to achieve enough level of physical activity.
Discussion
Table 2: Differences in physical activity and quality of life among pregnant women across the gestational periods (trimesters)
Variables Total Sample (N=398)
1-3 Months (n=29)
4-6 Months (n=122)
7-9 Months (n=247)
F/ χ2
values
P-values
PA Intensity* 151.13±132.08 231.97±255.17 142.65±122.53 145.83±111.90 6.032 0.003
PA Category (n, %)# 0.120 0.057
Insufficient 340(85.4) 24(7.1) 112(32.9) 204(60.0)
Sufficient 58(14.6) 5(8.6) 10(17.2) 43(74.1)
MCS (mean±SD)* 47.15±8.89 46.13±8.63 48.66±8.94 46.54±8.85 2.339 0.098
MCS (n, %)# 0.081 0.294
Poor 108(29.0) 5(4.6) 26(24.1) 77(71.3)
Moderate 165(44.2) 14(8.5) 53(32.1) 98(59.4)
Good 100(26.8) 6(6.0) 33(33.0) 61(61.0)
PCS (mean±SD)* 43.62±9.12 46.28±9.07 43.01±9.66 43.63±8.97 1.295 0.275
PCS (n, %)# 0.104 0.087
Poor 81(21.7) 4(4.9) 30(37.0) 47(58.0)
Moderate 199(53.4) 11(5.5) 51(25.6) 137(68.8)
Good 93(24.9) 10(10.8) 31(33.3) 52(55.9)
QoL (mean±SD)* 42.59±12.70 39.84±16.90 42.08±14.1.2 43.17±11.22 1.035 0.356
QoL (n, %)# 0.069 0.467
Poor 19(5.1) 0(0.0) 8(42.1) 11(57.9)
Moderate 246(66.0) 18(7.3) 68(27.6) 160(65.0)
Moderate 246(66.0) 18(7.3) 68(27.6) 160(65.0)
*
Values based on ANOVA statistics for continuous variables and #chi-Square Statistics for categorical variables PA: Physical Activity, MCS: Mental Composite Score, PCS: Physical Composite Score, QoL: Quality of Life
Table 3: Relationship between quality of life and physical activity domain and intensity of pregnant women in Maiduguri, Nigeria
Variables PCS MSC Quality of Life Physical Activity
Intensities
Sedentary Activities 0.052 0.075 0.111* Light intensity
Activities
-0.024 0.033 0.035
Moderate intensity Activities
0.095 -0.036 0.062
Vigorous intensity activities
0.091 -0.062 -0.045
Physical Activity Domains
Household 0.0.16 -0.012 0.049 Occupational 0.083 -0.013 0.050
Sport 0.142** -0.06 0.043
Transport 0.61 -0.051 0.022 Inactivity 0.043 0.024 0.051
PCS: Physical Composite Score, MCS= Mental Composite Score, **=p<0.01; *=p<0.05
health component of quality of life. Perhaps, household, transportation and occupational activities are usually less pleasant compared to sports/exercise which might be the reason for the improved physical wellbeing and quality of life.
The low proportion (13.6%) of pregnant women meeting the recommended level of physical activity in the present study is comparable to those of Petersen et al.35, Evenson et al.36, Brunette et al.37 and Adeniyi, et al38, that reported prevalence rate of pregnant women meeting the recommended activity level as 16%, 15.8%, 16.7%, and 10.2%, respectively. The finding of low proportion of pregnant women meeting the international recommended level of physical activity in the present study may affirm the global physical inactivity behaviour among pregnant women both in the developed and developing countries. However, quality of life among the pregnant women remains virtually the same throughout pregnancy. This is inconsistent with the finding of a previous study39 that showed modes fluctuation across the trimesters of pregnancy. The inconsistencies may be due to the multifactorial interplay of the reproductive hormones that influence limbic and stress response system and psychosocial factors such as weight gain and body image, maternal stress and worry. Sleep difficulties change in routine,
Table 4: Association between physical activity and quality of life of pregnant women in Maiduguri, Nigeria
Meeting the recommended Physical Activity
Unadjusted OR (95% CI) Adjusted OR (95% CI) Mental Composite Score (MCS)
Poor 1.00 1.00
Moderate 0.74 (0.37-1.48) 1.03 (0.42-2.53)
Good 0.66 (0.29-1.49) 1.10 (0.403-3.00)
Physical Composite Score (PCS)
Poor 1.00 1.00
Moderate 3.02 (1.02-8.93)* 2.70 (0.89-8.16)
Good 4.31 (1.39-13.39)* 4.33 (1.36-13.80)*
Quality of Life (QoL)
Poor 1.00 1.00
Moderate 0.00(0.00) 0.00 (0.00)
Good 0.86 (0.45-1.64) 0.82 (0.38-1.8)
CI: confidence intervals; OR: odds ratio; * p<0.05; +
Adjusted for age, educational level, type of occupation, trimester of pregnancy, body mass index, parity and number of children.
vulnerability which will consequently affect quality of life during the pregnancy that is regardless of the trimester of pregnancy40. Consistent evidence suggests that physical activity during pregnancy impacts the mental and physical health of the mother and fetus and improves emotional wellbeing and body image of the pregnant women41,42 However, findings in the present study indicate that there is no association between the mental health component of quality of life and physical activity. The lack of association between PA and mental health in this study may be explained by the fact that pregnancy is a period that is associated with depressive moods. It is plausible that the depressive mood in pregnancy tempers the effect of physical activity, thereby mitigating its impact on mental health.
Pregnant women that participated in sport and exercises had better physical health compared to pregnant women that did not take part in sport/exercise. This finding is consistent with that of Wallace et al43 that higher self-esteem and lower fatigue among the group of pregnant women that participate in an aerobic exercise program compared to the sedentary control group. Similarly, Hall and Kaufmann44 showed that pregnant women with high attendance in exercise classes had better self-image and less tension compared to women who had low attendance. Also, Mourady et al.45, reported that sports/exercise has a positive correlation with several QOL domains. Physical activity was
associated with better ability to walk and cope with the usual leisure-time activities, work, and study46. Pregnant women with higher sedentary behavior tend to have better quality of life. This unexpected finding maybe due to the participants is drawn from a sample with high socioeconomic status. Most of the pregnant women in the present study were gainfully employed and had tertiary level of education, which can be considered as a crude estimate of an affluent group compared to the general population of women in Maiduguri, Northern Nigeria. Culture and society have a lot of influence on the level of physical activity participation47 but pregnancy on the other hand is been regarded a crucial and high-risk period with several adverse effects. In the society, families and friends tend to provide maximal social support that is considered as a privilege that comes with pregnancy26. The act of providing social support to pregnant women entails giving assistance on most physical activity domains such as household chores, transportation and even occupation, and could impact on the amount and intensity of physical activity engaged by the pregnant women with a resultant increase in sedentariness of the pregnant women.
health promotion intervention of promoting physical activity as part of routine antenatal package for pregnant women. However, to fully understand the importance of physical activity on quality of life of pregnant women in Nigeria, future should include broader dimension of quality of life, such as the environment and social support components. A limitation of the study was that its findings cannot be generalized to all pregnant women, because pregnant women in this study were urban healthy pregnant women that are of high socioeconomic status. Also, the use of subjective measurement of physical activity and quality of life may underestimate or exaggerate the amount of physical activity and quality of life reported by the pregnant women. Also, the result must be interpreted with caution because the fact that quality of life is the subjective predictor for the health belief model of physical activity and the multifactorial in nature. In conclusion, perceived health benefit of physical activity using quality of life as a predictor may not explain the health-related benefit of healthy pregnancy in Nigeria. Therefore, health professionals and advocators may have an important contribution to the adoption of a more active lifestyle during pregnancy, especially among sedentary women by enforcing educational tips rather than rely on subjective healthful feedback from the pregnant women to stimulate further physical activity participation. Future studies on the relationship between physical activity and quality of life in complicated pregnancy would provide more insight on this relationship.
Conflict of Interest
The authors declare that they have no conflict of interests regarding the publication of this paper.
Acknowledgments
The authors are grateful to all the women that volunteered for the study.
References
1. Abbaszadeh F, Baghery A and Mehran N. ―Quality of life among pregnant women.‖ Hayat. 2009; 15:41-8.
2. Mirmohammadaliei M, Khakbazan Z, Kazemnejad A and Abbaszadeh F. ―Comparison of quality of life and depression among women with normal and high-risk pregnancies.‖ Hayat. 2007; 13:35-42.
3. McKee MD, Cunningham M, Jankowski KR and Zayas L. ―Health-related functional status in pregnancy: relationship to depression and social support in a multi-ethnic population.‖ Obstetrics and gynecology. 2001; 97(6):988-93.
4. Physical Activity Guidelines Advisory Committee: Physical Activity Guidelines Advisory Committee Report. (2008). Washington, DC: U.S. Department of Health and Human Services. http://www.health.gov/paguidelines/Report/pdf/Co mmitteeReport. pdf. Accessed on 29 April 2012. 5. DaCosta D, Rippen N, Drista M and Ring A. ―Self-
reported leisure time physical activity during pregnancy and rehabilitation to psychological wellbeing.‖ Journal of Psychosocial Obstetrics and Gynaecology, 2003; 24:111-119.
6. Borg –Stein J, Dugan SA and Gruber J. Muculoskeletal aspect of pregnancy. American Journal of physical medicine and Rehabilitation, 2005; 84:180-192. 7. Martins RF and Silva JLPE. ―Prevalência de dores nas
costas na gestação.‖ Review of Associate Medicine Brasil, 2005; 51(3):144-7.
8. Nifa GS, Moreira OC, Oliveira CE and Teodoro BG. A importância do exercício físico para gestantes. 2010; @rgumentandum. [citado 2011 Abr].
Disponivel em:
http://www.sudamerica.edu.br/revista/?p=67 9. American Congress of Obstetricians and Gynaecologists
(ACOG) and Committee on Obstetric Practice, ―‗Exercise during pregnancy and the postpartum period‘. ACOG Committee Opinion Number 267,‖ Obstetrics & Gynecology, 2002; 99(1): 171–173. 10. Fell DB, Joseph KS, Armson BA, Dodds L. ―The impact
of pregnancy on physical activity level.‖ Maternal and Child Health Journal, 2009; 13:597–603 11. Champion,VL and Skinner CS. ―The Health Belief
Model.‖ In: K. Glanz, B. K. Rimer, K. Viswanath, Health behavior and health education: Theory, research, and practice. 4th edition. San Francisco, CA: Jossey-Bass; 2008; 44–46.
12. Bergman P, Grjibovski AM, Hagströmer M, Sallis JF and Sjöström M. ―The association between health enhancing physical activity and neighbourhood environment among Swedish adults; A population-based cross-sectional study.‖ Int J Behav Nutr Phys 2009; 6(8)
13. Sallis JF, Owen N and Fisher EB. ―Ecological models of health behavior. In: K. Glanz, B. K. Rimer, K. Viswanath, Health behavior and health education: Theory, research, and practice. 4th ed. San Francisco, CA: Jossey-Bass, 2008; 465– 486. 14. Devine SG, Buettner PG and Mummery K. ―Correlates of
pregnant mothers attending antenatal clinic on usefulness of prenatal exercise in Osogbo, Osun state, Nigeria.‖ Health Science Journal. 2014; 8 (2). 16. Hjorth MF, Kloster S, Girma T, Faurholt-Jepsen D,
Andersen G, Kæstel P, Brage S and Friis H. ―Level and intensity of objectively assessed physical activity among pregnant women from urban Ethiopia.‖ BMC Pregnancy Childbirth, 2012; 12:154.
17. Dugas LR, Harders R, Merrill S, Ebersole K, Shoham DA, RushEC, Assah FK, Forrester T, Durazo-Arvizu RA and Luke A. ―Energy expenditure in adults living in developing compared with industrialized countries: A meta-analysis of doubly labeled water studies.‖ Am. J. Clin. Nutr. 2011; 93(2):427-41.
18. Dean E. ―Epidemiology as a basis for contemporary Physical Therapy Practice,‖ In Frwnfelter D and Dean E. Cardiovascular and Pulmonary Physical Therapy (Evidence and Practice), fourth edition, Mosby Elsevier 2006; 3-5.
19. Reese SA, Bender BA, Martin LG, Reyes-Salvail FH, Hunt CK, Bates BL, Murayi TM, Feigley FM, Boeselager GN, Pullen PO and Hesser JR. Health Care and Aging Studies Br, Div of Adult and Community Health, National Center for Chronic Disease Prevention and Health Promotion, CDC. Health-related quality of life and activity limitation--eight states, 1995. MMWR Morbidity and mortality weekly report. 1998; 47(7):134-40. 20. Amin SF, Alhani F and Kazemnejad A. The relationship
between planned physical activities and quality of life among women: A cross sectional study. Payesh, 2009; 8:413.
21. Wu PL, Lee M and Huang TT. Effectiveness of physical activity on patients with depression and Parkinson's disease: A systematic review. PLoS ONE 2017;
12(7): e0181515.
https://doi.org/10.1371/journal.pone.0181515 22. Puciato D, Rozpara M and Borysiuk Z. Physical Activity
as a Determinant of Quality of Life in Working-Age People in Wrocław, Poland. Int. J. Environ. Res. Public Health 2018; 15(623): doi:10.3390/ijerph15040623
23. Barbosa AP, Teixeira TG, Orlandi B, de-Oliveira NTB and Concone MHVB. Level of physical activity and quality of life: a comparative study among the elderly of rural and urban areas. Rev. Bras. Geriatr. Gerontol., Rio de Janeiro, 2015; 18(4):743-754. 24. Bahadoran P and Mohamadirizi S. Relationship between
physical activity and quality of life in pregnant women. Iranian Journal of Nursing and Midwifery 2015; 20(2): 282-286
25. Kaunas. Relationship between Quality of Life, Physical Activity and Gestation Week in Pregnant Women, Beign a Final Thesis Prepared by Students and Submitted to the Lithuanian Sports University, Faculty of Sports Biomedicine In Physiotherapy Study Programme. 2017
26. Stefani L, Mascherini G and Galanti G. Indications to Promote Physical Activity during Pregnancy. J. Funct. Morphol. Kinesiol. 2017; (2)31; doi:10.3390/jfmk2030031
27. Bahadoran P and Mohamadirizi S. Relationship between physical activity and quality of life in pregnant women. Iranian Journal of Nursing and Midwifery Research. 2015; 20(2): 282-286.
28. Tendais I, Figueiredo B, Mota J and Conde A. Physical activity, health-related quality of life and depression during pregnancy. Cad. Saúde Pública, Rio de Janeiro 2011; 27(2):219-228.
29. Xu G. Estimating sample size for a descriptive study in quantitative research.‖ Available at http/: www.searchstatistics.com Article ID: 19990603. 1999. Accessed on 23/05/2015 2:35pm
30. Lawan A, Awotidebe AW, Oyeyemi AL and Oyeyemi AY. Patterns and Predictors of Physical Activity among Pregnant Women in Northeast Nigeria. African Journal for Physical Activity and Health Sciences, 2017; 23(4): 549-562
31. Chasan-Taber L, Schmidt MD, Roberts DE, Hosmer D, Markenson G and Freedson PS. Development and validation of a Pregnancy Physical Activity Questionnaire. Medical Science Sports Exercise. 2004; 36: 1750–1760
32. Smith KM and Campbell CG. Physical activity during pregnancy: impact of applying different physical activity guidelines. Journal of Pregnancy 2013; 1(65):617-628.
33. Ware JE, Kosinki M and Keller SD. A 12-item short-form health survey construction of scale and preminary test of reliability and validity. Med Care 1996; 34: 220-233.
34. Cheak-Zamora NC, Wyrwich KW, McBride T.D. Reliability and validity of the SF-12v2 in the medical expenditure panel survey. Quality of Life Research 2009; 18(6): 727-735.
35. Petersen AM, Leet TL and Brownson RC. Correlates of physical activity among pregnant women in the United States. Medical Science Sports Exercise, 2005; 37: 1748-53.
36. Evenson KR, Savitz DA and Huston SL. Leisure-time physical activity among pregnant women in the US. Paediatric Perinatal Epidemiology 2004; 18(6):400-407
37. Brunette EL, Kotze J, Wood PS, Du-Toit P and Grant CC. An epidemiological study of physical activity patterns and weight gain in physically active and sedentary pregnant women in Tshwane, South Africa. African Journal for Physical, Health Education, Recreation and Dance, March (Supplement), 2012; 132-143.
38. Adeniyi AF, Ogwumike OO and Osinike CI. Physical Activity and Energy Expenditure: Findings from the Ibadan Pregnant Women‘s Survey. African Journal of Reproductive Health 2014; 18(2):117-126.
287:762–765.
40. Chrousos GP, Torpy DJ and Gold PW. Interactions between the hypothalamic-pituitary-adrenal axis and the female reproductive system: clinical implications. Ann Inter Med 1998; 129:229–240. 41. U.S. Department of Health and Human Service 2008;
ODPHP Publication No U0036. U.S. Department of Health & Human Services; Bethesda, MD: Physical Activity Guidelines for Americans. 42. Vladutiu C, Evenson KR and Marshall S. Physical
activity and injuries during pregnancy. J Phy Act H 2010; 7:761–769.
43. Wallace A, Boyer D and Dan A. Aerobic exercise. Maternal self-esteem and physical discomforts during pregnancy. J N Mid, 1986; 31: 255-262. 44. Hall DC and Kaufmann DA. Effects of aerobic and
strength conditioning on pregnancy outcomes. Am J Obs Gyn 1987; 157:1199–1203.
45. Mourady D, Richa S, Karam R, Papazian T, Hajj MF, El Osta N, Kesrouani A., Azouri J., Jabbour H. Hajj A and Khabbaz LR. Associations between quality of life, physical activity, worry, depression and insomnia: A cross-sectional designed study in healthy pregnant women. PLoS ONE 2017; 12(5): e0178181.
https://doi.org/10.1371/journal.pone.0178181 46. Kolu P, Raitanen J and Luoto R. Physical Activity and
Health-Related Quality of Life During Pregnancy: A Secondary Analysis of a Cluster-Randomised Trial. Matern Child Health J. 2014; 18:2098–2105. DOI 10.1007/s10995-014-1457-4