www.ijte.net
Implementing Technology: Measuring
Student Cognitive Engagement
Mekca Wallace-Spurgin
Nova Southeastern University, USA
To cite this article:
Wallace-Spurgin, M. (2020). Implementing technology: Measuring student cognitive
engagement.
International Journal of Technology in Education (IJTE), 3
(1), 24-38.
Volume 3, Issue 1, Spring 2020
ISSN: 2689-2758
Implementing Technology: Measuring Student Cognitive Engagement
Mekca Wallace-Spurgin
Article Info
Abstract
Article History
Received: 5 September 2019
In an effort provide access to devices and prepare students for the future, a small rural high school committed to becoming a high-tech school. However, data collected using the IPI-T process suggested teachers were typically the users of the technology, students were often disengaged, and teachers were asking students to participate in lower-order surface activities. Missing from the process was the implementation of the faculty collaborative sessions. The year after the initial rollout of the devices, IPI-T data was collected three times. Additionally, faculty collaborative sessions were planned and facilitated within one week of collection data. Participating in each faculty collaborative session, teachers (a) became familiar with the IPI-T Rubric and Protocols, (b) analyzed and discussed the data, (c) identified high-quality examples of student learning that foster student engagement with technology, (d) designed high-quality lessons that foster student engagement with technology, (e) compared longitudinal data and set goals for future data collection using the IPI-T tool. An analysis of the data revealed when implementing the IPI-T process with fidelity teacher and student technology use increased as did student cognitive engagement when using technology. In addition, it was found that students use technology for information searches the majority of the time rather than media development or to collaborate among peers for example, which is associated with higher-levels of cognitive engagement.
Accepted: 6 November 2019
Keywords
Educational technology Student cognitive engagement
Instructional practices Inventory – technology Technology integration
Introduction
Many schools and districts have spent a significant amount of money in an effort to become 1:1 with their devices or at the very least considered high-tech schools (Cuban et al., 2001; Russell et al., 2003; Zhao et al., 2002). McClure, Jukes, and MacLean (2011) maintained, rather than racing to purchase ‗stuff‘, there is a need to shift teacher practice, and collaboratively work to change pedagogy, teaching, learning, and assessment to impact student success. Ultimately district leaders and faculty find themselves in a position of wondering how they might utilize the newly purchased devices to increase student cognitive engagement as well as achievement in an effort to justify their recent technology expenditures (Cuban et al., 2001; Pambayun, 2019; Russell et al., 2003; Yahya & Adebola, 2019; Zhao et al., 2002). Adding to this challenge, teachers living in rural, high poverty areas don‘t have the same access to digital resources, technology, and professional development opportunities to gain the knowledge and skills to integrate technology in a way that encourages student cognitive engagement as larger, neighboring districts (Howley, Wood, & Hough, 2001).
Valentine (2013) stated, ―Cognitive psychologists studying engagement for many years noted that as students get older and progress through the K-12 learning experience, the pattern of focus during learning time declines‖ (p. 1). Furthermore, Valentine (2013) reported that students are typically engaged in HO/D thinking activities only 60-70 minutes per day. ―Increasing the HO/D time by 15 minutes means an HO/D increase of about 20-25%...translates into an increase of 2-3% high stakes pass rates over two years; an increase of 8-10 full school days of more HO/D thinking per year and a conservative estimate of 100-125 school days of more HO/D thinking during a thirteen year schooling experience (Valentine, 2013, p. 1). Valentine (2012c) has collected tens of thousands of codes, educating more than 23,000 educators in the IPI-T data collection process. Valentine (2012c) explained, ―Findings from our quantitative studies of the relationships between IPI-T cognitive engagement data and achievement parallel findings from other studies of the past two to three decades, i.e. increasing engagement and higher-order deeper thinking during learning time and conversely reducing disengagement during learning time positively influence student academic success‖ (p. 1).
Students’ Technology Experiences
Today technology is woven into our student‘s lives. According to Prensky (2001a), students today are, ―native speakers of the digital language of computers, video games, and the Internet‖ (p. 1). Prensky called these native speakers Digital Natives. Demographers and social scientists studying populations and the human society have coined the most recent generation of children entering preschool and kindergarten as Generation Alpha (Culala, 2016). These children are following Generation Z and while Generation Z make up about 30% of the global population, Generation Alpha children making their entrance into the world in 2010, are increasing nearly 2.5 million every week (Culala, 2016 & McCrindle 2018). Others prefer to not assign labels to learners today as they state, ―these terms and their meanings do not accurately represent every individual that might fall into such categories‖ (Milman, 2009, p. 59). Empirical evidence has shown the use of digital technology is growing and there is a need to focus on digital learners, not digital natives (Autry & Berge, 2011; Bullen, Morgan, Qayyum & Qayyum 2011; Bozoglan, Demirer, & Sahin, 2013, 2014; Milman, 2009; Yurt, Kurnaz, & Sahin, 2014).
Digital tools available today for learning, teaching, and communicating are different (Milman, 2009; Celik, Sahin, Aydin, Akturk, & Kiray, 2015; Teke, Sahin, & Sadi, 2016). The Harris Poll conducted a survey in 2013 and found 92% of the teachers polled said ―they think EdTech tools should be used in the classrooms but only 14% of them are actually integrating technologies into their curriculum‖ (as cited by Culala, 2016). Alphas are predicted to be highly immersed with technologies (Culala, 2016; McCrindle, 2018). According to Culala (2016) students are not simple users but ―they are born with a ‗tech thumb‘‖. Living in a highly mobile and technologically advanced society today‘s students prefer to communicate using social media, they were born into a world where Internet has always been available, and are the first fully global generation, who prefer Google and YouTube over lectures and PowerPoint presentations (Billings, Kowalski, & Shatto, 2016; Culala, 2016; Rothman, 2014; Shatto &Erwin, 2017). Prensky (2001a), maintained that students today think and process information differently than others before them. Supported by social psychologists is the theory of neuroplasticity; this theory is based on the premise that individuals thought process pattern changes with their experiences (Autry & Berge, 2011). As cited by Prensky (2001b), Dr. Bruce D. Perry of Baylor College of Medicine has found ―different kinds of experiences lead to different brain structures‖ (p. 1). Technology‘s influence on brain development of today‘s students implies the need to make thoughtful and informed decisions about the engagement of learners and changing instruction to meet the needs of today‘s learners (Autry & Berge, 2011; Milman, 2009; Prensky, 2001a, Tapscott, 2009). As the most technologically literate group of children enter the classroom, it is necessary to look at current educational practices and consider ―the skills, competencies, values needed on the future global age, and how generation alpha should be prepared, scholastically‖ (Culala, 2016). However, changing current educational practices regarding the use and integration of technology can be complex and messy (Zhao, Pugh, Sheldon, & Byers, 2002).
Teachers’ Technology Experiences
(2018) considered the second order-internal barriers, teachers‘ value beliefs as the ―most proximal determinant of technology integration‖ regarding them most important to using technology for learning (Ertmer, 1999; Ertmer and Ottenbreit-Leftwich, 2010; Ertmer et al., 2012).
Over the past 30 years, hundreds of studies have been conducted to determine how a particular type of technology impacts student learning, which technological innovation is ―more of less effective than traditional instruction‖, however, little research has been conducted to determine how and why American teachers use technology (Zhao et al., 2002, p. 483). Access to technology in most cases is no longer the major issue (Schrum & Levin, 2015; Zhao et al., 2002); however, computer usage in the classroom among students remains low (Cuban et al., 2001; Wang, Hsu, Campbell, Coster, Longhurst, 2014; Zhao et al., 2002). Removing barriers to technology use such as sufficient time allowance to prepare for technology-integrated instruction (Hew & Brush, 2007; Kopcha, 2012; Vongkulluksn, Xie, & Bowman, 2018) and increasing teacher‘s ability beliefs increases the likelihood teachers will use technology to fulfill instructional goals that are student-centered and lead to student achievement (Kopcha, 2012; Vongkulluksn, Xie, & Bowman, 2018).
Student Cognitive Engagement
Historically student engagement has focused on three areas: increasing achievement, positive behaviors, and a sense of belonging as an effort to retain students (Parsons & Taylor, 2011; Dunleavy, Milton, & Willms, 2012). Recently student engagement has become a strategic process, one in which is built around the goal of enhancing all students‘ abilities to learn how to learn or to become lifelong learners in a knowledge-based society (Parsons & Taylor, 2011). Fredricks, Blumenfeld, and Paris (2004) maintained student engagement is a complex process that can be divided into three basic categories—behavioral, emotional and cognitive:
1. Behavioral engagement draws on the idea of participation; it includes involvement in academic and social or extracurricular activities and is considered crucial for achieving positive academic outcomes and preventing dropping out.
2. Emotional engagement encompasses positive and negative reactions to teachers, classmates, academics, and school and is presumed to create ties to an institution and influence willingness to do the work. 3. Cognitive engagement draws on the idea of investment; it incorporates thoughtfulness and willingness to
exert the effort necessary to comprehend complex ideas and master difficult skills.
For the purpose of this review, the focus will be on the latter, student cognitive engagement. While definitions vary, cognitive engagement is defined by Fredericks, Blumenfeld, and Paris (2004) as ―a psychological investment in learning, a desire to go beyond the requirements of school, and a preference for challenge‖ (p. 7). Adapted from Fredericks et al. (2004), student cognitive engagement is ―The expenditure of thoughtful energy needed to comprehend complex ideas in order to go beyond the minimal requirements‖ (as cited by Finn and Zimmer, 2012, p. 102). According to Finn and Zimmer (2012), ―[h]igh levels of cognitive engagement facilitate students‘ learning of complex material‖ (p. 102-103). Finn and Zimmer found behaviors that are suggestive of cognitive engagement include ―asking questions for the clarification of concepts, persisting with difficult tasks, reading more than the material assigned, reviewing material previously, studying sources of information beyond those required, and using self-regulation and other cognitive strategies to guide learning‖ (p. 102-103).
Measuring Student Engagement
Figure 1.Measuring Student Engagement (Reprinted with permission from Kathleen Mooney)
Among the 21 instruments reviewed was the IPI. Other observational measures included in the review were the Behavioral Observation of Students in Schools (BOSS), the Classroom AIMS, and the Code for Instructional Structure and Student Academic Response (MS-CISSAR). In comparison, the BOSS, is used with prekindergarten through grade 12 students to measure individual student‘ on-task and off-task behavior or academic engagement time to record two categories of engagement and three categories of non-engagement. Developed for use by school psychologists, the instrument is used to screen students at risk of academic failure and for school psychologists, researchers, and evaluators to track the effectiveness of interventions over time. Interobserver reliability of the BOSS after training is reported to be 90-100 percent (Fredricks et al., 2011).
The Classroom AIMs is used with elementary school teachers (K-2) to evaluate multiple domains associated with effective teaching practices: atmosphere, instruction/content, management, and student engagement. Engagement is further measured with four items: students on task and highly engaged in class activities; self-regulated behaviors; participating in class; and expressing excitement. Classroom AIMS is typically used with elementary school teachers, however, the instrument was used in one study with secondary teachers (Fredricks et al., 2011). Stanulis and Floden (2009) reported that within the study, the interrater reliability for individual items was 65 percent and it was unclear which statistics corresponded to the student engagement scale or if the engagement items could be used independently of the whole set of AIMS items (as cited by Fredricks et al., 2011).
When comparing observational measures to assess student engagement, Fredricks et al., (2011) reported the IPI as the only observational measure used to collect data on student cognitive engagement. The IPI and IPI-T was chosen in the targeted school district to determine if students were using the newly purchased Chromebooks as well as if they were cognitively engaged when using technology. In addition to collecting data, the IPI and IPI-T process is used for faculty reflection, instructional change, and school improvement (as cited in Fredricks et al., 2011; Valentine, 2013; Valentine, 2017).
Rationale for Studying Student Engagement
For many years, cognitive psychologists studying cognitive engagement have noted ―that as students get older and progress through the K-12 learning experience, the pattern of focus during learning time declines (as cited by Valentine, 2013, p. 2). Valentine (2013) reported, ―In our IPI data, this is evidenced by the lower average percentages of disengagement during elementary school (2-3%) followed by higher percentages in middle schools (3-4%) and the highest percentages in comprehensive high schools (6-8%)‖ (p. 2). Not surprising when considering today‘s students are different from generations before them (McCrindle, 2014; Prensky, 2005; Schrum & Levin, 2015; Tapscott, 2009). Technology‘s influence on brain development of today‘s students implies the need to make thoughtful and informed decisions about the engagement of learners and changing instruction to meet the needs of today‘s learners (Autry & Berge, 2011; Milman, 2009; Prensky, 2001a, Tapscott, 2009). Many of today‘s students, particularly as they progress to high school, appear to be disengaged, unmotivated, and uninterested in learning (Prensky, 2001a; Prensky, 2005; Schrum & Levin, 2015). Shernoff, Csikszentmihalyi, Schneider, and Shernoff (2003) reported over a quarter of the day, secondary students are in a disconnected state, such as boredom (as cited by Jensen, 2016). Hattie (2012) reported that expert teachers with the ability to assist students in the development of deep and conceptual understandings have an effect size of 1.0 (p. 32-33). Hattie (2012) referred to the ―hinge-point‖ for identifying what is and what is not effective as d=0.40 or an effect size of 0.40 (p.3). In a blog post titled, ―Principal of Change: Stories of Learning and Leading‖, Couros (2013) described what today‘s students need to reach their full potential growing up as 21st century
learners (as cited by Schrum & Levin, 2015). Couros admitted, although technology is not the focus, it does give us many opportunities to magnify the opportunities such as supporting student voice and student choice, providing time for reflection and opportunities for innovations, foster critical thinking and problem-based learning that supports problem solving among students, opportunities for self-assessment, and connected learning through collaboration not just locally but globally (as cited by Schrum & Levin, 2015). In an effort to align current teaching practices with the integration of technology and reach today‘s students, the IPI and IPI-T process assists in the collection of data to get an insight into how students are engaging in the learning during the instructional activity.
Theoretical Perspectives
Empirical evidence shows the use of digital technology is growing, digital tools available today for learning, teaching, and communicating are different (Milman, 2009), and a need to focus on digital learners (Autry & Berge, 2011; Bullen & Morgan, 2011; Milman, 2009). Technology experiences are much different for students today than generations before them. The engagement of faculty in a series of collaborative study sessions of the IPI-T data does not teach faculty how to use educational technology but rather how students are engaging in the learning during the instructional activity. Engagement of faculty in Faculty Collaborative Study Sessions have been shown to have the capacity to remove barriers to technology use by teachers to fulfill instructional goals, increase teachers‘ ability beliefs, increase student usage of technology, and positively impact student cognitive engagement and academic success. The IPI and IPI-T encourages faculty members to work towards a balance of higher and lower levels of student cognitive engagement through incremental changes in instructional practice (Dennis, 2013). The theoretic underpinnings of the IPI and IPI-T process points to a firm grounding in Bloom‘s Taxonomy, Bloom‘s Revised Taxonomy, and the most recent Bloom‘s Digital Taxonomy.
Bloom’s Taxonomy
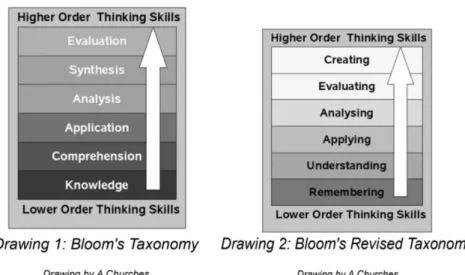
educational objectives according to their cognitive complexity (Churches, 2008; Forehand, 2011; Anderson & Krathwohl, 2001). Referred to as a framework, the taxonomy of educational objectives is made up of six major categories of the cognitive domain (Anderson & Krathwohl, 2001; Bloom, 1956; Krathwohl, 2002). Forehand (2011) stated, ―Bloom‘s Taxonomy is a multi-tiered model of classifying thinking according to six cognitive levels of complexity‖ (p. 2). Depicted as a stairway, many teachers have encouraged their students to ‗climb to a higher (level of) thought‘ (Forehand, 2011, p. 2). The lowest three levels are: knowledge, comprehension, and applications. The highest three levels are: analysis, synthesis, and evaluation. The taxonomy is hierarchical; each level leads up to the higher levels. It is this arrangement or hierarchy that has led to the ‗natural divisions of lower and higher level thinking‘ (Forehand, 2011).
The original taxonomy or framework created by Bloom was a way to classify (Anderson & Krathwohl, 2001; Bloom, 1956; Forehand, 2011; Krathwohl, 2002) what ―we expect or intend students to learn as a result of instruction‖ (Krathwohl, 2002, p. 212). Bloom saw the original Taxonomy as more than a measurement tool and believed it could serve as a common language about learning goals to facilitate communication across persons, subject matter, and grade levels‖ (Krathwohl, 2002). According to Krathwohl (2002), Bloom believed the original taxonomy could serve as a:
1. Common language about learning goals to facilitate communication across persons, subject matter, and grade levels.
2. Basis for determining particular course or curriculum the specific meaning of broad educational goals, such as those found in the currently prevalent national, state, and local standards.
3. Means for determining the congruence of educational objectives, activities, and assessment in a unit, course, or curriculum.
4. Panorama of the range of educational possibilities against which the limited breadth and depth of any particular educational course or curriculum could be considered (p. 212).
Bloom’s Revised Taxonomy
A former student of Bloom‘s, Lorin Anderson along with David Krathwohl, led a group in an effort to update the original Bloom‘s Taxonomy to add relevance for students and teachers in the 21st
century (Churches, 2008; Forehand, 2011; Anderson & Krathwohl, 2001). Major changes include the use of verbs rather than nouns for each category as well as the arrangement of the sequence within the taxonomy and the omission of synthesis and addition of creating (Churches, 2008 & Anderson & Krathwohl, 2001).
Figure 2.Bloom‘s Taxonomy and Revised Taxonomy (Reprinted with permission from Andrew Churches)
Bloom’s Digital Taxonomy
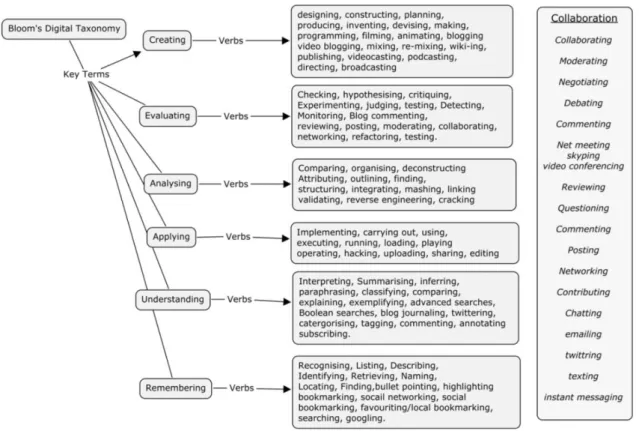
Bloom‘s original taxonomy published in 1956 was made up of six levels of cognitive thinking, structured as a multi-tiered model, 45 years later revised once again. A more recent revision of the original Bloom‘s Taxonomy and the revised Taxonomy is known as Bloom‘s Digital Taxonomy. Created by Andrew Churches in 2008, Churches stated (2008), ―The Original taxonomy and the revised taxonomy by Anderson and Krathwohl are both focused within the cognitive domain. The Digital Taxonomy is not restricted to the cognitive domain rather it contains cognitive elements as well as methods and tooling‖ (p. 2). Bloom‘s Digital Taxonomy ―is about using technology and digital tools to facilitate learning‖ and ―student engagement is defined with ‗power verbs‘‖ (Churches, 2008). The verbs making up the taxonomy include lower-order thinking skills: remembering, understanding, and applying and higher-order thinking skills: analyzing, evaluating, and creating (Churches, 2008).
Figure 3.Mind Map (Reprinted with permission from Andrew Churches)
In an effort to align current teaching practices with the integration of technology and reach today‘s students, the IPI and IPI-T process assists in the collection of data to get an insight into how students are cognitively engaged in the learning during the instructional activity. The IPI and IPI-T encourages faculty members to study the data and think collaboratively about ways to work towards a balance of higher and lower levels of student cognitive engagement through incremental changes in instructional practice (Dennis, 2013).
Description of the Instructional Practice Inventory
protocols and standards were developed to support professional development and the implementation of the IPI process in additional schools. Since its development, more than 22,000 educators have participated in and completed the IPI Level 1 Workshop. Upon completion, educators are certified as IPI data collectors as well as facilitators, enabling them to lead collaborative study sessions (Valentine, ―User Requirements,‖ n.d.).
Description of the Instructional Practice Inventory
In 1995 a professor at the University of Missouri, named Jerry Valentine along with a graduate research assistant, Brian Painter developed the Instructional Practice Inventory (IPI) process. They set out to create a tool that would document ―the degree of change in engagement and instruction‖ during a two-year school improvement project. The project included 10 elementary, 10 middle, and 10 high schools across Missouri. An interesting fact surfaced after using the IPI process from 1996-98 with the targeted schools, when faculty participated collaboratively and studied the data to problem solve the meaning of the data, they were said to have made greater gains instructionally than the faculty that did not collaboratively study their data. The IPI evolved from being a tool to collect data to understand and study the degree of student engagement into a ―process of data collection and collaborative study‖. In 1998-2002 the IPI was used to support school improvement in other Missouri school as well as nationally recognized middle schools. In 2002 a set of protocols and standards were developed to support professional development and the implementation of the IPI process in additional schools. Since its development, more than 22,000 educators have participated in and completed the IPI Level 1 Workshop. Upon completion, educators are certified as IPI data collectors as well as facilitators, enabling them to lead collaborative study sessions (Valentine, ―User Requirements,‖ n.d.).
Instructional Practice Inventory Process
The IPI process is led by teacher-leaders and carried out school-wide to collect data about student engagement. Shortly after the collection of data the teacher-leaders facilitate faculty collaborative sessions in an effort to disseminate the data and participate in collaborative conversations. The process includes informing faculty of the six categories associated with student cognitive engagement so faculty who study the profiles will view the data as a fair and accurate representation of engagement within classrooms. All faculty have the opportunity to reflect upon the data and deepen their understanding of how to most effectively engage students in their respective classrooms (Valentine, 2012c). It is important to note the IPI process is not used for evaluative purposes or by district administrators. In addition, during the data collection process individual teachers are not noted but rather the observation number, class period, subject, and whether the class is part of the core courses or non-core courses.
Instructional Practices Inventory Categories
The IPI Categories are represented numerically (see Appendix A). Each category describes the level of student engagement and is referred to as:
1. Student Active Engaged Learning (Category 6): Students are engaged in higher-order thinking and developing deeper understanding through analysis, problem solving, critical thinking, creativity, and/or synthesis. Engagement in learning is not driven by verbal interaction with peers, even in a group setting. Examples of classroom practices commonly associated with higher-order/deeper Active Engaged Learning include: inquiry-based approaches such as project-based and problem-based learning; research and discovery/exploratory learning; authentic demonstrations; independent metacognition, reflective journaling, and self-assessment; and, higher-order responses to higher-order questions.
2. Student Verbal Learning Conversations (Category 5): Students are engaged in higher-order thinking and developing deeper understanding through analysis, problem solving, critical thinking, creativity, and/or synthesis. The higher-order/deeper thinking is driven by peer verbal interaction. Examples of classroom practices commonly associated with higher-order/deeper Verbal Learning Conversations include: collaborative or cooperative learning; peer tutoring, debate, and questioning; partner research and discovery/exploratory learning; Socratic learning; and, small group or whole class analysis and problem solving, metacognition, reflective journaling, and self-assessment. Conversations may be teacher stimulated but are not teacher dominated.
verbally directs the learning. Examples of classroom practices commonly associated with Teacher-Led Instruction include: teacher dominated question/answer; teacher lecture or verbal explanations; teacher direction giving; and, teacher demonstrations. Discussions may occur, but instruction and ideas come primarily from the teacher. Student higher order/deeper learning is not evident.
4. Student Work with Teacher Engaged (Category 3): Students are engaged in independent or group work designed to build basic understanding, new knowledge, and/or pertinent skills. Examples of classroom practices commonly associated with Student Work with Teacher Engaged include: basic fact finding; building skill or understanding through practice, ‗seatwork‘, worksheets, chapter review questions; and multi-media with teacher viewing media with students. The teacher is attentive to, engaged with, or supportive of the students. Student higher-order/deeper learning is not evident.
5. Student Work with Teacher Not Engaged (Category 2): This category is the same as Category 3 except the teacher is not attentive to, engaged with, or supportive of the students. The teacher may be out of the room, working at the computer, grading papers, or in some form engaged in work not directly associated with the students‘ learning. Student higher-order/deeper thinking is not evident.
6. Student Disengagement (Category 1): Students are not engaged in learning directly related to the curriculum.
The categories are not a hierarchy but rather ―six distinct ways to categorize student engagement‖ (Valentine, 2017). Categories 6 and 5 include learning activities that fall within the higher-order/deeper thinking spectrum of Bloom‘s Taxonomy such as analysis and critical thinking while categories 4, 3, and 2 include lower-order surface thinking activities such as recalling simple facts.
Description of the Instructional Practice Inventory Level I Basic Workshop
The goal is for participants in the IPI Level I Basic Workshop to gain the skills to ―document student engagement using a six-category observation system‖: (a) two categories document the frequency with which students are engaged in higher-order/deeper thinking during learning time; (b) another category assesses the degree of student attentiveness during teacher-led instruction; (c) two categories assess the degree to which students are engaged during seatwork, practice, skill development and other forms of surface learning; (d) and, one category documents the degree to which students are disengaged during learning time (Valentine, 2012c). All data collectors and facilitators of the faculty collaborative study of the data are required to have successfully completed an IPI Level 1 Workshop. The workshop is eight hours and designed to prepare teacher-leaders to collect IPI data within their own schools with ―validity, reliability, and inter-rater reliability as well as develop strategies for leading the faculty in the collaborative study of the data‖ (Valentine, 2012c).
Description of the Instructional Practice Inventory – Technology
Early discussions in 2010-2011 among Valentine, technology specialists, teachers, and school leaders, already using the IPI data collection process, led to the piloting and field testing in 2011-12 of the IPI-T data collection process. The IPI-T is an ‗add-on‘ component designed for schools that have experience with the IPI process and are currently 1:1 (one technology device per student) or planning to soon become 1:1 or high-tech schools. The IPI-T process builds upon the work of the basic IPI process and provides additional data that allow the faculty to understand student cognitive engagement when technology is being used to support the learning experience as compared to classes when technology is not associated with the learning experience. Additional components are documented as well: (a) how technology is being used to support learning; (b) the type of technology used to support the learning experience; (c) the designer of the technology; (d) the primary user of the technology, the teacher or student. Data can be disaggregated by faculty multiple ways to match their goals for student cognitive engagement (Valentine, 2015a; Valentine, 2015b).
Instructional Practices Inventory- Technology Process
for all students and one for ‗only the tech students‘. The data collector also documents how technology is being used for learning (see Appendix B). Once again it is important to note neither the IPI or IPI-T process should not be used for evaluative purposes or by district administrators. In addition, during the data collection process individual teachers are not noted but rather the observation number, class period, subject, and whether the class is part of the core courses or non-core courses. All persons being observed remain anonymous (Valentine, 2015a).
Instructional Practices Inventory- Technology Categories
There are six IPI-T categories. Each category describes the level of student cognitive engagement and are referred to as (1) Student Disengagement; (2) Student Work with Teacher Not Engaged; (3) Student Work with Teacher Engaged; (4) Teacher-led Instruction; (5) Student Verbal Learning Conversations; (6) Student Active Engaged Learning. The IPI and the IPI-T both utilize each of the six categories. It is important to note that the categories are not considered a hierarchy but rather ―six distinct ways to categorize student engagement‖ (Valentine, 2017). Categories 6 and 5 include learning activities that fall within the higher-order, deeper thinking spectrum of Bloom‘s Taxonomy and Bloom‘s Digital Taxonomy such as analysis and creating while Categories 4, 3, and 2 include lower-order, surface thinking activities such as recalling simple facts and googling for answers.
Tech-use Categories and Definitions
Following is a brief explanation of the Tech-Use Categories and definitions (see Appendix C). The categories provide faculty with details about how students are cognitively engaged for each form of tech use.
1. Word Processing. The students are using technology to produce written documents. This category includes note taking, composing papers, editing, formatting, and printing the written material.
2. Math Computations. The students are using technology to perform mathematical computations. This category includes calculating, charting, and plotting with hand-held calculators, spreadsheets, and statistical formulae.
3. Media Development. The students are using technology to collect, manipulate, and/or create media. This category includes the use of technology to collect, edit, and/or design photo, video, and/or audio data and presentations, as well as programming, writing code, and web development.
4. Information Search. The students are using technology to search and/or gather information for their learning task. This category includes the use of the Web and/or other media to access facts, information, and/or insights available through the use of technology.
5. Collaboration among Individuals. The students are using technology to interact with and/or collaborate with others to accomplish their learning task. This category includes the use technology for all forms of synchronous (same time, usually verbal), communication and many forms of near-synchronous (intermittent or streamed, usually text chat) communication.
6. Experience-Based Immersion Learning. The students are using technology to engage in a tech-driven, immersion learning experience. This category includes the use of technology to engage students in game-based software, intense interactive simulations, and virtual reality associated with classroom learning goals.
7. Interactive/Presentation Technology. The students and/or teacher are using an interactive or presentation tech tool to support the learning task. This category includes us of software that supports the transfer of information among students and between students and teachers.
8. Other. Occasionally the data collector may determine that none of the seven options adequately describe how students are using technology. This ―other‖ option should be marked if that is the case. However, selection of this ―other‖ option is extremely unusual.
the likelihood the school will see positive academic results from their use of the IPI‖ (p. 1). Missing from the process during the 2017-18 pilot of the IPI-T was the implementation of faculty collaboration sessions. The sessions provide faculty with time to study the data after each data collection, engage faculty in reflecting about the data, create collaborative learning experiences to build new knowledge, and allows faculty voice in establishing annual cognitive engagement goals.
Description of the Instructional Practices Inventory - Technology Workshop
The IPI Level I Basic Workshop and the IPI-T Component Workshop are both full-day workshops. In the IPI Level I Workshop participants gain the skills to ―document student engagement using a six-category observation system‖ (Valentine, 2012a). The IPI-T Component Workshop does not teach participants how to code the six IPI categories due to time constraints and the necessary time needed to teach the IPI process as well as the IPI-T process. Therefore, all participants in the IPI-T Component Workshop must have successfully completed the IPI Level I Workshop with an accuracy score of .80 or higher (Valentine, 2015a).
During the IPI-T Component Workshop, technology is used to view practice examples and to understand the data coding, data entry, and data reporting spreadsheets that accompany the IPI-T process. Coding skills are developed via practice examples and guided practice in classrooms in which technology is being used to support learning. Data collection reliability is the data collector‘s accuracy across multiple similar observations. This means when a data collector sees student engagement of a particular type (both in the IPI and IPI-T coding process) at two different times (8:00 a.m. and again at 2:00 p.m.) the observer is making the same (correct) code for the two scenarios. During the IPI Level I Workshop and the IPI-T Component Workshop participants complete 40 to 50 practices codes. Each coding scenarios can be very different in nature to highly similar. Scenarios provided cover different classroom learning contexts as well as a variety of grade levels in an effort to establish coder‘s consistent competence (―Users Requirements‖ n.d.).
The process for developing the data collector‘s validity, reliability, and inter-rater reliability during is the central focus during both IPI Level I Basic Workshop and the IPI-T Component Workshop. Participants are given multiple scenarios to code independently and then share out with the entire workshop participants in to allow each participant to recognize their growth in coding throughout the day but also to realize they are growing together and building inter-rater reliability as they work together. This transformation is crucial in the IPI and IPI-T learning process because data collectors must have confidence that their colleagues who are collecting data are coding just as accurately as they are throughout the school day (―Users Requirements‖ n.d.).
Description of Faculty Collaborative Study Sessions
According to Valentine (2017), ―When IPI/IPI-T data are collected for the purposes of school improvement, all teachers should have the opportunity to study the data and reflect upon their perceptions of effective learning/instructions‖ (p. 3). Faculty should converse about best practices and the value of the six categories. Once a baseline is established, discussions about how to change the engagement profiles over time should occur to ensure instructional design and teaching practices evolve.
Profiles of many schools have been collected by Valentine. His findings indicate that conversations about the IPI/IPI-T data should take place in a setting of ―trust and inquiry, where teachers can be open, not defensive, about profile data‖ (Valentine, 2017). Valentine, (2017) suggested when studying the data faculty should be reminded the data represent a ‗snapshot in time‘ of the entire school‘s learning experiences, secondly the six categories are ‗discreet‘ not ‗continuous‘, categories three through six are of value of different times throughout the lesson, next the six categories are not a hierarchy, and finally the six categories are distinct ways to categorize student cognitive engagement. Strategies prescribed by Dr. Jerry Valentine (2012b) include:
1. Create a school IPI-T team
2. Educate the faculty about the process 3. Support the IPI-T team and the process 4. Collect data multiple times per school year 5. Inform the faculty of upcoming data collections 6. Collect systematic, proportionate samples
10.Create collaborative learning experiences to build new knowledge 11.Disaggregate data per faculty requests
12.Establish annual cognitive engagement goals which support higher-order deeper thinking skills 13.Arrange the setting for collaborative faculty learning
14.Understand faculty perspectives and progress accordingly
The first data collection profile should serve as baseline data and future data collections provide longitudinal perspectives of engaged learning for the school. Valentine (2017) recommends each school collect data four times each school year to achieve optimum impact. Teacher leaders collecting the data should engage faculty in studying the data to identify patterns, trends, and changes in each data profile as well as establish and deliver purposeful professional development and continuous conversations. Valentine (2017) stated, ―To make a difference in student cognitive engagement, the faculty IPI/IPI-T collaborative conversations must progress from merely studying profile percentages to learning discussions that deepen knowledge, build a commitment to refinement of instructional practices, particularly increasing higher-order/deeper thinking time and reducing disengagement during class time‖ (p. 3). Valentine (2012c) has collected tens of thousands of codes, educating more than 23,000 educators in the IPI-T data collection process. Valentine (2012c) explained, ―Findings from our quantitative studies of the relationships between IPI-T cognitive engagement data and achievement parallel findings from other studies of the past two to three decades, i.e. increasing engagement and higher-order deeper thinking during learning time and conversely reducing disengagement during learning time positively influence student academic success‖ (p. 1).
The IPI-T was created through the collaborative discussions among Dr. Jerry Valentine, technology specialists, teachers, and school leaders in an effort to address the growing use of technology in the classroom. The IPI-T was built upon the work of the basic IPI process to provide faculty with additional data to understand student cognitive engagement when technology is being used in the classroom. It is a walkthrough observation process designed to collect data concerning how often and in what ways teachers are integrating technology as well as how often students are cognitively engaged in higher-order, deeper (HO/D) thinking as well as lower-order, surface (LO/S) thinking. The implementation of the IPI-T process includes engaging faculty in collaborative sessions within one week after each data collection. Faculty collaborative sessions allow all faculty to reflect about the data and establish cognitive engagement goals. Implementing the entire IPI-T with fidelity increases the likelihood that the targeted schools will see a positive influence on student achievement as they move toward a 1:1 environment.
Conclusion
Valentine (2012c) has collected tens of thousands of codes, educating more than 23,000 educators in the IPI-T data collection process. Valentine (2012c) explained, ―Findings from our quantitative studies of the relationships between IPI-T cognitive engagement data and achievement parallel findings from other studies of the past two to three decades, i.e. increasing engagement and higher-order deeper thinking during learning time and conversely reducing disengagement during learning time positively influence student academic success‖ (p. 1). Valentine (2013) further explained that students are typically engaged in HO/D thinking activities only 60-70 minutes per day. ―Increasing the HO/D time by 15 minutes means an HO/D increase of about 20-25%...translates into an increase of 2-3% high stakes pass rates over two years; an increase of 8-10 full school days of more HO/D thinking per year and a conservative estimate of 100-125 school days of more HO/D thinking during a thirteen year schooling experience (Valentine, 2013, p. 1).
References
Anderson, L. W., & Krathwohl, D. R. (2001). A Taxonomy for Learning, Teaching and Assessing: A Revision of Bloom‘s Taxonomy of Educational Objectives: Complete Edition. New York: Longman.
Autry, Alex J., Jr, & Berge, Z. (2011). Digital natives and digital immigrants: Getting to know each other.
Industrial and Commercial Training, 43(7), 460-466. doi:10.1108/00197851111171890
Billings, D. M., Kowalski, K. & Shatto, B. (2016). Moving on from millennials: Preparing for Generation Z.
The Journal of Continuing Education in Nursing, 47(6), 253-254.
Bozoglan, B., Demirer, V., & Sahin, I. (2013). Loneliness, self‐esteem, and life satisfaction as predictors of Internet addiction: A cross‐sectional study among Turkish university students. Scandinavian Journal of Psychology, 54(4), 313-319.
Bozoglan, B., Demirer, V., & Sahin, I. (2014). Problematic Internet use: Functions of use, cognitive absorption, and depression. Computers in Human Behavior, 37, 117-123.
Bullen, M., Morgan, T., Qayyum, A. & Qayyum, A. (2011). Digital Learners in Higher Education: Generation is Not the Issue. Canadian Journal of Learning and Technology / La revue canadienne de l’apprentissage et de la technologie, 37(1). Canadian Network for Innovation in Education. Retrieved from https://www.learntechlib.org/p/42755/
Celik, I., Sahin, I., Aydin, M., Akturk, A.O., & Kiray, S.A. (2015). A Structural Equation Model for Understanding Intensive Facebook Uses of Preservice Teachers. In Society for Information Technology & Teacher Education International Conference (pp. 2239-2246). Association for the Advancement of Computing in Education (AACE).
Churches, A. (2008). Bloom‘s digital taxonomy. Retrieved from http://www.ccconline.org/wp-content/uploads/2013/11/Churches_2008_DigitalBloomsTaxonomyGuide.pdf
Couros, G. (2013). Principal of change: Stories of learning and leading. [web log comment]. Retrieved from https://georgecouros.ca/blog/archives/3601
Cuban, L., Kirkpatrick, H., & Peck, P. (2001). High access and low use of technologies in high school classrooms: Explaining an apparent paradox. American Educational Research Journal, 38(4), 813-834. Culala, H. J. D. (2016). Educating generation alpha: What are the demands of the 21st century workforce?
Retrieved from
https://www.academia.edu/24526330/Educating_generation_alpha_What_are_the_demands_of_the_21st _century_workforce
Dennis, L. B. (2013). How Are Teachers Integrating Technology in K-5 Classrooms? Studying Student Cognitive Engagement Using the Instructional Practices Inventory-Technology (IPI-T) Instrument. New Mexico State University, Las Cruces, New Mexico.
Dunleavy, J., Milton, P., & Willms, J. D. (2012). What did you do in school today? Trends in intellectual engagement. Research Series Report Number Three Toronto: Canadian Education Association.
Ertmer, P. A. (1999). Addressing first-and second-order barriers to change: Strategies for technology integration. Educational Technology Research and Development,47(4), 47-61, doi:10.1007/BF02299597 Ertmer, P. A. & Ottenbreit-Leftwich, A. T. (2010). Teacher technology change: How knowledge, confidence,
beliefs, and culture intersect. JRTE, 42(3), 255-284. doi: 10.1080/15391523.2010.10782551
Ertmer, P. A., Ottenbreit-Leftwich, A. T., Sadik, O., Sendurur, E., & Sendurur, P. (2012). Teacher beliefs and technology integration practices: A critical relationship. Computer & Education 59, 423-435, doi:10.1016/j.compedu.2012.02.001
Finn, J. D. & Zimmer, K. S. (2012). Student engagement: What is it? Why does it matter? Handbook of Research on Student Engagement,7(5), 97-131.
Forehand, M. (2011). Bloom‘s taxonomy. Retrieved from
https://www.d41.org/cms/lib/IL01904672/Centricity/Domain/422/BloomsTaxonomy.pdf
Fredericks, J. A., Blumenfeld, P. C., & Paris, A. H. (2004). School engagement: Potential of the concept, state of the evidence. Review of Educational Research, 74, 59-109. doi:10.3102/00346543074001059
Fredricks, J., McColskey, W., Meli, J., Mordica, J., Montrosse, B., and Mooney, K. (2011). Measuring student engagement in upper elementary through high school: A description of 21 instruments. Issues & Answers Report, REL 2011–No. 098. Washington, DC: U.S. Department of Education, Institute of Education Sciences, National Center for Education Evaluation and Regional Assistance, Regional Educational Laboratory Southeast. Retrieved from http://ies.ed.gov/ncee/edlabs
Hattie, J. (2012). Visible learning for teachers: Maximizing impact on learning. New York: Routledge.
Hew, K. F. & Brush, T. (2007). Integrating technology into K-12 teaching and learning: Current knowledge gaps. Education Tech Research and Development, 55(3), 223-252, doi:10.1007/s11423-006-9022-5 Howley, A., Wood, L., & Hough, B. (2011). Rural elementary school teachers‘technology integration. Journal
of Research in Rural Education,26(9), 1-13.
Jensen, E. (2016). Poor students, rich teaching: Mindsets for change. Indiana: Solution Tree Press.
Kopcha, T. J. (2012). Teachers‘ perceptions of the barriers to technology integration and practices with technology under situated professional development. Computers and Education, 59(4), 1109-1121, doi:10.1016/j.compedu.2012.05.014
Krathwohl, D. (2002). A revision of Bloom‘s taxonomy: An overview. Theory into practice: Revising Bloom’s taxonomy41(4), 212-218, doi: 10.1207/s15430421tip4104_2
McCrindle, M. (2014). The ABC of XYZ: Understanding the global generations. Australia: A McCrindle Publication.
McCrindle, M. (2018). What comes after Generation Z? Introducing Generation Alpha [web log comment]. Retrieved from https://mccrindle.com.au/insights/blogarchive/what-comes-after-generation-z-introducing-generation-alpha/
Milman, N. B. (2009). Are students today really different? Distance Learning, 6(2), 59-61. Retrieved from http://search.proquest.com.ezproxylocal.library.nova.edu/docview/230703086?accountid=6579
Pambayun, B., Wirjawan, J. V., Herwinarso, H., Wijaya, A., Untung, B., & Pratidhina, E. (2019). Designing Mobile Learning App to Help High School Students to Learn Simple Harmonic Motion. International Journal on Social and Education Sciences, 1(1), 24-29.
Parsons, J., & Taylor, L. (2011). Improving Student Engagement. Current Issues in Education, 14(1). Retrieved from https://cie.asu.edu/ojs/index.php/cieatasu/article/view/745
Prensky, M. (2001a). Digital Natives, Digital Immigrants, part I. On the Horizon, 9(5), 1-6. Retrieved from http://old.ektf.hu/~kbert/2014_15_01/erasmus/DigitalNativesPartIII.pdf
Prensky, M. (2001b). Digital Natives, Digital Immigrants, part II: Do they really think differently? On the Horizon,9(6),1-10. Retrieved from http://www.taylorprograms.com/images/Marc_Prensky_
Digital_natives_2.pdf
Prensky, M. (2005). Teaching digital natives: Partnering for real learning. Retrieved from
http://marcprensky.com/wp-content/uploads/2013/04/Prensky-TEACHING_DIGITAL_NATIVES- Introduction1.pdf
Prensky, M. (2015). Teaching Digital Natives: Partnering for real learning. California: Corwin.
Rothman, D. (2014). A Tsunami of learners called Generation Z. Retrieved from http://mdle.net/Journal/A_ Tsunami_of_Learners_Called_Generation_Z.pdf
Russell, M., Bebell, D., O‘Dwyer, L., & O‘Connor, K. (2003). Examining teacher technology use implications for preservice and inservice teacher preparation. Journal of Teacher Education, 54(4), 297-310.
Schrum, L. & Levin, B. (2015). Evidence-based strategies for leading 21st century schools. California: Corwin. Shernoff, D. J., Csikszentmihalyi, M., Shneider, B., & Shernoff, E. S. (2003). Student engagement in high
school classrooms from the perspective of flow theory. School Psychology Quarterly, 18(2), 158-176. Retrieved from http://dx.doi.org/10.1521/scpq.18.2.158.21860
Shatto, B. & Erwin, K. (2017). Teaching millennials and Generation Z: Bridging the generational divide. Creative Nursing, 23(1), 24-28.
Stanulis, R., & Floden, R. E. (2009). Intensive Mentoring as a Way to Help Beginning Teachers Develop Balanced Instruction. Journal of Teacher Education, 60(2), 112–122. https://doi.org/10.1177/0022487108330553
Tapscott, D. (2009). Growing up digital: How the Net Generation is changing our world. New York: McGraw Hill.
Teke, A., Sahin, I., & Sadi, O. (2016). The investigation of the relations between students‘ attitudes toward the nature of technology and problematic internet usage. The Eurasia Proceedings of Educational & Social Sciences, 5, 289-293.
Valentine, J. (2012a). IPI component basic workshop description. Unpublished manuscript. Valentine, J. (2012b). Strategies for IPI implementation. Unpublished manuscript.
Valentine, J. (2012c). Workshop handouts. Unpublished manuscript.
Valentine, J. (2013). Frequently requested facts and figures about student engagement. Unpublished manuscript. Valentine, J. (2015a). IPI-T Component Workshop Description. Unpublished manuscript.
Valentine, J. (2015b). IPI frequently asked questions. Unpublished manuscript. Valentine, J. (2017). The IPI Process-Basic perspectives. Unpublished manuscript.
Valentine, J. (n.d.). Faculty collaborative study. Retrieved from: https://ipistudentengagement.com/ipi-process-in-depth/faculty-collaborative-study
Vongkulluksn, V. W., Xie, K., & Bowman, M. (2018). The role of value on teachers‘ internalization of external barriers and externalization of personal beliefs for classroom technology integration. Computers and Education, 118, 70-81, doi: 10.1016/j.compedu.2017.11.009
Yurt, E., Kurnaz, A., & Sahin, I. (2014). Analysis of education faculty students‘ attitudes towards e-learning according to different variables. International Journal of Social, Management, Economics and Business Engineering, 8(6), 1673-1675.
Wallace, T., Reschly Anderson, A., Bartholomay, T., & Hupp, S. (2002). An ecobehavioral examination of high school classrooms that include students with disabilities. Exceptional Children, 68(3), 345-359.http://dx.doi.org/10.1177/001440290206800304
digital natives are more technology savvy than their teachers. Educational Technology, Research and Development, 62(6), 637-662. doi:10.1007/s11423-014-9355-4
Yahya, D.O., & Adebola, S.T. (2019). Availability of activities and appropriateness of graphical illustrations in recommended economics textbooks for senior secondary school students. International Journal on Social and Education Sciences, 1(2), 73-77.
Zhao, Y., Pugh, K., Sheldon, S., & Byers, J. L. (2002). Conditions for classroom technology innovations.
Teachers College Record, 104(3), 482-515.
Author Information
Mekca Wallace-Spurgin Nova Southeastern University
3301 College Avenue, Fort Lauderdale, Florida 33314-7796 USA