International Journal of Research in Engineering and Applied Sciences(IJREAS) Available online at http://euroasiapub.org/journals.php
Vol. 7 Issue 8, August-2017, pp. 70~89
ISSN (O): 2249-3905, ISSN(P): 2349-6525 | Impact Factor: 7.196
[
International Journal of Research in Engineering & Applied Sciences Email:- editorijrim@gmail.com, http://www.euroasiapub.org
An open access scholarly, online, peer-reviewed, interdisciplinary, monthly, and fully refereed journals
70
Stability of the bridge under vehicle induced vibration
Avinash Gavel1,
Asst. Professor, Dept. of Mechanical Engineering CSIT Durg, Chhattisgarh
Vaibhav Sharma2,
Student, BE Mechanical, CSIT Durg, Durg, Chhattisgarh, India
Prakash Pandey3,
Student, BE Mechanical, CSIT Durg, Durg, Chhattisgarh, India
Vivek Baghel4
Student, BE Mechanical, CSIT Durg, Durg, Chhattisgarh, India
Manish Kumar Sinha5, Student, BE Mechanical, CSIT Durg,
Durg, Chhattisgarh, India
Abstract
A bridge is basically a load carrying structure, roadway or path way which connects the two or more points in the manner to reach the location with the minimum loss of money, energy and time. The bridges are often established from the ground level of two co-ordinates between obstacles. The bridges are often designed in the manner that they can sustain and maintain their superstructure under the influence of dead and live loads with the minimum disturbance of their inertia. The bridges are generally placed on the surface of load carrying columns in the form of simply supported beams. The integration of which generates a continuous system which is the bridge super structure. So that natural frequency (time function) and response function (space function) can be generated and programmed in MATLAB.
International Journal of Research in Engineering and Applied Sciences(IJREAS) Vol. 7 Issue 8, August-2017
ISSN (O): 2249-3905, ISSN(P): 2349-6525 | Impact Factor: 7.196
International Journal of Research in Engineering & Applied Sciences Email:- editorijrim@gmail.com, http://www.euroasiapub.org
An open access scholarly, online, peer-reviewed, interdisciplinary, monthly, and fully refereed journals
71
INTRODUCTION
The first mathematical expressions were developed in the late 90’s century carrying out many experiments by C. E. Inglis for Railroads considering simply supported segments of a continuous system and S. Timoshenko for bridge super structures. In both of the cases the bridge is the integrated system of simply supported segments containing a lumped vehicle mass. The experiments of 1950’s were also laboratory dependent until the 1970’s. At that time computer was available for designing and simulating the bridge parameters. Dynamic analysis was firstly carried out in 1953 by K. H. Kinnier. After the year 1980’s standard composite materials like Portland cement, ceramics and RCC were being used extensively in place of steel bridges which were providing flexibility with complexity in material property and geometry. The advancement of new mathematical expression using Laplace and Newmark beta function provides accurate results of damped frequency and damping co-efficient for either side of the vehicle at each point of the bridge using Delta function.
Transport vehicle and bridge both reflects complex models in the real environment. At the point of interaction the damping systems and wheels diminish the value of vibration of meeting parts up to a very high limit. The bridge itself behaves like a damper. During the analysis of vibration the vehicle is considered as a lumped mass.
Fig (a):- Load amplitude curve of cosine function in domain (-π, π)
International Journal of Research in Engineering and Applied Sciences(IJREAS) Vol. 7 Issue 8, August-2017
ISSN (O): 2249-3905, ISSN(P): 2349-6525 | Impact Factor: 7.196
International Journal of Research in Engineering & Applied Sciences Email:- editorijrim@gmail.com, http://www.euroasiapub.org
An open access scholarly, online, peer-reviewed, interdisciplinary, monthly, and fully refereed journals
72
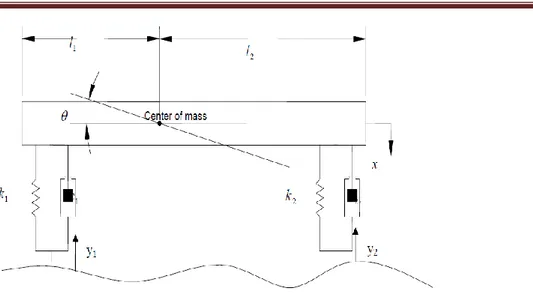
Fig (b):- Vehicle interaction with surface [Wang 1992]Fig.(b) represents the elastic behavior of an eccentric vehicle which has following parameters. (i) Angle of pitch (ϴ).
(ii) Eccentricity of wheels from the center of mass (l1 and l2 respectively).
(iii) Deflection of center of mass (x).
(iv) Lift of the wheel (y1 and y2) i.e. displacement of wheels in vertical direction.
(v) Equivalent stiffness (k1 and k2) and equivalent damping (c1 and c2 ) respectively for
the vehicle front and rear components.
Fig 3.2:- Amplitude ratio for a two dimensional periodic cosine load.
L
oa
d
fr
ac
ti
International Journal of Research in Engineering and Applied Sciences(IJREAS) Vol. 7 Issue 8, August-2017
ISSN (O): 2249-3905, ISSN(P): 2349-6525 | Impact Factor: 7.196
International Journal of Research in Engineering & Applied Sciences Email:- editorijrim@gmail.com, http://www.euroasiapub.org
An open access scholarly, online, peer-reviewed, interdisciplinary, monthly, and fully refereed journals
73
Figure 3.2 represents two orthogonal curvilinear co-ordinates representing maximumamplitude of vibration at the center of bridge irrespective to the position of load for the first shape mode of vibration.
Overview of parameters:- A complex vehicle structure is made up of robust assemblies and meeting parts having complex moving structures. The analysis commonly used for design considerations are:-
Single axle 2D model
Double axle 2D model with four degree of freedom.
3D models with seven degree of freedom.
In this, 2D model of vehicle has been used having properties stiffness, damping and mass matrices with the interactional behavior of bridge material. Mainly the lower order natural frequency is introduced which is the basic mode of vibration. The bridge is assumed to be made up of the simply supported segments of homogenous material. Mode superposition method is used to reduce the degree of freedom. The dynamic analysis is done with superposition of load along with the Euler Bernoulli beam theory .
Fig 3.3:- Bridge vehicle interaction [Susan et al. 1985] Here, w(x, t) is the uniform shape function of load density. L is the length of the bridge.
V is the velocity of the vehicle a is the position of rear wheels. Other terms have their usual meanings.
International Journal of Research in Engineering and Applied Sciences(IJREAS) Vol. 7 Issue 8, August-2017
ISSN (O): 2249-3905, ISSN(P): 2349-6525 | Impact Factor: 7.196
International Journal of Research in Engineering & Applied Sciences Email:- editorijrim@gmail.com, http://www.euroasiapub.org
An open access scholarly, online, peer-reviewed, interdisciplinary, monthly, and fully refereed journals
74
bridge and vehicle changes with time to time. The hysteresis is the accumulation of load with timeduration and speed of the vehicle increasing successively day by day.
METHODOLOGY
Assumptions made at different stages of superposition:
The bridge and the car both have to tackle the environmental parameters such as atmospheric pressure, speed of vehicle and density variation of air due to temperature and seasons etc. All the parameters could not be taken for the consideration. At the time of interaction of bridge and vehicle only material properties and surface properties are involved in the calculation of bridge vibration. At that instant positions of the rest parts of the vehicle other than the contact with bridge are considered as elements of lumped body. Assumptions made at different stage of superposition are as under: -
The vehicle is assumed to be a rigid body during the calculation of vibration of bridge so that only bridge variables are considered as variables at that time.
The mass of bridge is linear function of mass density for uniform propagation of amplitude function.
There is no transverse motion in bridge other than longitudinal direction.
The property of bridge (i.e. flexural rigidity and linear mass density) remains constant during the motion of vehicle to evaluate length-time and length-density propagation.
The property of vibration after impulsive loading will be treated as a cosine function over the 4.2m length of the vehicle.
Purpose of taking cosine function
The simplification of the bridge model, using the cosine function (including general bridge parameters) with the basic vibration parameters is the easiest way of calculating amplitude of bridge vibration. It is impossible to analyze all the bridge parameters with a single bridge model because of different types and manners of loadings. Cosine function due to its following properties: -
Continuous function of space and time variables.
Differentiability of the function at each position of vehicle.
Single valued at each point of vibration.
The maximum and minimum magnitude is unity thorough out the length.
Whatever the domain (-∞, +∞), the range varies in the region[-1,1].
The fundamental range is from (-π, π) in which at the point of interaction, the cosine function has highest load as well as deflection value.
International Journal of Research in Engineering and Applied Sciences(IJREAS) Vol. 7 Issue 8, August-2017
ISSN (O): 2249-3905, ISSN(P): 2349-6525 | Impact Factor: 7.196
International Journal of Research in Engineering & Applied Sciences Email:- editorijrim@gmail.com, http://www.euroasiapub.org
An open access scholarly, online, peer-reviewed, interdisciplinary, monthly, and fully refereed journals
75
Steps of approach:- (i) Selection of standard elastic bridge material (i.e. RCC).
(ii) Function of bridge vibration should be continuous within the length and invariant to the surrounding. Wave equation is suitable under impulse load of vehicle with point contact of bridge and wheel for the bridge. Euler Bernoulli beam theory relates the material properties (EI and ρ) with the amplitude functions of front and rear wheels in the terms of time and position.
(iii) Application of impulse loading under finite length span of bridge provides shape function of amplitude and time function of frequency for different modes. Laplace transform of integral provides an exact solution of space- time functions in orthogonal (independent) co-ordinates.
(iv) Position of the wheel is the time-velocity product, on the bridge. After crossing the bridge deflection of vehicle and bridge are independent to each-other.
(v) Effective deflection of wheel is the function of position on the bridge and eccentric load due to own weight within the bridge.
(vi) The shape function of wheels are valid from the entry of front wheel on the bridge i.e. (a/v), to the exit of rear wheel (l+a)/v from the bridge.
(vii) Analysis of variation of natural frequency with density of bridge material and length using MATLAB.
(viii) After the analysis of bridge, the eccentric load on the vehicle is also required to be quantified. This is carried out by calculating frequency of the standard vehicle using complex function and MATLAB. The input parameters are distance of wheel positions from center of gravity of vehicle, stiffness and damping co-efficient of front and rear wheels.
(ix) The damping ratio is calculated with the help of complex roots of natural frequency of four wheels.
(x) These complex roots also provide the resultant of mode shape (plane) and its propagation from wave direction. Then transfer function is generated mathematically including all the parameters. Laplace function provides exact solution for load transfer ratio with Cremer rule.
Transverse static vibration analysis:- There are two ways of analyzing vehicle vibration (i) Stationery bridge and moving vehicle for analyzing vehicle behavior.
(ii) Moving bridge carrying lumped vehicle mass.
International Journal of Research in Engineering and Applied Sciences(IJREAS) Vol. 7 Issue 8, August-2017
ISSN (O): 2249-3905, ISSN(P): 2349-6525 | Impact Factor: 7.196
International Journal of Research in Engineering & Applied Sciences Email:- editorijrim@gmail.com, http://www.euroasiapub.org
An open access scholarly, online, peer-reviewed, interdisciplinary, monthly, and fully refereed journals
76
deflection of bridge is 1.5 mm. then natural frequency can be calculated without considering thegravity load as following: - .
If the mass of the bridge is not considered in case of transverse deflection curve the static natural
frequency will be:- k = 𝑙𝑜𝑎𝑑
𝑑𝑒𝑓𝑙𝑒𝑐𝑡𝑖𝑜𝑛=
10000
0.0015= 6.67𝑥10
5𝑁/𝑚
and natural frequency 𝜔 = √𝑘
𝑚= √
6.67𝑥105
10000 =8.17 rad/sec.
In this analysis the length and material properties of the bridge are not considered. Complex generalized function of load intensity including bridge parameters can be expressed in the terms of fourth order differential equation. The mathematical expression of Euler- Bernoulli beam theory consists of 4th order and having the form as shown in the equation (4.1) :-
𝐸𝐼𝜕4𝑦
𝜕𝑥4 + 𝜌
𝜕2𝑦
𝜕𝑡2+ 𝑣
𝜕𝑦
𝜕𝑡= 𝐹(𝑥, 𝑡)𝛿(𝑥 − v𝑡) … (4.1)
where, EI = Flexural rigidity
𝜌 = Mass per unit run 𝑣 = Damping coefficient
F(x, t) = Coupling force on beam
y = Contact point deflection of bridge beam
δ = Direct function for interval of span [a, b] out region value is zero Orthogonal general vector of (x, t) can be expressed by using the form:- y = ø(x)ƞ(t)
International Journal of Research in Engineering and Applied Sciences(IJREAS) Vol. 7 Issue 8, August-2017
ISSN (O): 2249-3905, ISSN(P): 2349-6525 | Impact Factor: 7.196
International Journal of Research in Engineering & Applied Sciences Email:- editorijrim@gmail.com, http://www.euroasiapub.org
An open access scholarly, online, peer-reviewed, interdisciplinary, monthly, and fully refereed journals
77
y(x, t) = ∑ øi(x)ƞi(t)∞1 … (4.2)
for the ith mode of vibration
Mathematical modeling of bridge-
This can be done by considering the bridge to be simply supported beam and obtaining the trial differential equation of motion without damper as shown in equation (4.3)
𝐸𝐼𝜕4𝑦
𝜕𝑥4 + 𝜌
𝜕2𝑦
𝜕𝑡2 = 0 … (4.3)
Taking, 𝐸𝐼
𝜌 = 𝑐
2 (constant)
Since, y is function of x and t. Mathematically, y=f(x,t) Hence,
y = Y(x)T(t) … (4.4)
The equation (4.3) can be solved by using separation of variable method i.e., done by using equation (4.4).
Describing the equation (4.3) in two parts and then obtaining the corresponding solution Solution of part-I
𝑐2 𝜕𝜕𝑥4𝑦4= 𝑐2 𝑑𝑑𝑥4𝑌4 × 𝑇(𝑡) = 𝑐2 𝑑𝑑𝑥44 𝑌 × 𝑌(𝑥)𝑦 … (4.5)
Similarly for part-II, equation (4.4) can be expressed as:-
𝜕2𝑦
𝜕𝑡2 =
𝑑2𝑇(𝑡)
𝑑𝑡2 ×
𝑌(𝑥) … (4.6)
Comparing (4.5) and (4.6) will give
𝑐2 𝑑4𝑌(𝑥)
𝑑𝑥4 ×
𝑦
𝑌(𝑥)= −
𝑑2𝑇(𝑡)
𝑑𝑡2 ×
𝑦
𝑇(𝑡)= 𝜔
2 = 𝑑(𝑙𝑒𝑡 ) … (4.7)
Left hand side of equation (4.7) will give
(𝐷4− 𝛽4) Y(x) = 0 (where d/c2 =𝛽4 is a constant)
(𝐷2 − 𝜔2) T (t) = 0
The above equations will lead to a C.F. (Complimentary function) of the form:- Y(x) = c1𝑒𝛽𝑥+ c2𝑒−𝛽𝑥+ c3𝑒𝑖𝛽𝑥 + c4𝑒−𝑖𝛽𝑥 … (4.8)
Using the identities 𝑒𝑖𝑛𝜃 = 𝑐𝑜𝑠𝜃 + 𝑖𝑠𝑖𝑛𝜃 and 𝑒𝑛𝜃= 𝑐𝑜𝑠ℎ𝜃 + 𝑖𝑠𝑖𝑛ℎ𝜃 in the equation (4.8) we
can write the parameters of the trial solution as:-
𝑒𝑖𝛽𝑥= 𝐶𝑜𝑠𝛽𝑥 + 𝑖𝑠𝑖𝑛𝛽𝑥
𝑒−𝑖𝛽𝑥= 𝐶𝑜𝑠𝛽𝑥 − 𝑖𝑠𝑖𝑛𝛽𝑥
𝑒𝛽𝑥= 𝐶𝑜𝑠ℎ𝛽𝑥 + 𝑠𝑖𝑛ℎ𝛽𝑥
𝑒−𝛽𝑥= 𝐶𝑜𝑠ℎ𝛽𝑥 − 𝑠𝑖𝑛ℎ𝛽𝑥
International Journal of Research in Engineering and Applied Sciences(IJREAS) Vol. 7 Issue 8, August-2017
ISSN (O): 2249-3905, ISSN(P): 2349-6525 | Impact Factor: 7.196
International Journal of Research in Engineering & Applied Sciences Email:- editorijrim@gmail.com, http://www.euroasiapub.org
An open access scholarly, online, peer-reviewed, interdisciplinary, monthly, and fully refereed journals
78
Therefore equation (4.8) can be rewritten asY(x) = A₁sin𝛽x+A₂cosh𝛽x+A3sinℎ𝛽x+A4cos𝛽X … (4.9)
Differentiating two times equation (4.9) will give bending equation
Y’’(x) = 𝛽 2 (-A₁Sin𝛽x+A₂Cosℎ𝛽x+A3Sinℎ𝛽x-A4Cos𝛽x ) … (4.10)
T(t) = ACos𝜔t + BSin𝜔t
𝛽 = 𝜔2√𝜌𝐴𝐸𝐼 = (𝛽𝐿)2√ 𝐸𝐼
𝜌𝐴𝐿4 … (4.11)
Value of 𝛽𝐿 = (1,2,3 … . . ∞) × 𝜋
In summery;
Sin𝛽𝑙 = 0 is frequency equation
and
Yn = Cn Sin𝛽𝑥 is mode shape function … (4.12)
On solving the fourth order Euler – Bernoulli beam equation in the term of Yn(x) of equation (4.9)
and (4.10) four boundary conditions are required in case of simply supported beams:-
(a) At the initial position of simply supported bridge (at x = 0), cos0 = cosh0 = 1 and sin0 = sinh0 = 0 putting the values
A2 + A4 = 0
A2- A4 = 0
It is only possible in case of each one is individually zero. i.e. A1 = A3 = 0
(b) Deflection and bending moment at end support (x=l) is zero i.e.:- A1Sinh𝛽l + A3Sin𝛽l = 0 & A1𝛽2Sinh𝛽l - A3𝛽2Sin𝛽l = 0
Squaring part-I equation will give:-
A1A3Sinh𝛽𝑙Sin𝛽l= 0 ;
For non – zero values one term should have a length; So
Sin𝛽1 = SiniЛ
𝛽 = 𝑖Л
𝑙
øi = AiSin𝑖𝜋𝑥
𝑙 …(4.13)
For mass function of amplitude over length the function of MI about axis:-
∫ 𝜌0𝑙 ∅2𝑑𝑥 = 1 or 𝜌 ∫0𝑙1−𝑐𝑜𝑠2𝑖𝜋𝑥/𝑙2 𝐴2𝑑𝑥 = 1 or A=√𝜌𝑙2 for the first mode.
putting the value of A for ‘ith’ mode in equation (4.13) gives:-
Ai = √ (2⁄ 𝜌𝑙) = Ax mode constant
International Journal of Research in Engineering and Applied Sciences(IJREAS) Vol. 7 Issue 8, August-2017
ISSN (O): 2249-3905, ISSN(P): 2349-6525 | Impact Factor: 7.196
International Journal of Research in Engineering & Applied Sciences Email:- editorijrim@gmail.com, http://www.euroasiapub.org
An open access scholarly, online, peer-reviewed, interdisciplinary, monthly, and fully refereed journals
79
Øi = Ai Sin𝜋𝑥𝑙
For first mode, the value i=1 in above equation:-
Ø =√ (2⁄ 𝜌𝑙) Sin𝜋𝑥
𝑙 … (4.14)
𝐸𝐼𝜕4𝑦
𝜕𝑥4+ 𝜌
𝜕2𝑦
𝜕𝑡2+ 𝜇
𝜕𝑦
𝜕𝑡 = − ∑ 𝐹𝑖 (𝑥𝑖, 𝑡
2
𝑖=1 )𝛿𝑖(𝑥𝑖 − 𝑣𝑡) 𝑖𝑠 𝑎 𝑑𝑒𝑙𝑡𝑎 𝑓𝑢𝑛𝑐𝑡𝑖𝑜𝑛 ℎ𝑎𝑣𝑖𝑛𝑔 𝑠𝑜𝑙𝑢𝑡𝑖𝑜𝑛
The mode equation will be T’’ + 2 𝜉𝜔̼T’ +𝜔̼2𝑇 = -F
1Ø1δ1= -F2Ø2δ2
The two identical shape functions of front and rear wheels are:-
Ø1= ∅(𝑣𝑡) = √2
𝜌𝑙𝑠𝑖𝑛
𝑛𝜋𝑣𝑡
𝑙 (for the front wheel)
Comparison of standard frequency with the frequency obtained from analysis
The vehicle and bridge parameters used in paper of Susan and Kou (1985) are according to American Association of State Highway and Transport Officials (AASHTO) for the heavy transport vehicle. The author used Strudel approximation software to evaluate frequency of vibration in cycles per seconds. The unit of frequency remains same in every measurement system. So comparison of result is done using same material specification in SI unit.
S. No. Parameters associated to the bridge
Symbol Standard value (given unit)
SI unit
1 Length of bridge l 50 ft. 15.24 m
2 Modulus of elasticity E 3000 Ksi 2.068x10¹⁰N/m2
3 Material density Q 500 lb/ft3 8009.225kg/m3
4 Moment of inertia I 1082620.1 inch4 0.45062 m4
5 Flexural rigidity EI 3.427x10⁹ Ksi-inch4 93188216 N-m2
6 Area of cross section A 1482.4 inch2 0.95638518 m2
7 Linear mass density ρ 741200 lb/inch 7660 Kg/m
8 Mass of the bridge M 11295888 lb 116736.95 Kg
For standard 15.24 m (Susan and Kou) bridge The result obtained by STRUDAL software is Frequency Fn = 2.14094 cycles/sec
Period of vibration of bridge = 0.46708455 sec
By manual Calculation for impulsive loading taking exact integral formula
𝜔 = 𝑛2 𝜋2√𝜌𝑙𝐸𝐼5
Putting the values for fundamental mode of frequency for n=1 in equation (5.1) :- l = 15.24 m ;
ρ = 7660 kg/m
International Journal of Research in Engineering and Applied Sciences(IJREAS) Vol. 7 Issue 8, August-2017
ISSN (O): 2249-3905, ISSN(P): 2349-6525 | Impact Factor: 7.196
International Journal of Research in Engineering & Applied Sciences Email:- editorijrim@gmail.com, http://www.euroasiapub.org
An open access scholarly, online, peer-reviewed, interdisciplinary, monthly, and fully refereed journals
80
Hence frequency can be calculated by the relationship between frequency and angular velocityf = 𝜔
2𝜋
Fn = 1.91 cps
The error between the standard result and result obtained can be calculated as :-
Percentage error = 𝑠𝑡𝑎𝑛𝑑𝑎𝑟𝑑 𝑟𝑒𝑠𝑢𝑙𝑡−𝑟𝑒𝑠𝑢𝑙𝑡 𝑜𝑏𝑡𝑎𝑖𝑛𝑒𝑑
𝑠𝑡𝑎𝑛𝑑𝑎𝑟𝑑 𝑟𝑒𝑠𝑢𝑙𝑡 𝑥 100%
Error in frequency = 2.14−1.91
2.14 𝑥 100% = 10.78%
Time period error = 10.78%
The difference in result obtained is 10.78%
The result obtained from the integral method matches with the result obtained from Strudel software which is modeling, research, analysis and design software used by Susan and Kou (1985). Strudel is used for concrete, steel and structural design. It gives 64 bit approximate solution to the problem of computational database, frame and finite element problems. It can solve statics, dynamics, linear and non-linear problems for structure.
The result is validated successfully
Frequency variation table for standard bridge:-
Density /
mode of
vibration
1 0.5 0.25 0.125 0.0625
1 14.26 20.17 28.5 40.43 57.05
2 57 80.7 114.11 161.4 228.22
3 128.37 181.55 256.75 363.1 513.5
4 229 322.75 456.44 645.5 912.9
5 356.6 40.43 1 713.2 1008 1426.4
6 513.5 726 1027 1452 2054
7 698.93 988.5 1397 1976 2759
International Journal of Research in Engineering and Applied Sciences(IJREAS) Vol. 7 Issue 8, August-2017
ISSN (O): 2249-3905, ISSN(P): 2349-6525 | Impact Factor: 7.196
International Journal of Research in Engineering & Applied Sciences Email:- editorijrim@gmail.com, http://www.euroasiapub.org
An open access scholarly, online, peer-reviewed, interdisciplinary, monthly, and fully refereed journals
81
So the weight of the bridge should be higher or length should be less in order to compensate theamplitude vibration.
RESULTS AND DISCUSSIONS 6.1 Natural frequency
Graph between the natural frequency and the number of modes is plotted, it is shown in Figure (6.1). It represents; when the bridge of finite length vibrates under the loading condition the frequency of vibration increases with the increase in shape mode. Shape modes are the number of waves produced within the finite bridge length. Larger value of shape modes diminishes the amplitude of vibration. So the frequency of vibration is very high due to lower value of amplitude. Similarly if the bridge is moving in single mode then the value of amplitude will be high. So the damping effect should be high, so that instability of the vehicle due to vibration could be diminished up to optimum value. After the seventh mode of vibration the amplitude is diminished to a negligible value.
Figure 6.1:- Frequency /mode distribution graph for material
6.2 Span of bridge
Graph between the length of the bridge and the frequency of vibration is drawn in the figure (6.2). It represents that the small length bridges have lower value of amplitude of vibration. If we increase the length of the bridge from the 1m length to 16m length the value of the frequency of vibration reduces rapidly till the 8m length after this length the value of natural frequency is
Modes of vibration
Na
tura
l fr
eque
nc
y of vibr
ati
on of
International Journal of Research in Engineering and Applied Sciences(IJREAS) Vol. 7 Issue 8, August-2017
ISSN (O): 2249-3905, ISSN(P): 2349-6525 | Impact Factor: 7.196
International Journal of Research in Engineering & Applied Sciences Email:- editorijrim@gmail.com, http://www.euroasiapub.org
An open access scholarly, online, peer-reviewed, interdisciplinary, monthly, and fully refereed journals
82
approximately constant. So the length of the bridge should be optimum to compensate bothaspects amplitude and frequency of vibration. The graph can be prepared using table given below
Table 6.2:- Span/frequency table of bridge for fundamental
mode:-Serial number Length of bridge (in meter) Natural frequency
1. 16 1.070
2. 14 1.500
3. 12 2.211
4. 10 3.490
5. 8 6.090
6. 6 12.500
Figure 6.2:- span /frequency curve for bridge material
The span frequency curve shows that the length curve is linear function, inversely proportional to the natural frequency of the bridge. Long bridges have lower frequency for the same load because they have higher amplitude of vibration. After seven modes the vibration amplitude become approximately nil because the amplitude of vibration reduces with the increase in segments within a bridge slabe.[Susan and Kou 1985] Shape mode of oscillation directly is affected by speed of heavy vehicle. [Wang Jiejun et. al. 2005]
For the effective length of 16 m and varying the velocity in Km/hr. by Manual calculation represented in table 5.1 and using MATLAB software:-
F1(x) = √2
𝜌𝑙𝑠𝑖𝑛 (
𝑛𝜋𝑥
𝑙 ) ... (6.1)
For front wheel components.
Length of the bridge in meters
Fre
qu
enc
y of vib
ra
ti
on in ra
International Journal of Research in Engineering and Applied Sciences(IJREAS) Vol. 7 Issue 8, August-2017
ISSN (O): 2249-3905, ISSN(P): 2349-6525 | Impact Factor: 7.196
International Journal of Research in Engineering & Applied Sciences Email:- editorijrim@gmail.com, http://www.euroasiapub.org
An open access scholarly, online, peer-reviewed, interdisciplinary, monthly, and fully refereed journals
83
F2(x) = √2𝜌𝑙𝑠𝑖𝑛 (
𝑛𝜋(𝑥−𝑎)
𝑙 ) …. (6.2)
For the rear wheel components.
Here the position is the function of velocity of vehicle and instantaneous value of time. Using MATLAB program for standard length of 16 m for different velocity values
Velocity – displacement graph in the terms of amplitudes of each meters A2 (0, 0.0031, 0.0034, 0.007, -0.0036;-0.0014, 0.0021, 0.0037, -0.0014, 0.0036, 0.0007, 0.0034, 0.0031, 0.000)
Length amplitude graph For V = 30m/s.
The graph drawn between the rear wheel amplitude of vibration and the length of the bridge represents that for 16m bridge and moving vehicle of 30 km/hr. the fluctuation in amplitude varies symmetrically with the length of the bridge. It is from downward 2.7mm to the upward 0.5 mm because the front wheel has applied the compressive load on the bridge surface. The effect of the front wheel is dominant at the first half of bridge.
6.3 Variation of amplitude with respect to length of bridge
Fig 6.3:- Rear wheel vs. Amplitude (A2/length)
The graph 6.3 drawn between the amplitude of front wheel vibration and the contact period for the speed of 30m/s is shown in the figure 6.4. It represents a symmetric curve of high rear
Amplitude of vibration of rear wheel
L
en
gth
o
f the
brid
ge
in
m
International Journal of Research in Engineering and Applied Sciences(IJREAS) Vol. 7 Issue 8, August-2017
ISSN (O): 2249-3905, ISSN(P): 2349-6525 | Impact Factor: 7.196
International Journal of Research in Engineering & Applied Sciences Email:- editorijrim@gmail.com, http://www.euroasiapub.org
An open access scholarly, online, peer-reviewed, interdisciplinary, monthly, and fully refereed journals
84
amplitude because effect of front wheel starts at the entry of car on the bridge and rear wheelcomes late on the bridge for consideration. The point of symmetry is midpoint of the bridge. The vehicle produces a completely reversed vibration to the bridge which increases the chances of failure of the bridge. So the driving speed of the vehicle should be as low as possible to avoid the chances of failure of bridge material.
6.4 Fluctuation at Front wheel position with respect to time
Fig 6.4:- Front wheel amplitude variation curve (A1/t)
At the vehicle speed of 30m/s on 16 m span of bridge, the combined amplitude of vibration will be the algebraic sum of two amplitude functions. The serpentine graph of 16 finite points of each meter length varies with the amplitude of 3.8 mm at either side of equilibrium. In the first half, the front wheel vibration is dominant and then rear wheel amplitude of vibration is dominant. The effective length of the bridge includes the vehicle length also. In this graph two modes are presents due to front and rear wheels. The resultant vibration is represented at sixteen finite points of the bridge with respect to time.
Amplitude of fluctuation of the front wheel
T
im
e spa
n of
crossing
in
se
International Journal of Research in Engineering and Applied Sciences(IJREAS) Vol. 7 Issue 8, August-2017
ISSN (O): 2249-3905, ISSN(P): 2349-6525 | Impact Factor: 7.196
International Journal of Research in Engineering & Applied Sciences Email:- editorijrim@gmail.com, http://www.euroasiapub.org
An open access scholarly, online, peer-reviewed, interdisciplinary, monthly, and fully refereed journals
85
6.5 Combined amplitude curve with respect to time
Fig 6.5:- Combined amplitude duration curve throughout the length (A1+A2)/t
Figure 6.5 represents the fluctuation of amplitude of bridge in meters at the different time intervals. The motion of the bridge is due to unbalanced load of two set of wheels. The bridge fluctuation is the algebraic sum to two amplitude functions. They are time dependent functions of position x (i.e., a=v.t). The fluctuation at the 16 time interval of each meter position is represented in which maximum fluctuation occurs at every 3 seconds at the speed of 108 Kph. or 30m/s. After the sixteen time intervals vehicle crosses the bridge. The amplitude functions of the wheel are sinusoidal. So the addition can be constructive at some points and destructive at the other point depending upon the distance from Centre of gravity. The algebraic sum represents the fluctuation of vehicle (Centre of gravity) at different times. After crossing of vehicle fluctuation of bridge occurs but it is negligible due to effect of successive damping of material of bridge.
Combined amplitude
T
im
e int
erva
ls i
n se
International Journal of Research in Engineering and Applied Sciences(IJREAS) Vol. 7 Issue 8, August-2017
ISSN (O): 2249-3905, ISSN(P): 2349-6525 | Impact Factor: 7.196
International Journal of Research in Engineering & Applied Sciences Email:- editorijrim@gmail.com, http://www.euroasiapub.org
An open access scholarly, online, peer-reviewed, interdisciplinary, monthly, and fully refereed journals
86
6.6 Density of material vs. frequency curve:-
n
Fig. 6.6:- Density of the material / Frequency curve
Figure 6.6 shows the graph between the material density and frequency of vibration. If the density of the material is reduced in geometric progression successively, then the frequency of vibration increases by the polynomial of square of geometric coefficient. If the density is reduced to half of the initial value then frequency will increase square root of two times as shown in above figure. m = 15090;
J = 53871; k1 = 46741;
k2=72300;
c1= 588.23;
c2=588.23;
l1=2.97;
l2=1.18;
a = [m c1+c2 k1+k2];
b = [J c2*l2^2+c1*l1^2 k2*l2^2+k1*l1^2];
C = conv(a,b)
d = [c2*l2-c1*l1 k2*l2-k1*l1];
e = conv(d,d)
f= 1.0e+009*[0.005 0.0345 0.4035 1.1700 5.8500] - [0. 0. 2250000 45000000 225000000] r = roots (f)
Density fraction of bridge material
Fre
qu
enc
y of vib
ra
ti
on in ra
International Journal of Research in Engineering and Applied Sciences(IJREAS) Vol. 7 Issue 8, August-2017
ISSN (O): 2249-3905, ISSN(P): 2349-6525 | Impact Factor: 7.196
International Journal of Research in Engineering & Applied Sciences Email:- editorijrim@gmail.com, http://www.euroasiapub.org
An open access scholarly, online, peer-reviewed, interdisciplinary, monthly, and fully refereed journals
87
The results of this editor program isC = 1.0e+010 *[0.0813 0.0154 1.4161 0.1319 6.1064] e = 1.0e+009 *[ 0.0011 0.1127 2.8630]
f = 1.0e+010 *[ 0.0050 0.0345 0.4033 1.1655 5.8275] root(s)=
-1.9737 + 5.9648i
-1.9737 -
5.9648i … (6.7)
-1.4763 + 5.2293i
-1.4763 -
5.2293i … (6.8)
The solution of above damped equation produced indicates damped frequencies of vibration for vehicle. These four values are conjugates of two same magnitudes in complex metric 2D plane:-
r₁=√𝑎2+ 𝑏2=√1.97372+ 5.96482=6.2828rad/sec
r₂= √1.47632+ 5.2292=5.43 rad/sec
in the form of damped natural frequencies the real values indicates the rate of decay and the second or imaginary part produces the natural frequencies with the help of damped system. Damped frequencies are:-
𝞈d₁=√1 − 𝜉2𝞈n = 5.9648rad/sec
or 𝜉₁ = √1 − (𝜔𝑑
𝜔𝑛)
2
=√1 − (5.9648
6..2828)
2
=0.314 …. (6.9)
and 𝜉₂ = √1 − (𝜔𝑑
𝜔𝑛)
2
= √1 − (5.2293
5.43 )
2
=0.26956…(6.10)
First mode shape = 𝑋
𝑋1= [
−0.101
1 ]
Second mode shape = 𝑋
𝑋2= [
0.14
1 ]
CONCLUSIONS
Based on the research work carried out following conclusions can be made:-
7.1 For the bridge
(i) The natural frequency of the bridge using standard RCC having length of 16 meters and linear weight variation is found to be function of 2.5th order of its length. Its fundamental
International Journal of Research in Engineering and Applied Sciences(IJREAS) Vol. 7 Issue 8, August-2017
ISSN (O): 2249-3905, ISSN(P): 2349-6525 | Impact Factor: 7.196
International Journal of Research in Engineering & Applied Sciences Email:- editorijrim@gmail.com, http://www.euroasiapub.org
An open access scholarly, online, peer-reviewed, interdisciplinary, monthly, and fully refereed journals
88
(ii) The amplitude function of vibration with respect to length is symmetric about the bothends and is maximum at the mid span i.e., 3.7 mm for 40 kph velocity. It represents whatever the position (v.t) is the maximum deflections occurs at the centre of bridge.
(iii) Front wheel amplitude at eight equal segments of bridge A1{0.0031,0.0034,0.0007,-0.0026,-0.0036,-00014,0.0021,0.0037 and symmetrically reduces to zero.}*10-3 m.
Irrespective to the loading point mid span always has maximum deflection due to highest bending moment and tendency of load towards the center.
7.2 For the vehicle
(i) Using convolution theorem and energy method in the program of MATLAB the damped frequency magnitude are 6.2828 rad/sec and 5.45rad/sec. for standard 4.2m effective length. (ii)The values of shape modes are [0.14<34.64°,-0.101<-30° for the damped natural frequency of [-1.4763-5.2293i,-1.9737-5.968i].
(iii)The value of damping ratios calculated according to real and imaginary parts are 0.31 and 0.27 which are closer to the standard value of 0.3.
7.3 Combined effect
(i) The amplitude of the vibration reduces with the density or length variation of the vehicle at constant flexural rigidity.
(ii) The vehicle should have the center of gravity as near as possible to the center of length for equal phase angle. It will provide geometrical balance during vibration.
REFERENCES
[1]Alejendro D Opjeda (2010) MATLAB implementation of an operational model analysis. Technique for vibration based structures MIT 2012
[2] Aswani M. Panicker and Alice Mathai (2013), “Free vibration analysis on FRP bridges’ American Journal of Engineering Research e-ISSN : 2320-0847 p-ISSN : 2320-0936 Volume-4 pp-47-5.
[3] Augusztinovicz F., rki F. Ma´, Gulya´ s K., Nagy, Fiala P., Gajda´ tsy P.(2006), “isolation requirement for steel road bridge”, Journal of Sound and Vibration 293 953.
[4] Barıs- Sevim a,b,n, Alemdar Bayraktar b, Ahmet Can Altunis -ik b, Sezer Atamt¨ urkt ¨ ur c, Fatma Birinci (2011), “Finite element model calibration effects on the earth quake response of masonry arch bridges”, Finite Elements in Analysis and Design 47 621–634.
[5] Concrete specification AASHTO (American Association of State Highway and Transportation Officials). [6] Errikssson Per and ”Vibration response of light weight padestrain bridge” Sweden 2013 Master’s Thesis 2013:51
[7] Higher engineering mathematics by Dr. B.S. Grewal -14062011
[8] Ghaffer and Ahmed (1982), “Suspension bridge vertical vibration ”. American Society of Civil Engineering V-108: EM6 p. 4
International Journal of Research in Engineering and Applied Sciences(IJREAS) Vol. 7 Issue 8, August-2017
ISSN (O): 2249-3905, ISSN(P): 2349-6525 | Impact Factor: 7.196
International Journal of Research in Engineering & Applied Sciences Email:- editorijrim@gmail.com, http://www.euroasiapub.org
An open access scholarly, online, peer-reviewed, interdisciplinary, monthly, and fully refereed journals
89
vehicles crossing a highway bridge”, Computers and Structures 89 2261–227247-455.
[10] Ivanovic´ S. Zˇ , Pavic A., Reynolds P. (2005) , “Vibration serviceability of footbridges under human-induced excitation: a literature review” Journal of Sound and Vibration 279 1–74.
[11] Jeffrey Kinlan (2012), “Structural Comparison of a Composite and Steel Truss Bridge” by An Engineering Research Project Submitted to the Graduate.
[12] Liu K., Reynders E., DeRoeck G., Lombaert G. (2009) , “Vibrations of steel–concrete composite beams with partially degraded connection and applications to damage detection”, Journal of Sound and Vibration 320 101–124.
[13] Luis Lorax “Stuructural design of bridge” (2008), ISSN 1103-4297, ISRN KTH/BKN/B—263 Structural Engineering.
[14] Lv1 Na and Liang Fan1 (2014), “Optimization of Quickly Assembled Steel-Concrete Composite Bridge Used in Temporary”, Modern Applied Science; Vol. 8, No. 4; 2014 ISSN 1913-1844 E-ISSN 1913-1852. [15] Michaltsos G.T., Sarantithou E., Sophionopolos D. S. (2005) , “vibration of simply supported open cross-section steel beams under moving loads” Journal of Sound and Vibration 280 479–494.
[16] Mistuhiro Yoshimuraa, Qingxiong Wub, Kazuo Takahashib, Shozo Nakamurab, Kazuyoshi Furukawa (2006), “Vibration analysis of sakai bridge”, Journal of Sound and Vibration 290 388–409.
[17] Paolo Clemente1, Mehmet ÇELEBI2, Giovanni Bongivanni1, Dario Rinaldis1]” (2004) Seismic Analysis of indiano Cable-stayed bridge”.13th World Conference on Earthquake Engineering Vancouver, B.C., Canada August 1-6 Paper No. 3296.
[18] Qin J.W. a, Law b,n S.S., Yang Q.S. a, Yang N. ,”Pedestrian–bridge dynamic interaction, including human participation”, Journal of Sound and Vibration 332 (2013) 1107–1124.
[19]Rainer, J. H. and Pernica (1979) ,“Dynamic testing of modern concrete bridge” Canadian Journal of Civil Engineering Vol.6
[20] Rajesh F. Kale1, Gore2 N.G., Salunke3 P.J. (2014) , “MATLAB optimization of bridge superstructure”, International Journal of Research Engineering and Technology EISSN-2319 -1163; PSSN:- 2321-7308. [21] Samali B., Li J., Crews K.I. (2007), “Load Rating of Impaired Bridges Using a Dynamic Method”, Electronic Journal of Structural Engineering Special Issue: Loading on Structures.
[22] Sauvik Banerjeez, Fabrizio Riccib, Ernesto Monacob, Ajit Malc (2009), “A wave propagation and vibration-based approach for damage identification in structural components”, Journal of Sound and
Vibration 322 167–183. [23] Sebastia´n Machadoa,b P., Vı´ctor Cortı´ H., Neza B. (2009), “Dynamic stability of thin-walled composite