A Systematic Analysis of Direct and Indirect Casualties Associated with Atlantic Basin Tropical Cyclones
By
Jessica Marie Suggs
Senior Honors Thesis Geography
University of North Carolina at Chapel Hill
February 27, 2015
Approved:
______________________ (Dr. Charles Konrad), Thesis Advisor
(Dr. John Florin), Reader
Table of Contents
Table of Contents 2
1. Introduction 3
1.1 Impact Types 4
1.2 TC Attributes 5
2. Data and Methodology 5
2.1 Study Area 6
2.2 Data Sources 6
2.3 Death Categories 8
2.4 Death Location 8
2.5 Storm Analysis 9
2.6 Storm Size 9
2.7 Storm Track 10
2.8 Storm Speed of Movement 10
2.9 True Shoreline 11
2.10 Intensity 11
2.11 Hurricane Katrina (2005) 11
3. Results and Discussion 12
3.1 Overview 12
3.2 Geographic Distribution of Deaths 13
3.3 Deaths per Storm 14
3.4 Distance from Shoreline 15
3.5 Distance from Track 16
3.6 Distance Left and Right of the Storm Track 17
Abstract
Major tropical cyclones (TCs) often produce tremendous property damage and significant
loss of life. As tropical cyclones track inland and dissipate, their impacts can be substantial.
This study provides a detailed view of the various factors and the resulting deaths using
data from the last 40 years of tropical cyclone history. It documents all reported TC related
deaths of 106 tropical cyclones from 1970 to 2011. A database of all-‐cause TC deaths
associated is created to understand the number of indirect and direct deaths and the
spatial distribution of the deaths relative to the shoreline and tropical cyclone track.
Various tropical cyclone attributes, including size, strength, and speed of movement are
related to the spatial pattern of deaths and their location relative to the cyclone track. Loss
of life occurs as far inland as 700 km from the shoreline and as far as 700 km from the center of the track. The spatial distribution of the deaths around a TC vary according to the type of impact that caused the death. Rain-related deaths tend to be equally distributed across the track and well inland from the shoreline, while wind-related deaths remain concentrated close to the track and close to the shoreline.
1. Introduction
Previous research (Rappaport 2000) has focused on “direct deaths”, which result
from factors directly connected with the TC, such as the high winds, tornados and storm
surge. Casualties that are not directly attributed the TC typically go unreported.
Hurricanes, however, as with other hazardous environmental events, can cause human
deaths by means other than direct contact with the event’s physical forces and can create
(Combs et al. 1996). These “indirect deaths” result from a range of causes before, during,
and after the TC event. Because the exact cause of an indirect death is not limited to
contact with storm-‐driven impacts, the list of possible causes of these deaths is endless
(McKinney et. al. 2010). For example, deaths occur while people are preparing for the
storm, such as falling off a rooftop, or from such events as being crushed by a tree during
cleanup, debris preventing timely emergency care, or carbon monoxide poisoning from
generators.
1.1 Impact Types
The majority of cyclone research has focused on economic losses and loss reduction
rather than casualties (Borden and Cutter 2008). In 1972 the American Meteorological
Society found that 90% of hurricane-‐related deaths were due to storm surge along the
coastline (AMS 1973, Rappaport 2000).
Storm surge alone does not cause all fatalities linked to tropical cyclones. Drowning
can occur from freshwater flooding associated with rainfall occurring hundreds of miles
inland (Rappaport 2000). For example, inland floods from Hurricane Floyd in 1999
claimed 50 lives in the United States (Rappaport 2000). In a more recent study Rappaport
found that rainfall induced freshwater floods accounted for about a quarter of the direct
deaths (2014) associated with TCs. The main impacts from tropical cyclones tend to
revolve around flooding, wind, and storm surge (Rappaport 2000).
TC impacts also produce indirect deaths, which were not addressed in Rappaport’s
original 2000 research and follow up 2014 study. Indirect deaths include heart attacks,
house fires, electrocution from downed power lines, and vehicle accidents on wet roads
wind, including deaths from fallen trees in post recovery efforts and electrocution from
downed power lines. Zane et. al. (2011) found that 64% of deaths from Hurricane Ike
(2008) resulted from injuries associated with carbon monoxide poisoning (18%),
drowning (11%) and other illnesses such as cardio vascular failure (16%). This research
suggests a strong need to systematically document the number and the nature of deaths
that are not normally attributed to a TC.
1.2 TC Attributes
The attributes of a TC, specifically its speed of movement, size, and strength play a
key role in the determining the number, the nature, and the geographic distribution of
deaths. Some studies focus on TC behavior post landfall (e.g. Kaplan and DeMaria 1995),
while others focus on the TC impacts along a specific coastline (Kruk et. al. 2010). Few
studies have examined the relationship between the aforementioned TC attributes and the
spatial distribution of deaths along the shoreline and from the center of the track. Kaplan
and DeMaria (1995) examined the role that storm motion speed at landfall played in the
prolonged TC impacts as the storm moved inland. They found that storm motion speed is
just as critical as the storm intensity upon landfall in affecting the spatial distribution of
deaths (Kruk et. al. 2010).
In this study, a database of all TC-‐ related deaths, both direct and indirect is constructed. From this database, GIS is employed to determine spatial pattern of deaths
relative to the shoreline and each TC track. The size, speed of movement, and intensity of the
TC sample are calculated and associated with the geographic distribution of deaths.
2.1 Study Area
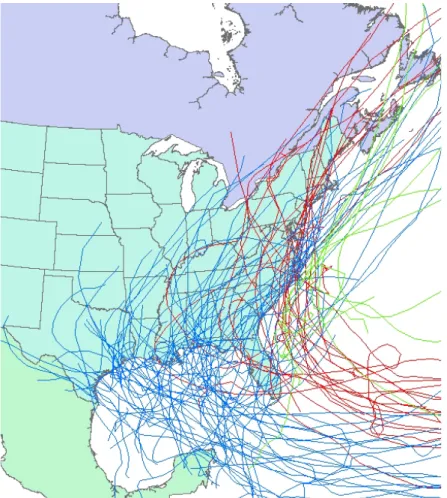
The study area encompasses the eastern United States, focusing on all TCs that made landfall along the Atlantic and Gulf coasts or came within 100km of those coastlines (Figure 1). Any TCs that made landfall along the coast of Mexico or along the Canadian Atlantic provinces were excluded from the analysis.
2.2 Data Sources
This study collected data from three primary sources: AmericasNews Bank, National
Oceanic and Atmospheric Administrations (NOAA) Storm Events Database, and Edward
Rappaport’s study on “Loss of life in the United States associated with Recent Atlantic
tropical cyclones” (2000). Each of these sources has several limitations.
Newspaper articles were key to recording indirect deaths associated with the TC’s
in the study. Newspaper articles are biased towards urban locations and tend to lack
geographic coordinates. Specifically the information from the newspapers is geo-‐coded to
either the street, municipal area, or county depending on the specificity of the information
provided in the article (Kovach and Konrad 2014). The newspaper archive used
AmericasNews Bank (http://infoweb.newsbank.com), and this created time period
limitations, as the archive only contains newspapers from 1985 on and prior to 1990 the
articles are sparse. To find deaths associated with each storm, several keywords were used,
including the storm name, the relevant date range, and the specific words “death”, “died”,
and “killed”.
In addition to the keywords, a buffer of two days before and after the storm dates
was added to capture related death news articles. The two day buffer was selected because
(listed below) are included to help overcome this. Once the related articles were listed,
each article was individually searched for direct and indirect deaths. Deaths found in an
article were recorded along with the article source.
The second source, NOAA Storm Events Database
(http://www4.ncdc.noaa.gov/cgi_wind/wwcgi.dll?wwwEvent~Storms), is a database that
contains much information about each severe weather event from 1950 to present,
including every death (both direct and indirect) reported by NOAA. Storm events
information is provided by the National Weather Service and other sources, including news
media, law enforcement, agencies, and citizen’s reports. NOAA’s Storm Event database was
used as a supplemental source to add any deaths that may not have been reported in the
newspapers.
To find deaths using the Storm Events database, storms were searched individually
by using a date range, the state name, and type of impact (e.g. high winds, storm surge, etc).
Previous studies have found biases in this database, including underreporting of casualties from small impact events (e.g. lightning and hail) (Ashley and Ashley 2008). For this database search, the date range was extended to include five days before and five days after the
actual storm event. The query results included but were not limited too individual death
information, including city, county, death description, direct and indirect, and if available,
the gender and age of the deceased, and the date and time. The National Weather Service
and other sources, such as news media, law enforcement agencies and citizen’s reports
provide the data for Storm Events (Kovach and Konrad 2014).
The final data source is Edward Rappaport database of direct deaths, developed for
for TC’s between 1970-‐1999. It was used specifically to collect death information from
1970-‐1985 due to the lack of available information for this time period in the previous two
sources.
From these three sources, the information gathered included the state, county
where the death occurred, the type of impact, the cause of death, a description of the death,
and in some cases, the date and time in which the death occurred. In some cases, the city
or the street of the death was not provided in which case just the available information was
recorded (e.g. state and county). Most of the information was readily found in
newspapers, however, in some cases indirect deaths that were found in newspapers were
only listed by the number of deaths that occurred in a state. In this case, other newspaper
articles were searched from those states to find more specific geographical information. In
some cases the information was found, in others none. Although three distinct data
sources were used, care was taken to ensure no deaths were recorded twice.
2.3 Death Categories
For this study casualties (aka deaths) are classified into two major categories: direct
deaths and indirect deaths. Direct deaths are deaths that occur during the storm and are
attributed to direct impacts from the storm. Indirect deaths are deaths that occur prior to,
during, and after the storm event. Table 2 outlines how Rappaport 2000 classified deaths.
2.4 Death Locations
was then imported into GIS to produce a map identifying the locations of all deaths documented in this study.
2.5 Storm Analysis
The ArcMap Geographic Information System (GIS) software package was used to
develop a spatial perspective Specifically, it was used to estimate the size and speed of
movement of each TC, and the location of each death relative to the storm’s track and the
nearest shoreline. Archived surface maps were first examined to determine if each death
recorded was associated with the storm.
The ArcMap near-‐distance tool, which allows the measurement from a data point to
a line, allowed for an estimation of the distance of a death from the respective storm track.
An option in this tool provides a measure of the angle of a data point from the storm track
line, which was exploited to ascertain whether each data point fell to the left or the right of
the storm track.
For each death the distance from the death data point to the nearest true shoreline
(either the Gulf or Atlantic Coast) was calculated using GIS. For the shoreline the angle of
the data point was not used because each death occurred to the left (inland) from the
shoreline.
2.6 Storm Size
The size of each TC was determined using daily surface weather maps from the HPC
database between 2003 and 2011, then from the NOAA Central Library US Daily Weather
Maps projects between 1970 and 2002. Using the same methodology as Kovach (2014),
the size of the storm was then estimated by measuring the area inside the outermost closed
the time closest to the storm landfall (Figure 1.3). Weak or very small TCs that did not
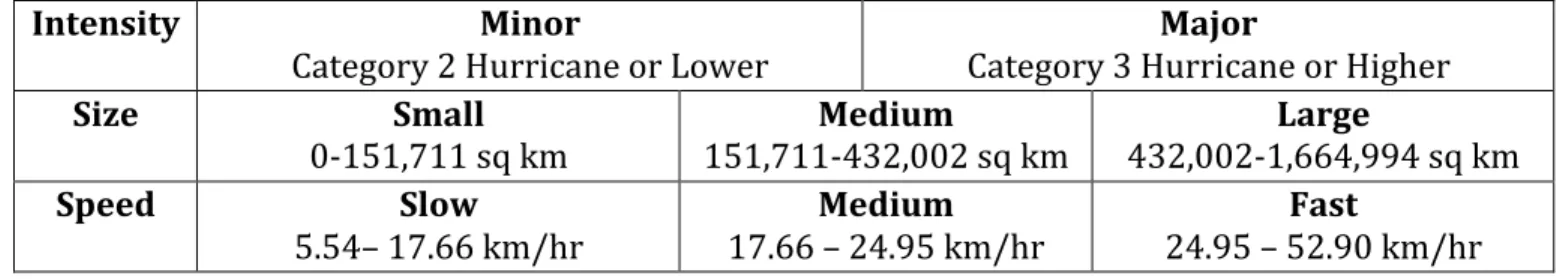
have an outermost closed isobar were recorded as zero. TCs were stratified into three
tercile groups (small, medium, and large) on the basis of their size. With the size listed in
ascending order, the first third of the storms were put into the small category (0-‐151,711
sqkm), the middle third in the medium category (151,711-‐432,002 sqkm), and the upper
third put into the large category (432,002-‐1,664,994 sqkm)
2.7 Storm Track
A storm track is simply the path traced by the center of the system as it moves
across the region. For each storm, a shape file was created for the track to determine
where TC deaths occurred relative to the storm track. An existing outline map of the US
was imported into a blank map in ArcMap and transformed into the North American Datum
(NAD) 1983 projection. To create the line representing the storm path, track points were
plotted using latitude/longitude coordinates imported into ArcMap from the North Atlantic
Hurricane Database (HURDAT), based on the year. Track points were plotted at six hour
intervals. Using the line tool in ArcMap the points were then connected and saved as a
track shapefile for use in later analysis. Figure 1 shows all tracks of all TCs whose deaths
were examined in this study.
2.8 Storm Speed of Movement
The TC’s speed of movement was measured as the distance traversed by the center
of the TC with respect to time. Using the individual track points determined in the track
analysis, the speed of movement for each storm was determined from the position
information given in the NHC’s HURDAT database. Kovach (2014) employed a similar
travelled as the TC makes landfall (e.g. from the last point at sea to the first point inland)
rather than in the first 24 hours after landfall. Table 3 summarizes the categorization of
storm speed, size, and intensity.
2.9 True Shoreline
For this study, a “true shoreline” of the Gulf and Atlantic coast was created. The
“true shoreline” is defined as any part of the coastline that touches the Gulf of Mexico or
Atlantic Ocean. This true shoreline excludes certain areas that touch large bodies of water,
for example the North Carolina Sounds and the Chesapeake Bay. For the Florida Keys the
true shoreline extended the Florida shoreline to include the outer shorelines of the Florida
Keys. Using this definition the shoreline was drawn in GIS using an existing United States
shoreline file as a guide.
2.10 Intensity
The intensity of a TC is defined by the maximum sustained wind speed. The
HURDAT data was used to determine maximum wind speed at the 6-‐hour time closest to
the storms landfall.
2.11 Hurricane Katrina (2005)
Hurricane Katrina [2005] was excluded from the study analysis for several reasons.
First there were an exceptionally large number of indirect deaths that occurred after the
storm, many of which are poorly documented. Second, there is an unknown degree of
underreporting of deaths with the Hurricane. The flooding from the levee breaches caused
80% of New Orleans to be flooded, generating more than 1,100 fatalities, most of which
occurred in the lower 9th ward of New Orleans (Rappaport 2014). Third, the exceptional
influence on the relationships). Rappaport (2014) in fact found that Katrina was
responsible for more than 40% of the TC fatalities in the past 50 years.
3. Results and Discussion
3.1 Overview
The purpose of this research is to develop a detailed analysis of all deaths related to
TCs, both direct and indirect, and the spatial distribution of the deaths based on storm
characteristics (size, speed, intensity), geographical landfall location (Gulf versus Atlantic
coasts), the distance from the shoreline, and the distance and spatial relationship (left or
right) to the storm track. The goal is to look for distinctive patterns in the data that yield
insight into the relationship between TC deaths and the various characteristics.
The analysis consists of 106 Atlantic basin tropical cyclones that made landfall or
came within 60 kilometers of the continental United States between 1970-‐2011 and caused
one or more fatalities (Fig. 1). Of the 106 TCs, 70 (66%) made landfall along the Gulf coast,
23 (22%) made landfall along the Atlantic Coast, and 13 (12%) did not make landfall. In
terms of intensity, 56 storms were sub-‐tropical or tropical (53%), 36 storms were Category
1 or 2 (34%), and 14 storms were Category 3, 4, or 5 (13%).
A total of 1,408 direct and indirect fatalities were recorded and categorized (Table
4). An additional 74 fatalities were recorded, but records were insufficient to determine
the specific cause and location of death. These additional deaths are included in storm
death totals, resulting in 1,482 total fatalities. Overall, roughly two-‐thirds of fatalities were
classified as direct and one-‐third as indirect. About half of the fatalities were rainfall
Atlantic land falling storms accounted for 28% of the total deaths, Gulf storms accounted
for 67%, and non-‐land falling storms resulted in 5% of the deaths.
Each death location was analyzed to determine distance from the nearest shoreline,
distance from the center of the storm track, and whether the death occurred to the left or
the right of the track. For Atlantic land-‐falling TCs 61% of the deaths occurred to the left of
the track, and for Gulf storms, 50% of the deaths occurred to the left of the track.
In terms of individual storms, the largest loss of life was associated with Hurricane
Rita (2005), with over 140 fatalities attributed to the storm. Many of these fatalities were
indirect and associated with health complications (i.e. heart attacks, oxygen tank depletion
etc.) in Texas. After Rita, Hurricane Agnes (1972) was the deadliest tropical cyclone during
the study period, accounting for over 130 fatalities. Roughly 41% percent of these fatalities
occurred as Agnes tracked inland after making landfall. Overall, the top 5 storms were
responsible for about a third of all recorded fatalities. Again, Hurricane Katrina (2005) was
excluded from this study, due to the strong bias on the study sample.
3.2 Geographic Distribution of Deaths
The results of a geographical analysis of death locations across the entire eastern US
shows a concentration in the states near an Atlantic or Gulf coastline (Figure 3a).
However, when deaths are compared on a per capita versus a per area basis, different
states are highlighted with respect to risk. Texas, Louisiana, Florida, South Carolina, and
North Carolina account for the most fatalities per capita (3b), ranging from 1.2 to 1.9
deaths per 100,000 residents. In terms of fatalities per unit area (3c), Florida is again
more fatalities per 100 square kilometers, due to a high number of deaths within a small
area.
3.3 Deaths per Storm
To explore the relationship between storm characteristics and impact type, Table 5
shows both total deaths and the average number of deaths per storm stratified by storm
strength, size, and speed. The impact types examined are rain, wind, tornado, and surf, but
exclude evacuation, unknown, and others. The analysis provides several counter-‐intuitive
results.
In terms of intensity (Table 5a), Category 1 and 2 hurricanes account for nearly 50%
of the total deaths (675), in spite of representing only 34% of the storms studied.
Additionally, Category 1 and 2 storms have a similar death per storm value (18.8) as
Category 3, 4, and 5 storms (19.8), both of which are more than double the Tropical storm
value (9.5). Also of note, in terms of impact type, rain related deaths are higher for Tropical
storms (6.2) than for Category 1 and 2 hurricanes (5.0). This relationship of higher death
per storm for rain related impacts also holds true with small storms (5.0) versus medium
storms (3.1) (Table 5b).
Larger storms, as expected, generate more deaths due to covering a wider land area,
however the deaths per large storm (21.2) is more than double the deaths for medium
(11.8) and small (9.0) (Table 5b). Conversely, medium speed storms (17.3) and fast
moving storms (16.5) both have more than double the deaths of slow speed storms (8.0)
(Table 5c).
These results indicate that hurricanes produce twice as many deaths per storm as
speed storms (medium and fast) also produce a doubling of deaths per storm versus slow
speed storms. Finally, rain related impacts produce the highest deaths per storm,
regardless of storm intensity, size, or speed.
3.4 Distance from Shoreline
One interesting metric of TC deadliness is how far inland TC-‐related deaths occur
after landfall, in particular, the distance from the shoreline in which the TC made landfall
(Figure 4). As expected, the number of TC-‐related deaths decreases with increasing
distance inland from the shoreline; however, this decrease is more dramatic for TCs
making landfall along the Atlantic coast than the Gulf coast. Specifically, for Atlantic
storms, 15% of the deaths occur more than 200 km inland, while for Gulf storms 32% of
the deaths occur more than 200 km inland, likely due to the fact that Gulf TCs tend to
penetrate further inland (Fig. 1). Also noteworthy is that about 10% of Gulf storm deaths
occur more than 600 km inland from the coast.
This study provides more insight by further categorizing death distances from the
shoreline by impact type (Figure 5). The data shows that while wind and tornado related
deaths are localized within 400 km of the shoreline, significant numbers of rain related
deaths extend out to 700 km, with more than half of the deaths related to rainfall occurring
more than 200 km inland. Note however that about 20% of these far inland deaths were
due to the flooding in Pennsylvania associated with Hurricane Agnes (1972).
The data also shows that wind and tornado related deaths display similar patterns
and are more common immediately inland from the coast. Roughly 60% of these deaths
occur within 100 km of the shoreline, since wind speeds associated with TCs typically
3.5 Distance from Track
Additional insights are available by considering the variables of distance from the
storm track (instead of just shoreline), stratified by Atlantic versus Gulf storms and impact
type, and further categorized by the storm characteristics of intensity, size, and speed.
In general, Gulf coast storms produce deaths across a much wider area around the
storm track than Atlantic storms (Figure 6). Specifically, Atlantic coast storms produce
more than 50% of deaths within the first 100 km of the track (Figure 6b), while Gulf coast
storms produce more than 60% of deaths at distances greater than 100 km (Figure 6a).
Wind-‐related deaths occur closer to the center of the track (Figure 7b) than rain-‐
related deaths (Figure 7a), with a significant number of rain related deaths extending out
to 700 km. While both rain and wind related deaths decrease rapidly as the distance from
the track increases, tornado related deaths (Figure 7c) are more evenly distributed up to
500 km from the track, highlighting a more constant threat level for tornados even at great
distances.
Additional insights are found by augmenting the distance from track analysis to
include storm categories (Figure 8). As expected, regardless of intensity, size, or speed, the
most deaths occur within the first 100 km. Note that while hurricanes produce more than
50% of deaths within the first 100 km, tropical storm deaths are more evenly spread across
the 700 km distance from the TC center (Figure 8a). Of particular interest is the decrease
in percentage of deaths in the first 100 km as storm size increases (Figure 8b).
Viewing the data based on storm speed (Figure 8c) shows that fast moving storms
produce more than half of deaths in the first 100 km, slow moving storms also have a high
proportion of deaths within 300 km of the track. These results indicate that TC attributes
play a strong role in shaping the spatial pattern of deaths.
3.6 Distance left and right of the storm track
The final extension to the study investigates how the deaths are distributed left and
right of the storm track. The distribution of deaths in Gulf and Atlantic-‐landfalling storms
is very distinct (Figure 9). Gulf storms produce significantly more deaths within the first
100 km to the right of the track than to the left, while the opposite is true for Atlantic
storms (Figure 9b). This difference is likely due to the fact that the right semicircle of many
Atlantic storms remains largely off the east coast, while this region in Gulf storms always
makes landfall. Also of note is the wider distribution of deaths for Gulf storms, up to 700
km, in comparison with Atlantic storms, in which nearly all deaths occur within 500 km.
The distribution of deaths is further stratified according to the impact type (Figure
10). Rain related deaths (Figure 10a) occur most frequently and display a normal
distribution up to 700 km from the storm track. Rain related deaths decrease with
increasing distance from the track, as the outer bands of the TCs tend to be less
concentrated and weaker than the inner bands and the eye wall. Rain can cause both
indirect and direct deaths, and the data shows that approximately 20% of all rain-‐related
deaths were classified as indirect (e.g. auto-‐accidents caused by wet roads).
As expected, wind related deaths (Figure 10b) and tornado related deaths (Figure
10c) happen more frequently to the right of the storm track and additionally, tornado
related deaths often happen farther from the track than wind related deaths. Specifically,
more than half of all wind related deaths occurred to the right of the TC track, which is
TC contains the strongest winds, increasing the possibility that a tornado will be generated
up to 600 km from the storm track.
Surf related deaths have an unusual and somewhat erratic pattern in both the
distance from the track and the geospatial location (Figure 10d). This result indicates that
any community within the vicinity of a TC can be affected by surf events (e.g. rip currents
and undertow) that can cause deaths, with little predictability based on distance or
orientation to the storm track.
The final result further stratifies the number of deaths left and right of the storm
track by storm characteristics (Figure 11). Tropical storms and strong hurricanes show a
similar distribution with deaths concentrated in the region 100 km to the right of the TC
track. Weak hurricanes, in contrast, show a peak 100 km left of the TC track; however, this
is due to a disproportionate contribution of deaths from Hurricane Rita (2005), which
accounts for a little more than 20% of all deaths in that interval.
Storm size (Figure 11b), clearly plays a strong role in how far from the center of the
track the TC effects can be observed, with large storms causing deaths farther from the
center of the track than small storms. Note that Hurricane Rita continues to influence the
data heavily with a peak in the 0-‐ 100 km bin for medium size TCs.
The final storm characteristic, storm speed (Figure 11c), shows that the distance
and location of deaths varies dramatically based on storm speed. There is a large
difference in the distribution to the left and the right, and the various storm speeds. Fast
moving storms enhance the already strong winds on the right side of the track, resulting in
surprisingly wide distribution of deaths, and medium speed storms deliver a large number
of deaths out through 300 km on both sides.
4. Conclusion
This study provided a sophisticated and detailed analysis of all deaths related to
TCs, both direct and indirect. The spatial distribution of the deaths were analyzed and
stratified according to three storm characteristics (size, speed, intensity), the coast in
which the TC made landfall (Gulf versus Atlantic coast), the distance from the shoreline,
and the distance and location (left or right) of the storm track.
The results provide a nuanced, insightful perspective on TC related deaths and the
relationship to storm properties. Specifically, TC-‐related deaths are heavily influenced by
factors beyond simply TC intensity. The location of landfall (Gulf or Atlantic), the distance
from the center of the storm track or the nearest shoreline, and the geospatial location to
the left or right of the storm track all heavily influence the quantity and cause of deaths
produced by tropical cyclones.
Several broad conclusions result from the analysis. Rain related impacts produce the
highest deaths per storm, regardless of storm intensity, size, or speed. While both rain and
wind related deaths decrease rapidly as the distance from the track increases, tornado
related deaths are more evenly distributed up to 500 km from the track, highlighting a
more constant threat level for tornados even at great distances. Overall, these results
strongly indicate that the size and speed of the storms play as large a role in death
distribution characteristics as storm intensity.
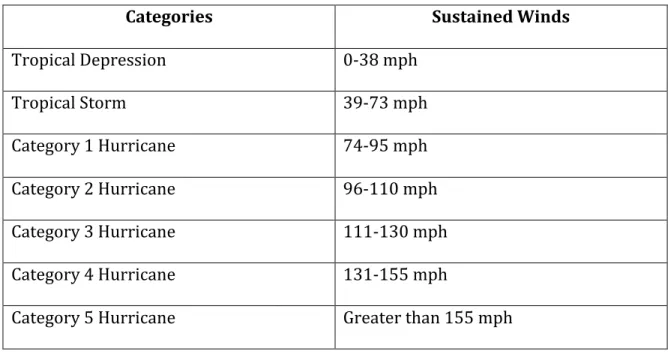
Categories Sustained Winds
Tropical Depression 0-‐38 mph
Tropical Storm 39-‐73 mph
Category 1 Hurricane 74-‐95 mph
Category 2 Hurricane 96-‐110 mph
Category 3 Hurricane 111-‐130 mph
Category 4 Hurricane 131-‐155 mph
Category 5 Hurricane Greater than 155 mph
Table 1: Classifications of Saffir Simpson Scale (http://www.nhc.noaa.gov/sshws.shtml)
Indirect Deaths Direct Deaths
Power Outage (e.g. house fires from unattended candles, carbon monoxide poisoning)
Drowned in Storm Surge, Rough seas, Rip Currents and Freshwater floods
Electrocution from downed power lines Deaths from lightning
Auto-‐Accidents on wet roads (e.g.
hydroplanes, poor visibility) Deaths from wind-‐related events (e.g. flying debris, collapsing structures) Health Issues (e.g. Heart Attacks, Stress,
Heat-‐Related) Deaths from tornado debris (e.g. crushed by tree, flying debris) Deaths occurring during clean up or
during preparation Auto-‐Accidents (e.g. drowning, collision with downed trees)
Table 2: Indirect and Direct Deaths as defined by Edward Rappaport (2000)
Table 3: Storm classifications for this study
Intensity Minor
Category 2 Hurricane or Lower Category 3 Hurricane or Higher Major
Size Small
0-‐151,711 sq km 151,711-‐432,002 sq km Medium 432,002-‐1,664,994 sq km Large
Speed Slow
Figure 1: The tracks of tropical cyclones (TCs) making
Figure 2: An example of the area contained within the outer most isobar for Beryl 2006 (yellow shading).
0% 20% 40% 60% 80% 100%
0 50 100 150 200 250 300 350 400 450
0-‐100 100-‐200 200-‐300 300-‐400 400-‐500 500-‐600 600-‐700
Cu m ul a2 ve T otal P er ce
nt
of
D
eath
s
N
um
be
r o
f D
eath
s
Distance from Shoreline in KM
Gulf Coast
Deaths Cumula2ve
0% 20% 40% 60% 80% 100%
0 50 100 150 200 250
0-‐100 100-‐200 200-‐300 300-‐400 400-‐500 500-‐600 600-‐700
Cu m ul a2 ve P er ce
nt
of T otal D eath N um be
r o
f D
eath
s
Distance from Shoreline in KM
Atlan2c Coast
Deaths Atlan2c Cumula2ve Percentage
Figure 4: The number of deaths stratified by the distance inland from the shoreline for TC landfalls along the a) Gulf Coast and b) Atlantic
Coast. The red line identifies the cumulative percentage of deaths from
far inland (i.e. 600-700km) to the coastline).
a.
Figure 6: The number of deaths stratified by distance from the TC track for TC landfalls along the a) Gulf Coast and b) Atlantic Coast.
0 20 40 60 80 100
0 50 100 150 200 250 300
0-‐100 100-‐200 200-‐300 300-‐400 400-‐500 500-‐600 600-‐700
Cu mu la te P er ce nt o
f D
ea
th
s
N
umb
er
o
f D
ea
th
s
Distance from Track in km
Atlantic Coast
Deaths Cumulate %
0 20 40 60 80 100
0 50 100 150 200 250 300 350 400 450
0-‐100 100-‐200 200-‐300 300-‐400 400-‐500 500-‐600 600-‐700 Cumu
la te P er ce nt o
f D
ea
th
s
N
umb
er
o
f D
ea
th
s
Distance from Track in km
Gulf Coast
Deaths Cumulate %
a.
0 50 100 150 200 250
N
um
be
r o
f D
eath
s
Distance from Track in km
Gulf Coast
Deaths
0 20 40 60 80 100 120 140 160
N
um
be
r o
f D
eath
s
Distance from Track in km
Atlan2c Coast
Deaths
b. a.
References:
AMS: Policy statement of the American Meteorological Society on hurricanes.
(1973).Bulletin of the American Meteorological Society, 54, 46–47. Web.
AmericasNews Bank. (2012). Retrieved from http://infoweb.newsbank.com. Web.
Ashley, S. T., & Ashley, W. S. (2008). Flood Fatalities in the United States. Journal of Applied
Meteorology and Climatology, 47(3), 805–818. Web.
Borden, K. A., & Cutter, S. L. (2008). Spatial patterns of natural hazards mortality in the
United States. International Journal of Health Geographics, 7(64).
doi:10.1186/1476-‐072X-‐7-‐64
Combs, D. L., Parrish, R. G., McNabb, S. J. N., & Davis, J. H. (1996). Deaths Related to
Hurricane Andrew in Florida and Louisiana, 1992. International Journal of
Epidemiology, 25(3), 537–544. Web.
Kaplan, J., & DeMaria, M. (1995). A simple empirical model for predicting the decay of
tropical cyclone winds after landfall. Journal of Applied Meteorology, 34, 2499–
2512. Web.
Kovach, M. M., & Konrad II, C. E. (2014). The spatial distribution of tornadoes and high wind
impacts associated with inland-‐moving tropical cyclones in the southeastern United
States. Physical Geography, 35(3), 245–271. Web.
Kruk, M. C., Gibney, E. J., Levinson, D. H., & Squires , M. (2010). A Climatology of Inland
Winds from Tropical Cyclones for the Eastern United States. Journal of Applied
McKinney, N., Houser, C., & Meyer-‐Arendt, K. (2010). Direct and Indirect mortality in
Florida during the 2004 hurricane season. International Journal of Biometeorology,
55(4), 533–546. Web.
Rappaport , E. N. (2000). Loss of life in the United States associated with recent Atlantic
tropical cyclones. Bulletin of the American Meteorological Society, 81(9), 2065–
2073. Web.
Rappaport, E. N. (2014). Fatalities in the United States from Atlantic Tropical Cyclones:
New Data and Interpretation. Bulletin of the American Meteorological Society,
95(3), 341–346. Web.
The Saffir-‐Simpson Hurricane Wind Scale. (2013). Retrieved from
http://www.nhc.noaa.gov/sshws/shtml. Web.
Zane, D. F., Bayleyegn, T. M., Hellsten, J., Beal, R., Beasley, C., Haywood, T., Wiltz-‐Beckham,
D., et al. (2011). Tracking Deaths Related to Hurricane Ike, Texas, 2008. Disaster
Medicine and Public Health Preparedness, 5(1), 23–28. Web.