Acknowledgements
I would like to thank Dr. Channing Der for giving me the opportunity to learn in his lab,
and his full support throughout my years in the lab. I would like to thank Dr. Kirsten
Bryant for spending countless hours training me, challenging me, and expecting the
most of me from day one. And I would like to thank my parents, who continuously
TABLE OF CONTENTS
Chapter
I. ABSTRACT...1
II. INTRODUCTION...3
III. SPECIFIC AIMS AND HYPOTHESES...7
IV. METHODS...11
V. RESULTS...14
VI. DISCUSSION...22
VII. REFERENCES...26
FIGURES 1. Autophagy Schematic...8
2. Autophagy inhibition impairs PDAC cell line proliferation...15
3. Autophagy inhibitors Spautin-1, SBI-0206965, and MRT6891 synergize with SCH…...17
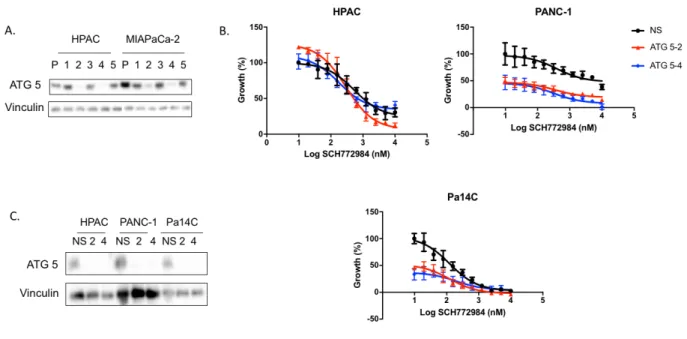
4. ATG5 KD sensitizes cells to ERK inhibition...19
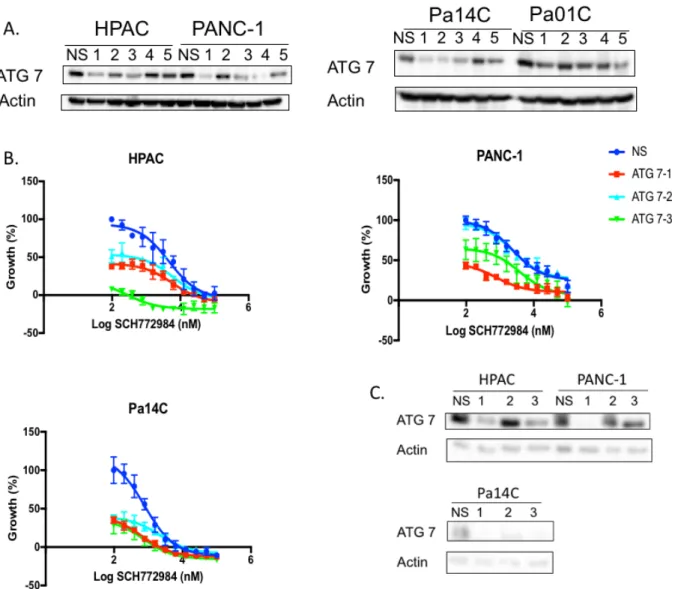
5. ATG7 KD sensitizes cells to ERK inhibition...20
I. ABSTRACT
Background: Pancreatic cancer has a dismal 5-year survival rate of 9%. KRAS is mutated in 98% of pancreatic ductal adenocarcinomas (PDACs), making the discovery
of a treatment for KRAS mutant cancers urgent. However, over 30 years of effort have
yet to yield a direct anti-KRAS therapeutic, thus a current focus of the field is targeting
downstream effectors of mutant KRAS.
Hypothesis: We hypothesize that the synergy seen between SCH772984 (SCH), an ERK inhibitor, and chloroquine, an inhibitor of lysosomal acidification, is due to the
ability of chloroquine to block the cell from harnessing energy through autophagy.
Methods: HPAC, PANC-1, Pa14C and Pa01C cell lines were treated with a
combination of SCH and autophagy specific inhibitors Spautin-1, SBI-0206965 (SBI),
and MRT68921 (MRT). Cells were treated with the drugs alone and in combination with
SCH for 72 hours, and proliferation assays were used to quantify the effect on cell
growth. In a parallel line of investigation, ATG5 and ATG7 were genetically silenced
using shRNA in a panel of PDAC cell lines. Following western blot analyses to confirm
ATG5 or ATG7 knockdown, the sensitivity of these cells to SCH were compared to that
of parental cells using proliferation after 72 hours of treatment as a readout.
Results: Each autophagy inhibitor analyzed synergized with SCH in multiple PDAC cell lines. For these studies, the autophagy inhibitors were held at constant concentrations,
with SCH at concentrations ranging from 0.156µM to 1.25µM. MRT consistently showed
the most synergy in our studies. In addition, growth curves of PDAC cells with ATG5 or
ATG7 knockdown demonstrated that genetic silencing of autophagy-related proteins
increase sensitivity to SCH treatment compared to wild type. PDAC cells became more
sensitive to SCH following each of these forms of autophagy inhibition in our studies.
Conclusion: Each of the autophagy inhibitors synergized with the ERK inhibitor in multiple PDAC cell lines. Additionally, cells in which vital autophagy genes, ATG5 or
ATG7, were knocked down were more sensitive to SCH. These findings suggest that
the synergy between chloroquine and SCH is at least partially due to the inhibition of
II. INTRODUCTION
Pancreatic ductal adenocarcinoma (PDAC) is one of the deadliest cancers with a
9%, 5-year survival rate, and it is projected to become the second leading cause of
cancer death by 2020 (Rahib et al., 2014). Clinically, symptoms of PDAC include
jaundice, weight loss, poor appetite, nausea, and stomach or back pain (Siegel, Miller,
& Jemal, 2017). Due to difficulty in distinguishing these symptoms from other
diagnoses, and the lack of a sufficient clinical diagnostic tool, PDAC is typically not
detected until it reaches later stages. Currently, the lone curative option is surgery, but
only 20% of patients are eligible because most patients present with metastatic disease
and do not qualify for surgery. Thus, many patients are in need of new treatments.
The three RAS genes (HRAS, NRAS, and KRAS) modulate cellular
differentiation, proliferation, migration and apoptosis making them essential for cellular
signaling. RAS is a GTPase that is activated when it is bound to guanosine triphosphate
(GTP) and inactive when it is bound to guanosine diphosphate (GDP). RAS GTP-GDP
cycling is regulated by guanine nucleotide exchange factors (GEFs) that stimulate
nucleotide exchange and by GTPase activating proteins (GAPs) which accelerate GTP
hydrolysis activity. Once activated, RAS-GTP interacts with numerous signaling
pathways that regulate diverse cellular processes. Mutation of residues G12, G13 and
Q61 prevent the association between KRAS and GAPs by reducing van der Waals
interactions (Scheffzek et al., 1997) and also interfere with the water molecule
necessary for GTP hydrolysis (Scheidig, Burmester, & Goody, 1999). The RAS genes
of PDAC, and is an accepted driver of PDAC growth and maintenance (Cox, Fesik,
Kimmelman, Luo, & Der, 2014).
Because KRAS drives PDAC, there have been many efforts to target this protein
using a variety of mechanisms (Papke & Der, 2017). Targeting the protein directly has
been especially difficult, because RAS signals through protein-protein interactions
(Tanaka & Rabbitts, 2010), which are difficult to target with small molecules. This has
resulted in a shift in focus to downstream effectors of KRAS. Most efforts have
concentrated on the RAF-MEK-ERK (MAPK) and the PI3K-AKT-mTOR pathways.
There are three isoforms of RAF; ARAF, BRAF and CRAF. There are currently two
BRAF inhibitors approved to treat BRAF-mutant melanoma, vemurafenib and
dabrafenib. Unexpectedly, these inhibitors activate rather than inhibit ERK in RAS
-mutant cancers (Hatzivassiliou et al., 2010; Heidorn et al., 2010). MEK inhibitors have
been more successful, and have shown greater effect when used in combination with
BRAF inhibitors as opposed to being used as a monotherapy (Flaherty et al., 2012).
This is thought to be due to compounded dampening of the pathways that lead to ERK
reactivation. Despite some inhibitors reaching the clinic, they have been largely
unsuccessful in RAS-mutant cancers as monotherapies. Resistance to BRAF and MEK
inhibitors monotherapy is due to upregulation of upstream activators that reactivate ERK
(Ryan, Der, Wang-Gillam, & Cox, 2015). There are four ERK inhibitors that have
entered Phase 1 clinical studies (BVD-523, MK8353, GDC-0994, and CC-90003), and
MK8353 (analog of SCH772984) has been described preclinically (Morris et al., 2013).
A recent study from our lab has showed that mechanistically ERK inhibition leads to
This study also suggested that PI3K-AKT-mTOR signaling plays an important role in
ERK inhibitor sensitivity and that combination treatments will be the most successful in
treating PDAC patients (Hayes et al., 2016).
It has been demonstrated that KRAS mutant cancer cells alter their metabolic
programming to better suit their rapid proliferation; thus, another recent approach to
targeting KRAS has been to target the metabolic processes it regulates (Bryant,
Mancias, Kimmelman, & Der, 2014). KRAS-driven metabolic alterations include
induction of glucose uptake, altered glutamine metabolism and an upregulation of
macropinocytosis and autophagy. Autophagy is a mechanism utilized by the cell to
recycle damaged organelles and provide ATP and amino acids, lipids, sugars and
nucleosides (Rabinowitz & White, 2010). Autophagy is induced by nutrient depletion or
starvation; subsequently, an autophagosome will form, sequestering cytosolic proteins
and organelles by a double-membrane vesicle. The autophagosome will then fuse with
lysosomes, which will breakdown the contents of autophagic vesicle and release
macromolecules for the cell to reuse.
While it appears that PDAC cells rely on autophagy for growth, the role of KRAS
in this upregulation is still not completely understood. PDAC cell lines display elevated
levels of autophagy (S. Yang et al., 2011). In vitro studies show chloroquine, an indirect
inhibitor of autophagy, was more effective in the treatment of PDAC cell lines with
elevated autophagy, compared to non-PDAC cell lines with low basal autophagy (H460
and MCF7) (S. Yang et al., 2011). Although an in vivo study suggested that chloroquine
might be tumor promoting in RAS-dependent pancreatic cancers that develop with
result to the homozygous deletion of p53, and support using anti-autophagy therapies in
PDAC (A. Yang et al., 2014). Chloroquine was unsuccessful as a monotherapy in
clinical trials (Wolpin et al., 2014), but autophagy inhibition alone may not be sufficient
to prevent tumor growth, whereas a combination treatment may be successful.
In an effort to determine whether the efficacy of an ERK inhibitor could be
enhanced with the additional targeting of a second pathway, a previous graduate
student in the lab collaborated with Krister Wennerberg (Institute for Molecular
Medicine, Finland) to determine what drugs synergize with ERK and MEK inhibitors.
The drug screen was done in the PDAC cell lines HPAC and Panc10.05. Cells were
exposed to dose-dependent drug sensitivity testing against 309 compounds in the
presence and absence of the ERK inhibitor, SCH772984, or the MEK inhibitor,
AZD6244 (Hayes et al., 2016). Interestingly, chloroquine, and inhibitor of lysosomal
acidification, synergized with SCH772984. Chloroquine accumulates in the acidic parts
of the cell, like the lysosome, and leads to the inhibition of enzymes that require an
acidic pH, thus preventing lysosomal fusion (Hsin et al., 2012). Because chloroquine
prevents the fusion of the autophagosome to the lysosome, it indirectly inhibits
autophagy. However, the cell degrades other remnants and endosomes, including
macropinosomes via the lysosome. Thus, it is unclear whether the effect of chloroquine
in combination with SCH772984 is due to the inhibition of autophagy in particular, or if it
III. SPECIFIC AIMS, HYPOTHESIS
PDAC remains one of the deadliest cancers with a 5-year survival rate of 9%
(Rahib et al., 2014). It remains difficult to detect due to its general symptoms and the
lack of any accurate diagnostic tools to detect the cancer before it has spread. Current
treatments for metastatic PDAC are minimally effective, and there remains a dire need
for new therapies.
The commitment to finding an anti-RAS drug has yet to yield any effective clinical
treatments, resulting in many labeling the protein “undruggable”. But the field is
adapting, and finding new approaches to target RAS mutant cancers. One approach
involves preventing RAS from attaching to the plasma membrane. RAS must be
positioned on the inner face of the plasma membrane to be active, so many have
attempted to prevent this attachment by targeting post translational modifications that
are attached to the CAAX motif. Our lab has mostly focused on targeting downstream
effectors of RAS, the most validated pathways are the PI3K-AKT-mTOR and
RAF-MEK-ERK pathways. Targeting the RAF-MEK-RAF-MEK-ERK signaling cascade has yielded some
clinical trial candidates, which have ultimately failed as monotherapies in PDAC. We are
currently focusing on the ERK inhibitor due to recent data suggesting that it may be an
effective treatment when used in combination with other drugs (Hayes et al., 2016). A
new and novel approach for treating RAS mutant cancers is by targeting metabolic
processes. We have specifically focused on autophagy due to its clear upregulation in
PDAC (Guo et al., 2011; S. Yang et al., 2011). Autophagy is a scavenging process that
results in the recycling of damaged organelles and proteins to produce energy for the
degraded, are broken down by the lysosome. Chloroquine is an inhibitor of lysosomal
acidification, and inhibits autophagy by preventing the autophagosome from fusing with
the lysosome. Chloroquine has not been successful as a monotherapy in humans;
however, combination therapy with other drugs is still under investigation (Wolpin et al.,
2014).
Figure 1. The metabolic process of autophagy. Autophagy is initiated by AMPK when cells are deprived by energy. The membrane of the autophagosome is elongated and surrounds proteins and organelles that will be recycled. The autophagosome fuses with the lysosome to form an autolysosome, which contains the degraded remnants of the cell. Those remnants are then released into the cytoplasm. The approaches taken in our studies targeted different stages of this process. SBI-0206965 inhibits ULK1 and MRT68921 inhibits the ULK1/2 complex, which are part of the preinitiation complex. Spautin-1 inhibits VPS34, part of the initiation complex. Knockdown of ATG5 and ATG7 targets the elongation reaction of the membrane so it cannot be completely formed.
Unpublished data from our laboratory demonstrated that KRAS mutant
pancreatic cancer cells exhibit upregulated autophagic flux following ERK inhibition and
KRAS knockdown (Bryant, KL). Furthermore, in collaboration with Krister Wennerberg,
the ERK inhibitor in multiple pancreatic cancer cell lines (Hayes et al., 2016). Dr. Bryant
validated the synergy in multiple PDAC cell lines using two chemically distinct ERK
inhibitors. However, because chloroquine has is an inhibitor or lysosomal acidification
and does not directly inhibit autophagy, we aimed to validate whether the synergistic
effects are due to the inhibition of autophagy or the more general inhibition of the
lysosome. In our Aim 1 studies, we will utilize specific inhibitors of autophagy and
determine if they too synergize with ERK inhibition to slow PDAC cell proliferation. We
will utilize two different inhibitors of ULK, an upstream regulator of autophagy,
SBI-0206965 (ULK1) and MRT68921 (ULK1/2), as well as Spautin-1, an inhibitor of a further
downstream regulator, Vps34 (Figure 1). While these inhibitors are not clinical
candidates, like chloroquine, they more directly inhibit the process of autophagy and
can be used in cell culture experiments. In my Aim 2 studies we will utilize a genetic
approach, shRNA-mediated knockdown of genes essential for autophagy (ATG5 and
ATG7), to assess whether cells that are deficient in autophagy are more sensitive to
ERK inhibition (Figure 1). We hypothesize that the effect of chloroquine, in combination
with SCH, is at least partially due to the inhibition of autophagy, which we will determine
using different forms of autophagy inhibition in combination with SCH.
and in combination with each autophagy inhibitor to determine if we see synergy
between these drugs and ERK inhibition.
Aim 2: To establish whether PDAC cells in which ATG5 or ATG7 has been genetically silenced are more sensitive to SCH treatment. We will obtain five shRNAs for either ATG5 or ATG7 and determine which two best silences the protein of
interest. Following this, we will stably silence ATG5 and ATG7 in a panel of PDAC cell
IV. METHODS Cell Lines
PDAC cell lines HPAC, PANC-1 were obtained from American Type Culture Collection
(ATCC) and lines derived from human PDAC patient xenografts (Pa01C, Pa14C)
(Jones et al., 2008) were provided by A. Maitra (MD Anderson, Houston, TX). All lines
were maintained in Dulbecco’s Modified Eagle Medium (DMEM) with 10% FBS and
penicillin/streptomycin.
Constructs
The shRNA constructs used were obtained from the UNC-Chapel Hill Lenti-shRNA Core
Facility. We obtained five ATG 5 constructs: TRCN0000099432 (ATG5-1),
TRCN0000151963 2), TRCN0000150645 3), TRCN0000151474
(ATG5-4), and TRCN0000099431 (ATG5-5); and five ATG7 constructs: TRCN0000007584
(ATG7-1), TRCN0000007587 (ATG7-2), TRCN0000007586 (ATG7-3),
TRCN0000007585 (ATG7-4), TRCN0000007588 (ATG7-5).
Lentiviral Transduction
HPAC, PANC-1, Pa01C, and Pa14C cells were plated at a density such that they would
be 50-80% confluent in 24 hours. Cells were infected for 8 hours at 37˚C in DMEM
containing 8µg/mL polybrene with 500µL of each respective lentivirus. Following
infection, cells were allowed to recover overnight in complete media, and then selected
with puromycin. The HPAC cells were selected with 1.5µg/mL, PANC-1 cells with
selection, cells were maintained in media containing 0.5µg/mL puromycin. Transduction
was confirmed via western blotting.
Proliferation Assays
For experiments involving ATG KD cells, parental, ATG5 and ATG7 knockdown cells
were plated in black, 96-well plates. Cell plating densities were the following: HPAC:
1,300 cells/well, PANC-1: 2,000 cells/well, Pa14C: 2,500 cells/well, and Pa01C: 2,500
cells/well. Following 24 hours, the cells were treated with SCH772984, over a range of
concentrations (19.5nM to 10µM). DMSO was held constant at at 5nM. Cells were
incubated at 37˚C for 72hr and proliferation was quantified using a Minimax 300
Imaging Cytometer (Molecular Devices). For cell counting, cells were labeled with either
SYTO 61 red fluorescent nucleic acid or Calcein, AM (Invitrogen). Cells were blotted to
confirm ATG knockdown.
For experiments involving autophagy inhibitors, parental cell lines were seeded at the
following densities: HPAC: 1,500 cells/well, PANC-1: 2,000 cells/well, Pa14C: 2,000
cells/well, and Pa01C: 2,000 cells/well. The next day cells were treated with
SCH772984, over a range of concentrations (19.5nM to 10µM) either alone, or in
combination with a constant amount of Spautin-1 (Vps34; 1.25µM), SBI-0206965
(ULK1; 2µM), and MRT68921 (ULK1/2; 500nM) (Xcessbio). Cells were labeled and
Western Blotting
Cells were washed in PBS, incubated in lysis buffer (25 mM Tris, pH 7.4, 100 mM NaCl,
1 mM EDTA, 1% (v/v) Triton 100, Phosphatase Inhibitor Cocktails I/II (Millipore), and
complete protease inhibitor cocktail (Roche)), and supernatants were retained following
microcentrifuge centrifugation. Protein concentrations of whole cell lysates were
determined using the Bio-Rad protein assay. Lysates (25-35mg total protein/lane) were
resolved by SDS/PAGE, and the proteins were transferred to PVDF membranes. The
filters were blocked in 10% BSA diluted in 20 mM Tris, 135 mM NaCl, and 0.02%
Tween 20 and then incubated with the indicated primary antibodies diluted in the same
buffer. The primary antibodies were detected with HRP-conjugated secondary
V. RESULTS
Autophagy inhibition via inhibition of ULK 1/2 and VPS34 reduces pancreatic cancer cell proliferation
Our lab and others have previously demonstrated that inhibition of autophagy
with chloroquine, an inhibitor of lysosomal acidification, reduces PDAC cell proliferation
(S. Yang et al., 2011). In order to determine if the effects of chloroquine were due to the
inhibition of autophagy and not the general effects of lysosomal inhibition, we decided to
study the effects of more specific autophagy inhibitors on PDAC cell proliferation. In
order to determine the appropriate concentration to drug cells in combination
experiments, dose responses were completed for each autophagy inhibitor. We chose
three different autophagy inhibitors, SBI-0206965 (SBI), MRT68921 (MRT), and
Spautin-1. SBI targets ULK1, and MRT targets ULK1/2, which is involved in the
preinitiation complex of autophagy (Egan et al., 2015; Petherick et al., 2015). This
process is activated when the cell is deprived of energy, through the activation of
AMPK, a key energy sensor in the cell activated during energy deprivation (Kim, Kundu,
Viollet, & Guan, 2011). Spautin-1 inhibits VPS34 which is involved in the formation of
the autophagosome initiation complex (Mancias & Kimmelman, 2011). The initiation
complex promotes the growth of a membrane that will eventually become the
autophagosomal membrane and envelop the macromolecules that will be recycled. We
determined the GI50 in four different cell lines: HPAC, PANC-1, Pa14C, and Pa04C
(Table 1, Figure 2). We used this information to choose the constant concentration of
each autophagy inhibitor to be used in our subsequent ERK inhibitor combination
Table 1. The GI50s for Spautin-1, SBI-0206965, and MRT68921 in HPAC, PANC-1, and Pa14C cell lines.
Inhibition of ULK 1/2 and VPS34 synergizes with ERK inhibition to further reduce pancreatic cancer cell proliferation
Our laboratory has observed that chloroquine treatment synergized with ERK
inhibition to reduce PDAC cell proliferation (Bryant, KL). Chloroquine is routinely used in
the clinic for the treatment of malaria and other rheumatological disorders (Rainsford,
Parke, Clifford-Rashotte, & Kean, 2015), and other groups have calculated the
concentration that is attained in the patient to be on the order of 5-8µM (Alec
Kimmelman, NYU, personal communication). Thus, in our lab’s previous experiments,
chloroquine was held constant at a concentration near this range, while the
concentration of ERK inhibitor was varied. In order to compare these studies to what
was observed with chloroquine, we held each autophagy inhibitor constant and varied
the ERK inhibitor concentration over a range of 19.5nM to 10µM. We used a
concentration of 1.25µM for Spautin-1, 2µM for SBI, and 500nM for MRT. Proliferation
was quantified following 72hr or inhibitor treatment. Figure 3 illustrates a shift in the
growth curve of pancreatic cancer cells when SCH is treated in combination with the
concentration of each autophagy inhibitor: (List) The combination was assayed in HPAC, PANC-1, Pa14C, and Pa01C cell lines. Data shown is representative of three replicates. (B) CI values were calculated from data displayed in (A). A CI value of <1 (red line) is indicative of synergy.
The combination index (CI) is a measure of synergy between two drugs, with a
score of less than one being considered synergistic, and a score of more than one as
antagonistic. Clear synergy is observed between either SBI or MRT and SCH. The
combination of SCH and MRT consistently showed greater synergy, with lower CIs in
each cell line. Spautin-1 synergized best in each cell line when the concentration of
SCH was 0.3125 µM or 0.625µM, with the CIs increasing as concentrations decreased
or increased (Figure 3). The combination of Spautin-1 and SCH was the least
synergistic in the HPAC cell line, and Pa01C cell line. This could be due to the effects of
Spautin-1 being significant alone, so the room for improved response to the combination
treatment is reduced.
Genetic silencing of ATG5 or ATG7 sensitizes pancreatic cancer cells to ERK inhibition
To complement our inhibitor studies we also employed a genetic approach to
silence key regulators of autophagy and determine if this sensitizes cell to ERK
inhibition. We inhibited autophagy using shRNA constructs to silence ATG5 and ATG7.
ATG5 and 7 are essential for the elongation of the autophagosome membrane, and for
the complete formation of the autophagic vesicle (Rabinowitz & White, 2010). We
hypothesized that ATG knockdown would phenocopy what we observed with
pharmacological autophagy inhibition. Before beginning drug studies, we determined
which shRNA constructs could most effectively target ATG5 and ATG7. Cells were
the best knockdown. The ATG5 constructs that provided the best knockdown were 2
and 4 (Figure 4A). The ATG7 constructs that provided the best knockdown appear to
vary with the cell line they were tested in; therefore, we proceeded with constructs 1, 2
and 3 (Figure 5A).
Figure 5. ATG7 KD sensitizes cells to ERK inhibition. (A) ATG 7 was knocked down in HPAC, PANC-1, Pa14C, and Pa01C cell lines to determine which constructs provided the best knock down, constructs 1, 2 and 3 were chosen for future experiments.(B) Proliferation was assayed following 72hr of ERK inhibition in the HPAC, PANC-1, Pa14C, and Pa01C cell lines. (C) Western blot confirms ATG7 KD.
Cells in which ATG5 or ATG7 was genetically silenced were then treated with
SCH, and the growth curves were compared to those from cells transduced with a
non-targeting shRNA. These experiments were performed in three different PDAC cell lines:
HPAC, PANC-1, and Pa14C. The cells were drugged over a range of SCH
concentrations (19.5nm to 10µM). The data suggests that cells in which ATG5 has been
evidenced by the fact that the growth curves were shifted to the left in cells with ATG5
knockdown, and suggests that cells incapable of autophagy are more sensitive to ERK
inhibition. The knockdown was confirmed by western blotting for ATG5 (Figure 4C).
Likewise, the drug studies with ATG7 knockdown also show that cells are more
sensitive to ERK inhibition when autophagy is inhibited through genetic silencing of
VI. DISCUSSION
Despite more than three decades of effort, no clinically effective therapies have
been developed for RAS-mutant cancers. Clearly, new ideas and directions are needed
to advance this field. Our lab recently reported that ~50% of RAS-mutant human PDAC
cell lines are sensitive to ERK inhibition (Hayes et al., 2016). However, clinical results
with RAF and MEK inhibitors emphasize that the RAF-MEK-ERK cascade is not a linear
pathway and that compensatory mechanisms abound (Samatar & Poulikakos, 2014). A
chemical library screen to identify compounds that enhance ERK inhibitor efficacy,
showed that chloroquine, an inhibitor of autophagy, synergizes with ERK inhibition.
Ongoing experiments in the lab have demonstrated that ERK inhibition increases
autophagic flux. Thus, we hypothesize that autophagy is evoked as a compensatory
energy scavenging pathway, in response to the loss of ERK-regulated metabolic
processes. These studies were aimed at determining whether the synergy between
ERK inhibition and chloroquine is due to autophagy inhibition, the more general effects
of chloroquine’s inhibition of lysosomal acidification. We show that more specific
inhibitors of autophagy synergize with ERK inhibition to levels similar to that of
chloroquine. Furthermore, we demonstrate that genetic silencing of ATG5 and ATG7,
two important regulators of autophagy, sensitize PDAC cell lines to ERK inhibition.
Thus, we conclude that the effects of chloroquine are due, at least in part, to the
Autophagy inhibitors synergize with SCH in pancreatic cancer cell lines
To determine if the effects of chloroquine were due to autophagy inhibition, we
began by using more specific autophagy inhibitors in combination with SCH.
Chloroquine was Dr. Bryant’s focus primarily due to it has already been approved for
use in humans. There are few drugs that target proteins involved in autophagosome
formation, as opposed to the lysosome. The CI values for SBI, MRT, and Spautin-1 in
combination with SCH are less than one over a range of concentrations. Because a CI
value of less than one is indicative of synergy, these CI values and the corresponding
growth curves suggest that each shows synergistic effects when used in combination
with ERK inhibition. The Pa14C cell line consistently shows higher CI values that even
indicate antagonism when MRT is combined with SCH at concentrations greater than
2.5µM and when SBI is combined with SCH at concentrations greater than 5µM. This
effect could be because the ULK inhibitors alone have a significant effect on the growth
of the Pa14C cell line, thus, because so many cells are already dead, the effect of SCH
in combination is not significant enough for it to be considered synergistic. Because
these autophagy inhibitors behave very similarly to chloroquine in terms of synergy with
an ERK inhibitor, we believe the synergy of chloroquine with SCH is at least partially
due to the inhibition of autophagy. There is still clearly a need for well-validated
inhibitors that target proteins specifically involved in autophagy, since lysosomal targets
ATG5 and ATG7 knockdown enhances ERK inhibition in pancreatic cancer cell lines
To complement our drug studies, we also performed shRNA-mediated
knockdowns of ATG5 and ATG 7, two essential genes for autophagy, to determine if
cells in which autophagy is impaired are sensitized to ERK inhibition. Cells in which
ATG5 had been knocked down were more sensitive to SCH treatment than parental cell
lines. Growth curves and GI50’s showed that construct 4 made HPAC, PANC-1 and
Pa14C cells most sensitive to ERK inhibition. A constant problem we encountered
during our studies is that we had a low number of cells survive selection after ATG7-3
knockdown. This was particularly a problem in Pa01C cell line. We predict that this
could either be due to the virus not entering the cells, or that this particular construct
has off-target effects that are lethal to the cell. This resulted in unreliable data from
Pa01C cell line due to their low seeding density and high death rate. Although shRNA is
considered a precise gene silencing mechanism, there are still off-target effects that
should be recognized. The shRNA could include partial sequence complementarity of
non-target mRNAs, which can result in effects not attributable to the gene of interest.
Future Directions
Although we have collected data suggesting that the synergy between
chloroquine and SCH is at least partially due to the inhibition of autophagy, further
studies will determine if macropinocytosis is a factor in the effects seen in the
combination treatment. Since macropinosomes are also broken down in the lysosome,
We would also explore other metabolic processes to determine how the cell rewires
after KRAS knockdown, and treatment with SCH. Some processes of interest are
glycolysis, oxidative phosphorylation and glutamine metabolism.
The data in our studies suggest that the effects seen in the combination therapy
of chloroquine and SCH are at least partially due to autophagy inhibition. Further
studies could assess these drug treatments in three dimensional organoid cultures, and
I. REFERENCES
Bryant, K. L., Mancias, J. D., Kimmelman, A. C., & Der, C. J. (2014). KRAS: feeding pancreatic cancer proliferation. Trends in Biochemical Sciences, 39(2), 91–100. http://doi.org/10.1016/j.tibs.2013.12.004
Cox, A. D., Fesik, S. W., Kimmelman, A. C., Luo, J., & Der, C. J. (2014). Drugging the undruggable RAS: Mission possible? Nature Reviews. Drug Discovery, 13(11), 828– 851. http://doi.org/10.1038/nrd4389
Egan, D. F., Chun, M. G. H., Vamos, M., Zou, H., Rong, J., Miller, C. J., et al. (2015). Small Molecule Inhibition of the Autophagy Kinase ULK1 and Identification of ULK1 Substrates. Molecular Cell, 59(2), 285–297.
http://doi.org/10.1016/j.molcel.2015.05.031
Flaherty, K. T., Infante, J. R., Daud, A., Gonzalez, R., Kefford, R. F., Sosman, J., et al. (2012). Combined BRAF and MEK inhibition in melanoma with BRAF V600
mutations. The New England Journal of Medicine, 367(18), 1694–1703. http://doi.org/10.1056/NEJMoa1210093
Guo, J. Y., Chen, H.-Y., Mathew, R., Fan, J., Strohecker, A. M., Karsli-Uzunbas, G., et al. (2011). Activated Ras requires autophagy to maintain oxidative metabolism and tumorigenesis. Genes & Development, 25(5), 460–470.
http://doi.org/10.1101/gad.2016311
Hatzivassiliou, G., Song, K., Yen, I., Brandhuber, B. J., Anderson, D. J., Alvarado, R., et al. (2010). RAF inhibitors prime wild-type RAF to activate the MAPK pathway and enhance growth. Nature, 464(7287), 431–435. http://doi.org/10.1038/nature08833 Hayes, T. K., Neel, N. F., Hu, C., Gautam, P., Chenard, M., Long, B., et al. (2016).
Long-Term ERK Inhibition in KRAS-Mutant Pancreatic Cancer Is Associated with MYC Degradation and Senescence-like Growth Suppression. Cancer Cell, 29(1), 75–89. http://doi.org/10.1016/j.ccell.2015.11.011
Heidorn, S. J., Milagre, C., Whittaker, S., Nourry, A., Niculescu-Duvas, I., Dhomen, N., et al. (2010). Kinase-dead BRAF and oncogenic RAS cooperate to drive tumor progression through CRAF. Cell, 140(2), 209–221.
http://doi.org/10.1016/j.cell.2009.12.040
Hsin, I.-L., Sheu, G.-T., Jan, M.-S., Sun, H.-L., Wu, T.-C., Chiu, L.-Y., et al. (2012). Inhibition of lysosome degradation on autophagosome formation and responses to GMI, an immunomodulatory protein from Ganoderma microsporum. British Journal of Pharmacology, 167(6), 1287–1300.
http://doi.org/10.1111/j.1476-5381.2012.02073.x
Jones, S., Zhang, X., Parsons, D. W., Lin, J. C.-H., Leary, R. J., Angenendt, P., et al. (2008). Core signaling pathways in human pancreatic cancers revealed by global genomic analyses. Science (New York, N.Y.), 321(5897), 1801–1806.
http://doi.org/10.1126/science.1164368
Kim, J., Kundu, M., Viollet, B., & Guan, K.-L. (2011). AMPK and mTOR regulate
autophagy through direct phosphorylation of Ulk1. Nature Cell Biology, 13(2), 132– 141. http://doi.org/10.1038/ncb2152
Mancias, J. D., & Kimmelman, A. C. (2011). Targeting autophagy addiction in cancer. Oncotarget, 2(12), 1302–1306. http://doi.org/10.18632/oncotarget.384
Discovery of a novel ERK inhibitor with activity in models of acquired resistance to BRAF and MEK inhibitors. Cancer Discovery, 3(7), 742–750.
http://doi.org/10.1158/2159-8290.CD-13-0070
Papke, B., & Der, C. J. (2017). Drugging RAS: Know the enemy. Science (New York, N.Y.), 355(6330), 1158–1163. http://doi.org/10.1126/science.aam7622
Petherick, K. J., Conway, O. J. L., Mpamhanga, C., Osborne, S. A., Kamal, A., Saxty, B., & Ganley, I. G. (2015). Pharmacological inhibition of ULK1 kinase blocks mammalian target of rapamycin (mTOR)-dependent autophagy. The Journal of Biological Chemistry, 290(48), 28726–28726.
http://doi.org/10.1074/jbc.A114.627778
Rabinowitz, J. D., & White, E. (2010). Autophagy and metabolism. Science (New York, N.Y.), 330(6009), 1344–1348. http://doi.org/10.1126/science.1193497
Rahib, L., Smith, B. D., Aizenberg, R., Rosenzweig, A. B., Fleshman, J. M., & Matrisian, L. M. (2014). Projecting cancer incidence and deaths to 2030: the unexpected burden of thyroid, liver, and pancreas cancers in the United States. Cancer Research, 74(11), 2913–2921. http://doi.org/10.1158/0008-5472.CAN-14-0155 Rainsford, K. D., Parke, A. L., Clifford-Rashotte, M., & Kean, W. F. (2015). Therapy and
pharmacological properties of hydroxychloroquine and chloroquine in treatment of systemic lupus erythematosus, rheumatoid arthritis and related diseases.
Inflammopharmacology, 23(5), 231–269. http://doi.org/10.1007/s10787-015-0239-y Rosenfeldt, M. T., O'Prey, J., Morton, J. P., Nixon, C., MacKay, G., Mrowinska, A., et al.
(2013). p53 status determines the role of autophagy in pancreatic tumour development. Nature, 504(7479), 296–300. http://doi.org/10.1038/nature12865 Ryan, M. B., Der, C. J., Wang-Gillam, A., & Cox, A. D. (2015). Targeting RAS-mutant
cancers: is ERK the key? Trends in Cancer, 1(3), 183–198. http://doi.org/10.1016/j.trecan.2015.10.001
Samatar, A. A., & Poulikakos, P. I. (2014). Targeting RAS-ERK signalling in cancer: promises and challenges. Nature Reviews. Drug Discovery, 13(12), 928–942. http://doi.org/10.1038/nrd4281
Scheffzek, K., Ahmadian, M. R., Kabsch, W., Wiesmüller, L., Lautwein, A., Schmitz, F., & Wittinghofer, A. (1997). The Ras-RasGAP complex: structural basis for GTPase activation and its loss in oncogenic Ras mutants. Science (New York, N.Y.), 277(5324), 333–338.
Scheidig, A. J., Burmester, C., & Goody, R. S. (1999). The pre-hydrolysis state of p21(ras) in complex with GTP: new insights into the role of water molecules in the GTP hydrolysis reaction of ras-like proteins. Structure (London, England : 1993), 7(11), 1311–1324.
Siegel, R. L., Miller, K. D., & Jemal, A. (2017). Cancer Statistics, 2017. CA: a Cancer Journal for Clinicians, 67(1), 7–30. http://doi.org/10.3322/caac.21387
Tanaka, T., & Rabbitts, T. H. (2010). Interfering with RAS-effector protein interactions prevent RAS-dependent tumour initiation and causes stop-start control of cancer growth. Oncogene, 29(45), 6064–6070. http://doi.org/10.1038/onc.2010.346
Yang, A., Rajeshkumar, N. V., Wang, X., Yabuuchi, S., Alexander, B. M., Chu, G. C., et al. (2014). Autophagy is critical for pancreatic tumor growth and progression in tumors with p53 alterations. Cancer Discovery, 4(8), 905–913.
http://doi.org/10.1158/2159-8290.CD-14-0362