IMPROVING INDOOR AIR QUALITY IN SCHOOLS TO CONTROL AND PREVENT ASTHMA IN SCHOOL-AGED CHILDREN
By:
Gail R. Meyers RN, BSN November 3, 2009
A Master’s paper submitted to the faculty of the University of North Carolina at Chapel Hill in partial fulfillment of the requirements for the degree of Master of Public Health in the School of Public Health, Public Health Leadership Program.
Approved by:
____________________________________
Abstract Introduction:
Asthma, a potentially fatal chronic disease, is a growing, costly, health problem for employers, insurers and families of children living in the United States. Some states, local governments and school districts have laws in place that protect children from the use of toxic chemical cleaners and pesticides that are known to increase the risk of developing asthma due to volatile organic compound exposure (VOC). Pathophysiologically, this occurs by the chemical scarring of normal healthy lung tissue when exposed to the inhalation of toxic fumes from volatile organic compounds. This reduces air and oxygen exchange at the cellular level of the aveoli and capillaries due to the lung tissue damage. Fumes from toxic chemicals are known to adversely affect air quality in the schools by the release of these VOC’s. The government needs to take action and adopt new laws protecting children from toxins in the environments in which they live and learn. Utilizing Green Cleaning options, instead of chemical products containing high levels of VOC’s to clean schools and homes, is a safer, healthier method of cleaning which prevents triggering asthmatic episodes and additionally protects children from future lung damage. Advocating for local, state or federal laws requiring the use of green, asthma friendly cleaners and pesticides in schools is an important preventative public health intervention policy. Legislators in many states have already recognized the benefits of passing the legislation
necessary to protect children from toxic chemicals in their school environment and thereby improving indoor air quality.
What is Asthma?
breathing. Genetics is one factor, as allergies due to asthmagens can cause an attack in any person with a predisposition to asthma, even if the person did not have the disease prior to exposure (Inform, 2008). The genetic trait, CD14 single neuclotide (SNP) C-159T and exposure to an endotoxin, which is a bacterial product, are a well-replicated example of a
gene-environment interaction that is associated with asthma. Endotoxin exposure varies from person to person and identified sources such as environmental tobacco smoke, dogs, and farms. Researchers have found that risk for asthma changes based on a person’s genotype at CD14 C-159T, age and level of endotoxin exposure (Martinez, F.D., 2007).
There are two types of asthma, allergic asthma and irritant asthma. Allergic asthma occurs after the immune system is sensitized to environmental allergens. Sensitization occurs on a first exposure to an asthma trigger. The second and subsequent exposures after sensitization, then initiate a hyperactive immune system response causing an asthma attack in the individual. Irritant asthma does not involve the immune system; irritants such as chemicals, mold, and cleaning products found in the environment trigger the asthma attack (Women’s Voices for the Earth, 2007).
Wheezing
Chest tightening
Shortness of breath
Cough.
Asthma triggers are found both indoors and outdoors, and irritate both the lungs, and the mucosal linings of the eyes, ears, mouth, throat, bronchi, bronchioles and skin. See Appendix 1, which compares healthy lung anatomy with asthmatic lung anatomy. The diagram clearly demonstrates the constriction of the airway by swollen mucous membranes secreting large amounts of mucous, further blocking the bronchi and bronchioles.
Persons with asthma that have constant exposure to asthmagens in their environment are greatly impacted by Indoor Air Quality issues. In a recent survey, 75 percent of U.S. households used at least one pesticide product indoors during the past year. The most common pesticides used were insecticides and disinfectants. A study suggested 80 percent of the exposure to pesticides occurs indoors with preliminary research showing widespread presence of pesticide residuals in homes. Linguistically, by its very nature, the “cide”, in pesticides means, to kill (Environmental Protection Agency, 2008). One little known fact is that anti-bacterial soaps utilize pesticides like triclosan or triclocarban to kill germs. In using these soaps during hygienic hand-washing, to reduce communicable diseases, we receive a dose of pesticides in the process. There is no proven benefit in using an antibacterial soap and evidence suggests it could even be detrimental and cause bacterial resistance (Environmental Protection Agency, 2002). Remember, benefits are further reduced as antibacterial soaps do not kill viruses, only bacteria.
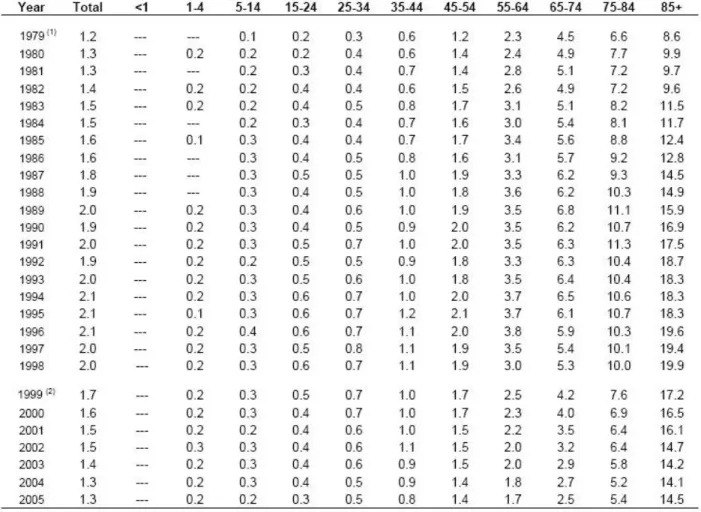
Beginning in the 1980’s, asthma rates in the United States skyrocketed to epidemic levels, particularly in young children. See Appendices 3-7 for data reported on mortality by age,
prevalence by ethnic origin, rate of distribution by sex, age, ethnic origin and geographic region. One-third of the people diagnosed with asthma in the US in 2006 were children under the age of 18. Of those 6.8 million children, 4.1 million had an asthma attack that year. Asthma is the number one cause of chronic health conditions and school absenteeism in children. The
Image from http://www.epa.gov/indicators/roe/html/roeHealthSt2.htm.
Nearly 1 in 8 school-aged children are diagnosed asthmatic, with a higher incidence in the pre-school populations (Center for Disease Control, 2005). Children spend an average of 6-7 hours per day and 180 days a year in the school environment. Asthma is the third-ranking cause of hospitalization among children younger than 18 years of age and the number of children dying of asthma increased almost threefold from 1979 to 1996. In Appendix 8, general asthma
hospitalization rates from 1988 to 2006 are published by race. Most importantly, the African American population is significantly impacted by the severity of asthmatic episodes requiring hospitalization (National Center for Health Statistics, 2006). This is the same minority
population living in substandard housing in urban areas and attending urban schools.
more pesticides and toxic chemicals as compared to body weight (National Research
Council/National Academy of Sciences, 1993). Their increased respiratory rate and intake of a greater volume of air per unit of body weight than adults also contributes to increased pesticide intake (Solomon, Kirsch & Ogunseitan, 2000). Children are more susceptible and at higher risk, because their organs are still developing and their liver and kidneys are less able to detoxify inhaled hazardous chemicals (Environmental Protection Agency, 1996). Human lungs and airways do not fully develop till the sixth to eighth year of life. Likewise their kidneys and liver have not yet reached maturity to filter toxins from the blood at the same level as adult organs (Burri, P.H.,1997).
Early life is a crucial time for the development of all bodily functions and organs, including the immune and respiratory systems. Data from studies have suggested that the early childhood exposure toxic chemicals, can increase the asthma risk by age 5, and exposures during the first year of life will have the greatest impact on childhood asthma occurrence and
persistence in school-aged children (Salam, Li, Langholz & Gilliland, 2004). Asthma and Disparities
children (Safer Pest Control Project, 2008). Asthma healthcare disparities enormously impact children’s school health and learning capabilities, by increasing their absenteeism from the classroom. Another disparity study done in New York of 5,250 children (76.9% responders) discovered an asthma rate of 13.0% with 47.3% diagnosed by health professional. Causasion children were more likely to have an allergy diagnosis and a history of allergy testing done, while African-American children were 40% less likely to be physician diagnosed. Fifty-five percent of the children had undergone allergy testing while children with publicly funded health insurance were least likely to have been allergy tested with the odds ratio 0.502 for Medicaid enrollees and 0.306 for state insurance enrollees. Only 40% of all the families of children tested were provided asthma education regardless of race or ethnic origin. Asthma education and awareness is an essential element in the treatment and control of chronic asthma. However the lack of this education is a quality improvement issue inherent in the United States healthcare system, not a disparities issue. Therefore, children without private insurance were less likely to be tested, diagnosed, educated and treated than children with private insurance. Allergy testing is essential in tailoring effective allergy and asthma care (Stingone, J.A., 2007). Appendices 4-6 have current data about the impact of race and ethnic origin in asthma prevalence, distribution and asthma attack rates. Lifetime prevalence is defined as having ever been diagnosed with asthma, while current prevalence means currently have asthma. Attack prevalence means having had an asthma attack or occurrence in the last 12 months. The data suggests not only has asthma prevalence increased over time, but the highest prevalence occurs in the African American and Hispanic populations (Center for Disease Control and Prevention, 2007)
How does chemical and pesticide exposure affect children?
processes used to keep indoor environments clean may also contribute to indoor pollution and health problems for building occupants. Inhalable VOC emissions from cleaning products and application processes are a primary cause of concern (Air Quality Sciences, 2008). Appendix 2 lists the most common cleaning products and their VOC dispersement in indoor air environments. The number of the most prevalent indoor air constituents found in offices, schools and homes, are as many as 100 to 1000 different VOC’s, all present in an easily inhalable form. Side effects of VOC’s include: eye, nose and throat irritation; cough; headache; general flu-like symptoms; skin irritations, lung irritations and cancers. Some have irritating odors, which are also known to trigger asthma attacks (Air Quality Sciences, 2008) (Women’s Voices for the Earth, 2007). Cleaning chemicals are also known to interfere with children’s neurological, endocrine and immune systems as reported by the American Association of Poison Control Centers. Cleaning products are the third largest category for poisoning and are associated with persistent wheezing among pre-school children and increased the likelihood of asthma among all children. This was also found to be true about institutional cleaning products used in schools as well as specialized fragrance ingredients added market the products (Women Voices for the Earth, 2007).
Within the short period of two hours of a cleaning process, the total volatile organic compound environmental levels can increase from 40 micrograms/cubic meter to 25,000 micrograms/cubic meter. The acceptable value for volatile organic compound emissions from any cleaning product is only 500 micrograms/cubic meter. This is the standard set by the
Greenguard Environmental Institute which is a third party certification program for establishing standards for low-emitting VOC products in indoor environments (Air Quality Sciences, 2008)
National Academies in an interim report, Review and Assessment of the Health and Productivity of Green Schools, 2006, concluded after more than 20 years of monitoring conditions in schools as part of its review and assessment of the health and productivity benefits of green schools, that there is a growing body of evidence that both children and adults are impacted by school air quality. Therefore, 10% or 27.5 million people of the US population, especially the 6 million students with asthma are most at risk (Air Quality Sciences, 2008). Children exposed to total VOC levels of 60 micrograms/cubic meter or more were four times more likely to have asthma than those who were not exposed. 60 micrograms/cubic meter is far less than the Greenguard maximum safety standard threshold of 500 micrograms/cubic meter for indoor air quality. Some epidemiological studies have linked nitrogen dioxide with an increased risk of respiratory symptoms and illnesses (Boseley, S., 2004). A 15-ppb increase in the household annual nitrogen dioxide mean was associated with an increased cumulative incidence of lower respiratory
symptoms. The response variable indicated the report of one or more of the following symptoms: attacks of shortness of breath with wheeze, chronic wheeze, chronic cough, chronic phlegm, or bronchitis. Girls showed a stronger association than did boys in this study (Neas, L.M., Dockery, D.W., Ware,J.H., Spengler, J.D., Speizer, F.E., and Ferris, B.G., 1991).
Chemicals in cleaning products and pesticides can also trigger asthmatic episodes and lung damage in healthy individuals due to the inhalation of the fumes while utilizing the chemical product. Many chemicals have the capability to scar healthy lung tissue when inhaled in closed environments. Indoor Air Quality is being compromised by these products and they are believed to be hazard to the public’s health and quality of life (Air Quality Sciences, 2008). Many schools are now using Green Cleaning Products and Integrated Pest Management programs to provide a safer, healthier alternative toxic chemicals and as a public health prevention intervention.
Why Encourage Green Cleaning?
Cleaning product manufacturer’s are challenged to create products that remove indoor pollutants like dust, viruses, bacteria, particulates, endotoxins, allergens and mold without the use of volatile organic compounds (VOC’s) (Air Quality Sciences, 2008). Green cleaning is about protecting people from dangerous fumes and chemicals that can cause asthma, lung scaring, allergic reactions, numerous skin conditions, and other respiratory diseases (Marshall, 2009). It is a healthy, safe, natural and economical alternative to clean homes and schools without
endangering people, pets or the environment. Green cleaning includes both cleaning and pesticide products.
There are many interesting little known facts about household cleaners:
Of the 17,000 chemicals that appear in common household products, only 30%
have been adequately tested for the effects on our health.
The Federal Food and Drug Administration has not required companies to do
Medical doctors and scientists have studied, analyzed, evaluated and concluded
that there is a definitive connection between our health and the use of everyday common cleaning chemicals.
The Environmental Protection Agency has found that airborne chemical levels in
homes were as much as 70 times higher inside than outside. Indoor air is often two to five times more contaminated than outdoor air. 9 out of 10 breaths are likely drawn indoors. The use of super insulation products, without proper ventilation systems keeps airborne chemical levels high within the home.
15-25% of our population has some type of breathing problems and 15-30%
report multiple chemical sensitivities (Environmental Protection Agency, 2002). Bio-based chemical alternatives are a greener, friendlier alternative to petrochemicals currently used in production and marketing of cleaning products. Because Bio-based alternatives are not yet regulated and no government standards currently exist, there is concern about what alternatives are utilized and their safety. Public education and awareness is necessary to make the correct decisions in choosing green cleaning products. The claim natural does not necessarily mean non-toxic and claims of non-toxic, eco-safe and environmentally friendly are meaningless without the information and standards established by the government or a neutral third party research organization such as Greenguard (Environmental Protection Agency, 2002). Some rules and commonalities do apply when choosing a green cleaning product.
Therefore products that are eco-safe usually include:
Grain alcohol used as a solvent.
Plant-oil disinfectants such as eucalyptus, rosemary or sage used in hand soaps
(Environmental Protection Agency, 2002).
Hydrogen peroxide used as a sanitizer or disinfectant.
Silver ions used to disinfect as antimicrobials.
Ultraviolet light (UV-C) used to sanitize.
Thymol derived from thyme has antiseptic and antifungal qualities.
Vinegar cleans and disinfects and is 100% non-toxic.
Most importantly, remember there is no replacement for good ventilation to improve indoor air quality. It is important to use any aerosolized product in a well ventilated area, regardless of being natural, eco-safe or non-toxic. Natural products or those products that contribute low VOC’s are the best choice to reduce asthma triggers in environments that favor children.
Benefits of a Green Cleaning and Integrated Pest Management program for Schools: Integrated Pest Management is the effective suppression of pest populations while minimizing human health and environmental hazards to the occupants of the structure (State of California, 2009). The Environmental Protection Agency recommends that schools utilize integrated pest management techniques and products to reduce pesticide risk and exposure for school-aged children. Integrated Pest Management is a safer, and usually less costly option for an effective pest management program in a school community. The American Public Health
spray in areas known to house pests instead of treating the entire building with each application cycle. This appears to be a common sense approach and less costly than current policies. However, it is important to note that schools are governed by the state rules and statutes and all pest management programs must be aligned with those standards for school district compliance with policies.
Some steps schools can take to reduce use of pesticides include:
Take time to identify the problem or pest before taking action. These may include mice,
cockroaches and ants.
All vegetation, shrubs and wood mulch must be 1 foot away from structures.
Seal or eliminate all cracks and crevices in walls, floors and pavement.
Clean all food contaminated dishes, utensils and surfaces daily.
Lockers and desks should be cleaned at least twice a year.
Garbage cans and dumpsters cleaned regularly.
Litter is disposed of at least once a week.
Fertilizers applied several times in smaller doses than in one heavy dose. Use pesticides
in spot treatments rather than area-wide applications (Environmental Protection Agency, 2009). For pest management, use safer green products like, Pyrethrin products, which are natural based insecticides derived from the Chrysanthemum flower and are generally considered safe. They are biodegradable, break down with light exposure and are the least toxic to mammals (Picaridin, 2009)
Governor’s Award for Pollution Prevention. Another example of successful integrated pest management in Vista de las Cruces School in California where costs were reduced from $1,740 per year to $270 (plus labor) for two years. In the Kyrene School District,
administrators reduced pesticide applications by 90% while successfully keeping pests in check below 85% of their original levels while using Integrated Pest Management
(Environmental Protection Agency, 2009).
Manufacturers of Cleaning Products Refute Safety Issues:
In the past, manufacturers cite many reasons why there are insufficient data sets available linking chemical cleaning products and pesticides with asthma in school children. Historically, asthma is linked to many environmental irritants and the chemicals in cleaning products and pesticides are not the sole responsible contributor for asthmatic episodes or permanent lung damage in healthy individuals. We know:
Asthma is genetically linked to parental asthma and allergy history, and not solely
environmental factors.
Almost no studies have been conducted in the United States to link asthma with
commercial cleaning products.
Although a significant number of studies have been done on special populations
In 2006 Trillium Asset Management sponsored a shareholder resolution on behalf of the
Dow Corporation, specifically addressed the question: Did Dow pesticides put shareholder value at risk? Dow Chemical is a subsidiary of Chevron-Texaco. The Resolution was to establish an independent panel, controlling for conflict of interest, to publish by May 2007, a report analyzing the extent to which Dow products may cause or exacerbate asthma, and describing a public policy initiative, and Dow policies and activities, to phase out or restrict materials linked with such effects.
In 2006 Dow stated: There is no scientific consensus that pesticides are a significant cause or trigger of asthma. The Environmental Protection Agency, National Institute for Environmental Health Sciences and Center for Disease Control cite a variety of materials, such as dust mites, molds and cockroaches as potentially linked with asthma, but do not lists pesticides among the common causes of triggers of asthma. Chlorpyrifos and 2,4-D, referenced in the proposal, have both undergone recent thorough scientific regulatory reviews by United States and European Union regulatory authorities. Dow supports these pesticides and its other products with a strong product stewardship program. In the United States and many other nations, existing regulatory processes already provide opportunities for public review and comment; these venues would be a more appropriate forum for proponents of this proposal to express their concerns (Bavaria, J., 2006).
the above proposal, Dow continues to deny any level of accountability for asthma problems related to their products.
Green Cleaning and Pesticides Can Be Financially Beneficial to Manufacturers
Environmentally safe cleaning products are good for the health of America’s children as well as good for their manufacturers. Products promoting “green” solutions are now posting double-digit monetary gains for their companies. As America goes green, so do those green dollars follow the green solutions. The chemical companies are joining the “Green Cleaning” bandwagon by producing green products for sale to public and industrial cleaners and continuing research and the collection of data on the effectiveness of green cleaning for anti-microbial and anti-bacterial usage.
developed the shades of green consumer guide for marketing companies. How green are you when you shop for cleaning products and pesticides? (Branna, T., 2008).
Shade of Green Consumer Definition of Consumer Marketablility It Ain’t Easy Being Green Being green is too much to think about
Sheer Green Tulle Consumer buys what they like and green is just a bonus Envy Silk Green Consumer hopes others notice how green they are True Blue Green Consumer that does the right thing for their family Forest Green Consumer advocates leading the green cause
Branna, Tom. Cleaning Products Go Green. Entrepeneur. 12-2008 Past and Present Green Cleaning/Pesticide Legislation:
Presently 16 states have adopted green cleaning standards and President George W. Bush signed a federal Executive Order 13423 calling for a green procurement policy. The order has not been finalized and is currently awaiting action from the Obama administration. This will require more stringent green standards than current laws in place (Branna, T., 2008).
The Federal government requires “environmentally preferred” cleaning products in their buildings. New York and Illinois have laws requiring green cleaning in their schools. California, Connecticut, Maine, Massachusetts, Minnesota, New Jersey, New York, Ohio, Oregon,
Standards for Manufacturing of Green Products
As no definition of green exists, one suggestion by David Long, a consultant to the American Chemical Society was that they adopt the 12 principles of Green Chemistry by Anastas and Warner.
The 12 Principles are:
1. Prevent waste: Design chemical syntheses to prevent waste, leaving no waste to treat or clean up. 2. Design safer chemicals and products: Design chemical products to be fully effective, yet have little or no
toxicity.
3. Design less hazardous chemical syntheses: Design syntheses to use and generate substances with little or no toxicity to humans and the environment.
4. Use renewable feedstocks: Use raw materials and feedstocks that are renewable rather than depleting. Renewable feedstocks are often made from agricultural products or are the wastes of other processes; depleting feedstocks are made from fossil fuels (petroleum, natural gas, or coal) or are mined.
5. Use catalysts, not stoichiometric reagents; Minimize waste by using catalytic reactions. Catalysts are used in small amounts and can carry out a single reaction many times. They are preferable to stoichiometric reagents, which are used in excess and work only once.
6. Avoid chemical derivatives: Avoid using blocking or protecting groups or any temporary modifications if possible. Derivatives use additional reagents and generate waste.
7. Maximize atom economy: Design syntheses so that the final product contains the maximum proportion of the starting materials. There should be few, if any wasted atoms.
8. Use safer solvents and reaction conditions: Avoid using solvents, separation agents, or other auxiliary chemicals. If these chemicals are necessary, use innocuous chemicals.
9. Increase energy efficiency: run chemical reactions at ambient temperature and pressure whenever possible. 10. Design chemicals and products to degrade after use: Design chemical products to break down to innocuous
11. Analyze in real time to prevent pollution: Include in-process real-time monitoring and control during syntheses to minimize or eliminate the formation of byproducts.
12. Minimize the potential for accidents: Design chemicals and their forms to minimize the potential for chemical accidents including explosions, fires and releases to the environment.
Green Chemistry: Theory and Practice. Paul Anastas and John Warner. 1998
Another standard to be defined is “natural”. One definition is a substance or chemical that is produced or exists in nature. Natural label products are those products that use natural
materials to produce a product that would not appear without human intervention or those made from natural ingredients existing with human intervention (Air Quality Sciences, 2007).
Natural and green do not necessarily equate with safe. Some green products may not clean as well as chemical products. Some green cleaners like plant oils can also emit VOC’s when they come into contact with ozone and are then chemically altered to create smog. Two sources to consult when making “greener choices” are the Green Seal Environmental Choice Program and GREENGUARD Environmental Institute. It is important to remember that even if manufacturers decrease short term VOC emissions, if the chemicals continue to release reduced VOC emissions over a longer period of time, the exposure still causes an asthma risk and general health risk for susceptible individuals (Air Quality Sciences, 2007).
Consumers need more advocacy, awareness and education on VOC emissions and “green” cleaning alternatives to make informed choices for product use in their homes. More studies need to be conducted in the United States to assess VOC’s and their impact on asthma and other chronic respiratory diseases in school-aged children.
Conclusions:
most vulnerable due to the immaturity of their lungs, kidneys and livers to detoxify agents present in VOC’s and therefore need to be protected from this chemical contact whenever possible as a public health asthma prevention intervention. The scarring of lung tissue due to inhalation contact is irreparable, irreversible and a life-long chronic health problem for those exposed during the 6-7 hour school day for 9 months of each year.
Those children with a genetic predisposition to asthma or acquired asthma due to contact with asthmagens, are impacted significantly in their ability to control their asthma with
medications if they are continuously exposed to asthma triggers in the environments where they learn and play. They are further predisposed to increased school absenteeism, hospitalizations, with increased morbidity, and mortality especially if they are from a minority cultural
background with known disparities. These children also tend to have less access to regular physician care and medical diagnosis by definitive allergy testing therefore placing them most at risk for asthma morbidity and mortality. Asthma awareness and education may also be impacted by cultural diversity issues, such as, a lack of “green cleaning” educational programs and
materials translated into their native language to facilitate learning for immigrants and refugees. Asthmatic children grow into asthma adults with many of the same issues of a high incidence of asthma noted in Appendix 7 and high rates of hospitalization demonstrated by Appendix 8. These issues affect earning potential and employee productivity in the workplace and ultimately the country’s gross national product. It is in the best interest of all to reduce asthma and keep people with chronic asthma healthy.
The use of “green” cleaning products and pesticides is known to reduce exposure to VOC’s and potentially reduce the incidence of asthma attacks and overall incidence and
school district, as the cost is proven to be within the normal range or less, for cleaning and pesticide products budgeted each year by the school district. Cleaning personnel can be educated regarding the usage of green cleaning, learning to be most effective in utilizing anti-bacterial and bacterialcidal properties of these products. The manufacturers of the toxic chemical cleaning products have now begun to produce safer, green products for both home and industrial usage.
Many states already have recognized the preventative health benefits of green products, and the negative health outcomes of products that emit VOC’s, and have passed legislation requiring the use of green cleaning and pesticide products in schools and government buildings. We need to advocate for a national agenda to define “green” and “natural” in product definitions and require the use of safe cleaning products and pesticides in our schools to protect our
children’s health. A vision of clean air and a mission to promote a safer indoor air quality in our schools by reducing the VOC’s emitted in the classrooms, President Bush issued an executive order during his administration in support of the use of “green” products in all federal agency buildings.
Executive Order 13423-Strengthening Federal Environmental, Energy and Transportation Management.
This Executive Order requires federal agencies to use sustainable environmental practices when acquiring goods and services, including acquisition of bio-based, environmentally preferable, energy-efficient, water-efficient, and recycled-content products.
Given this Executive Order, universal legislation needs to be further drafted specifically for United States schools in all 50 states to protect the children enrolled in daycares, Head Start and Early Childhood programs and United States schools. Whether this is accomplished by another Executive Order, Congress or individual states adhering to consistent universal federal guidelines, immediate action is required on this important public health safety issue.
Bibliography
Air Quality Sciences. (2008).Cleaning Chemicals and Their Impact on Indoor Environments and Health. Accessed 7-6-09 at: www.aqs.com.
Akinbami, L.J. and Schoendorf, K.C. (2002). Trends in Childhood Asthma: Healthcare Utilization and Mortality. Accessed at:
http://www.epa.gov/indicators/roe/html/roeHealthSt2.htm.
American Lung Association. (2008). American Lung Association Disease Data, Accessed on 6- 10-09 at: www.lungusa.org.
Anastas, Paul., Warner, John. (1998). Green Chemistry: Theory and Practice.
Bavaria, Joan.(2006). Proxy Solicitation-Vote Yes for Item No. 5 on Dow Chemical’s 2006 Proxy Ballot. Accessed 11-24-08 at:
http://proxyinformation.com/toxics/dowasthmaproxy.html
Beyond Pesticides, Pesticides and You. Summer 2005. Vol.25 Number 2.
Beyond Pesticides. Asthma, Children and Pesticides, What you should know to protect your family. Accessed January, 2009 at: www.beyondpesticides.org
Branna, Tom. Cleaning Products Go Green. Entrepreneur. 12-08. Reprint from Happi. Accessed at: www.happicom.
Burri, PH. 1997. Postnatal development and growth. The Lung: Scientific Foundations, vol 1. (Crystal RG, West JB, Webel ER, Barnes PF, eds) Philadelphia, PA: Lippencott-Raven Publishers, 1013-1026.
Centers for Disease Control and Prevention, March 2005. Summary Health Statistics for U.S. Children: National Health Interview Survey, 2003. Vital and health Statistics 10 (223) Centers for Disease Control and Prevention, National Center for Environmental Health August
2005. Asthma’s Impact on Children and Adolescents. (Accessed August 2005) at:
http://www.cdc.gov/asthma/children.htm
Center for Disease Control and Prevention. National Center for Health Statistics. National Health Interview Survey 1998-2007. Analyzed by the American Lung Association Research and Program Services Division. 2007.
Early Childhood Origins of Asthma. 1999. Journal of Clinical Investigation. 104:7 p.837-843. Environmental Health Perspectives. May 2005.
Environmental Protection Agency: An Introduction to Indoor Air Quality. November 25, 2008. Accessed 12-3-08: http://www.epa.gov/iaq/pesticid.html
Environmental Protection Agency: Cleaning Products. 2002. Accessed 11-25-08 at:
http://www.cleaningpro.com
http://www.epa.gov/epp/pubs/guidance/executiveorders.htm.
Environmental Protection Agency:. Integrated Pest Management in Schools. Updated 2-23-09. Accessed 10-12-09 at: http://www.epa.gov/pesticides/ipm/
Hicks, J. Darrel REH. Infection Control for Dummies. Accessed 9-4-08 at:
http://www.housekeepingchannel.com/a_721-Green_Disinfection_Is_It_Possible Inform. 2008. Cleaning for School Health: Asthmagens in Institutional Cleaning Products.
www.inforinc.org.
Marshall, John. 2009. Going, Going, Green! A Practical Guide for Green Cleaning Your Home. Accessed at: www.completegreencleaning.com.
Martinez FD. 2007. CD14, endotoxin, and asthma risk: actions and interactions. Proc Am Thorac Soc 4 (3): 221–5.
National Center for Health Statistics. 2006. National Hospital Discharge Survey 1988-2006. National Research Council, National Academy of Sciences. 1993. Pesticides in the Diets of
Infants and children, Washington, DC; National Academy Press, 184-185.
Neas, L.M., Dockery, D.W., Ware, J.H., Spengler, J.D., Speizer, F.E., Ferris, B.G. 1991. Association of indoor nitrogen dioxide with respiratory symptoms and pulmonary function in children. Department of Epidemiology, Harvard School of Public Health, Boston, MA 02115. American Journal of Epidemiology 1991:July 15: 134 (2):204-219.
Nichols, SW, Jean-Louis, B. Ortiz, B. et al. 2005. Addressing the Childhood Asthma Crisis in Harlem: The Harlem children’s Zone Asthma Initiative. American Journal of Public Health 95 (2): 245-249.
factors for asthma: findings from the children’s health study. Environmental Health Perspectives 112 (6): 760-765.
Solomon, G., Kirsch, J. and Ogunseitan, O.A., 2000. Pesticides and Human Health: A Resource for Health Care Professionals. Washington, DC: Physicians for Social Responsibility and Californians for Pesticide Reform.
State of California. Integrated Pest Management. Updated 10-12-09. Accessed 10-12-09 at: http://apps.cdpr.ca.gov/schoolimp.
Stingone, Jeanette A. MPH. 2007. Allergies Are Under-Diagnosed, Under-Managed in Urban Children with Asthma. [Presentation Title: The Role of Allergy Treatment in
Asthma Management among Urban Children. Abstract 293] Accessed 1-4-09 at:
http://www.docguide.com/news/content.nsf/NewsPrint/852571020057CCF68525729200
70
The President. Executive Order 13423-Strengthening Federal Environmental, Energy, and Transportation Management. Federal Register, 2007. Vol.72, No. 17, Title 3. signed on January 26, 2007.
US EPA, office of the Administrator. September 1996. Environmental Health Threats to Children. Washington, DC: 175-F-96-001
Appendice 1
Healthy Lung Anatomy
(http://www.amersol.edu.pe/class09/_09tgupta/7th/science/Body%20Systems/RESPIRATORY
-SYSTEM.html)
Asthma Lung Anatomy
Appendix 2
Common VOC’s in Indoor Environments.
VOC Types/Use of Products
1,4 DCB (dichlorobenzene) Mothballs/ room deodorizers, toilet bowl blocks
1,4 diaxane Spot removers
Acetaldehyde Fragrance/disinfectants
Acetic Acid esters Surface cleaners
Acetone Surface cleaners/stain removers
Aldehydes Air fresheners
Alkyl phenol ethoxylates, including non-ethoxylates and octylphenal ethoxylates
Laundry detergents/stain removers/all purpose
cleaners/floor care products/carpet cleaners/non-chlorine sanitizers/toilet bowl cleaners/deodorizers
Ammonia Window cleaners
Ammonium hydroxide Powdered Windex cleaner
Ammonium Quaternary Compounds Disinfectant sprays and toilet cleaners Butoxyethanol Surface cleaners/window cleaners Butyl Acetate Surface cleaners/fragrances C6-C10 substituted Alkanes All cleaners/polishers/waxes
Dichlorobenzene Deodorizers
Dimethylbenzene (xylene) Stainless steel cleaners
Dioxin Disinfectants (Lysol)
Dipropylene glycol Surface cleaners
Formaldehyde Biocides/air fresheners/fabric softeners Glycol Ethers ie. 2-butoxyethanol Glass cleaners/all purpose spray cleaners Hydrochloric Acid Toilet bowl cleaners
Isobutane Aerosol cleaners
Isobutene Aerosol cleaners
Ispropanol Disinfectants
Limonene Orange fragrance
Lye (powdered) (caustic soda) Drain cleaners/oven cleaners/grout and tile cleaners
Methoxyethanol Surface cleaners
Methoxyethoxyl Ethanol Surface cleaners Methyl Methacrylate Hard surface cleaners Methyl Chloride Stainless steel cleaners
Monoethanolamine (MEA) Laundry detergents/all purpose cleaners/floor cleaners
Naphthalene Disinfectants/moth repellants
Petroleum distillates Metal polishes
Phenol Disinfectants/Mold and mildew cleaners
Phthalates Fragrance in glass cleaners/deodorizers/laundry detergents/fabric softeners
Pinene Pine fragrance
Potassium hydroxide Drain cleaners
Propylene Glycol Surface cleaners/aerosols
Pyrethrins Lice cleaning products/lice shampoos
Siloxanes Waxes/polishes
Sodium carbonate Laundry detergents/institutional bathroom cleanser Sodium dodecyl benzene sulfonate Laundry detergents/metal polishes
Sodium hydroxide Drain cleaners/oven cleaners Sodium hypochlorite Mold and mildew cleaners/bleach
Sodium silicate Laundry detergents
Sodium sulfate Laundry detergents
Sulfuric acid Drain cleaners
Tetrachloroethylene Dry cleaners
Toulene (Methylbenzene) Laundry starch sprays Trichloroethylene Degreasers/spot removers Triclosan/Triclocarban Antibacterial soaps
Xylene Air Fresheners/stainless steel cleaners
Air Quality Sciences, Inc., 2008. www.aqs.com and Women’s Voices for the Earth,
Household Hazards: Potential Hazards of Home Cleaning Products. Accessed 12-8-08 at:
www.womenandenvironment.org. Environmental Protection Agency, 2002.
www.cleaningpro.com. Toxic Exposure. Accessed 12-08-08
Appendix 3
Table 5: Asthma-Mortality Rate per 100,000 population, by 10-Year Age Groups 1979-1998,1999-2005
Year Total <1 1-4 5-14 15-24 25-34 35-44 45-54 55-64 65-74 75-84 85+
1979111 1.2
1980 1.3
1981 1.3
1982 1.4
1983 1.5
1984 1.5
1985 1.6
1986 1.6
1987 1.8
1988 1.9
1989 2.0
1990 1.9
1991 2.0
1992 1.9
1993 2.0
1994 2.1
1995 2.1
1996 2.1
1997 2.0
1998 2.0
1999121 1.7
2000 1.6
2001 1.5
2002 1.5
2003 1.4
2004 1.3
2005 1.3
0.2
0.2 0.2
0.1
0.2 0.2 0.2 0.2 0.2 0.2 0.1
0.2 0.2 0.2 0.2 0.2 0.2 0.3 0.2 0.2 0.2
0.1
0.2 0.2 0.2 0.2 0.2 0.3 0.3 0.3 0.3 0.3 0.3 0.3 0.2 0.3 0.3 0.3 0.4 0.3 0.3 0.3 0.3 0.2 0.3 0.3 0.3 0.2
0.2 0.2 0.3 0.4 0.4 0.3 0.4 0.4 0.5 0.4 0.4 0.4 0.5 0.5 0.5 0.6
0.6
0.6
0.5 0.6
0.5 0.4 0.4 0.4 0.4 0.4 0.3
0.3 0.4 0.4 0.4 0.5 0.4 0.4 0.5 0.5 0.5 0.6
0.5 0.7 0.5 0.6
0.7 0.7 0.7 0.8
0.7
0.7 0.7 0.6 0.6 0.6 0.5 0.5 0.6 0.6 0.7 0.6 0.8
0.7 0.7 0.8 1.0
1.0
1.0 0.9
1.0 0.9
1.0 1.0 1.2 1.1 1.1 1.1 1.0 1.0 1.0 1.1
0.9 0.9 0.8
1.2 1.4 1.4 1.5
1.7
1.6
1.7
1.6
1.9 1.8
1.9 2.0 2.0 1.8
1.8
2.0 2.1
2.0 1.9 1.9
1.7
1.7
1.5 1.5 1.5
1.4
1.4
2.3 2.4 2.8
2.6
3.1
3.0 3.4 3.1
3.3 3.6
3.5 3.5 3.5 3.3 3.5 3.7 3.7 3.8
3.5 3.0
2.5 2.3 2.2 2.0 2.0 1.8 1.7 4.5 4.9 5.1 4.9 5.1 5.4 5.6 5.7 6.2 6.2 6.8 6.2 6.3 6.3 6.4 6.5 6.1 5.9 5.4 5.3
4.2 4.0 3.5 3.2 2.9 2.7 2.5 6.6 7.7 7.2 7.2 8.2 8.1 8.8 9.2 9.3
10.3
11.1
10.7
11.3
10.4
10.4
10.6
10.7
10.3
10.1
10.0
7.6
6.9 6.4 6.4
5.8 5.2 5.4 8.6 9.9 9.7 9.6 11.5
11.7 12.4
12.8
14.5
14.9 15.9 16.9 17.5 18.7 18.3 18.3 18.3 19.6 19.4 19.9
17.2 16.5 16.1 14.7 14.2
14.1
14.5
Source: Centers for Disease Control and Prevention. National Center for Health Statistics. National Vital Statistics Reports.
Deaths: Final Data for 1979-2005.
Notes:
(1) Deaths from 1979-1998 are coded by the 9th revision of International Classification of Diseases, 493.
Appendix 4
Tatk It; !\6.thn'·:J Hurnter of Condition~ <lnd Pr9"1.lknc& R.lt110 per 1.0<•() ~t;1;r;loo lit• Ct1lnlc Origin, ·l$$0 2C(I7 Hi~~11K!
N11m!i<'r fit~::. Ci ~v Alii~····
,.,~u u~-, w1 !.!:..r me '!.5:·1 z:t: so.::
*'~.&.l').t.J
ifJ.6 ~u; J~OO 2'.71:0~<8:- ~· :• j1.(,.4$~.1J
)~!1':1 .'v.".:-:-n:. :14" (MI~l';)~ 1~111 '!.':.f.t.'/.!.!1 u~.t! ''~·'""' :; ;)+111!'1 :\,-';,;. :""- ~~ ~ j7.}&'J~ :<J 1~114 '.1.4'X1:!o$ !.14.'! ll l.otLl'1.11)
2~06 3.8B~ ~· .~ in•HMJ J~06 4.~~ :"10 "~.E (¢.:,$-1)$,,;
<WtH ·l,tl:HH~ UU."$ jl4.J !JI :l:l
t.'I'N'o'CI'I! i'U,'itH..'>CC )01
J~O':I 2'.0:•1 ~· st.E i~~ .. ~S2' ,;;
l!~lll! '.r~-==~~ ~11.11 11:·.~ :•:' ;;;
)~Ill >,1~,;. :"1(+ 'iS.~ i·~~·~~ .;J 1~114 '!.1:t .. ';U.• :.:u ;4!J,::'.)'J.t.J ;)+111!> '1ft':-:-~ !I;)' i;..A ?-<t•;,•.; 1~11" '!,,'fo!, Y.lr !;'.!.II ~~l'.otL"!I,II)
2~01 to:~:o~s: au ie~'.6 n iJ
',11110:.' '.ll.i.t! !.'l.:l.'.!li,!J
· ,O!H2! 31.1 iJ".2 $i.iJ
.OH !.X• ~2.1 j;-;>,;r.~S.1J 4!~111 ',\<:·1 :!!Jl "$1.1 1•'~'.:! ~!1".1.;
>~!IJ ,n•.1 IlK• .llll! F'' .P4 <~J 1~11'J 1,'.111 I.'U$ 'J~.'i l;tl',t;.',!'J,!)
''111• • ~-:-171'. ~n ~ p;
"
""
""lit
1~110:. '.~....:114 '.ll.i,., 1.t:•. •-~:1.!))~fiG. .IY~47'; .l~ ~ j,;-:o ~41 7J
l!~llo' • ,Ulr :IJ. ,II.~ 1.;:.:.~ ::..4;
IJ~·n Hitpa:1i-.: Wlli!11 Ntimn~· n.~:- C,! ,_..· R.,.!l:
'*
't!JP.Il,':IJ:I y, ~ il':totL!Ot •• n
'7,$lS,7~S 91.1 i'87.f 9!.1: ·<;.?~~.21'- 1C·:-.:! ,-,$._C.:'~.~· n ,fo"'>,f.1<7 11,;. \ ()'1C 7-~0:N'1J
:.:t,IJ:O'J,'.!l!.l 111.! (l:l'.i.4-~K."J
XI,~';\\"!•'> 1(.: I) ,.,'I,'J.t(M I}
:.'Q.':I~:.:.t~:~ 1c.· ... : rl:lf.'i.~1~·.n :!2.~:!8,6Co$ II?,S (l,&.f! .'U)
H.HMU 111,t t)'1'1'.,.~~J.1'1
:!2.~HI.~~l 1'1.( (I:IIUI ::.V.:.Q
•4.~)3,(/~i "!.:. ~ ,7'::. .. ;.7~.1,+ .... :0').~~- t~,) +'lll~·"·') ·.\~ .. ,v;~' f(\~ ,-s!;s.:o•t>.J '.!,..:i:O~l.: .'~~ (/'),!,•./!.1)
·s.~:~~~~t\ :o.:;' +'7<1 t.:o.~ ,~1
•:.:,!J~.<l·n :..;~ uo;.t.u1.-,+ ·s.c•::).OI:: :.::.2 m~ :e.~:
t:.;u,v· . .: ·u;J
7.~noss 3:..~
:r,H4,H~ "'' ~ ,'JS.$-J~.~,+
~.~:1' ,(~) <1::0.:1 ,·•,'!.;; <!C,(,~•
1!,4"1' ~"i~' 4;-.:; {4C~·4!: J)
.r A~:..s· . .: 'J',. +':1'-~·-~.l'J
e,n,.~~~•
"'
1
.~s~ . .~.~,_.t!..,lJ:O,',!t!',; ..&J J ();l,t;~.Q
tklu Hi11s.~.oui~: Bla~k
NtJmb:..' n..,,.,. C1 <J.r ,;;l!k• "'
.:..t~:..;:.,, 1:.:.:..., ,,~<0.1-':l'.tll
3:1~1.1t~ ID!.t i?M H2i,l
),~(),4~1 1· S.E itO:".~~-•:..: $1 4)~:; ,;. 1)!'.) j1~61-U.~ (,1
.:.,r:\i,'.!~~ n:.' JJ~:-•~l'<!,!
4/"'· " ' 1)!'1:0: jl!!l:~-!.1!1 1,1
.:..r::.:'it n:z,., 1J22.1·•~:tll
1.~c1.1t? na.1 o~.e-•1e: ·:.'
s.cu.u~ us., it':J.~~-•4: ~~
),t!lll,ll~~ ·~::.~ (.' '"·~ f•;:.o~;
2'.'iB,OE1 U..2
:J,U',IIt:: \1).1
:\),.,),'~~. ~)F. '.I;!'.:O.'~C \IJ.,'i
i'a\i•tl1.7,o .~.w »s.o .r~"!,;.');r 'J ot"U'MI!l..;.' ~/1~,!\~tl' :l!'l :0: j,U 1-tt-.1 0:,1 '.1.4~:J.t!l~ \1'.1.'. o'IJ/.~'-'J!l.:t,o M€8,Z4t tDM m.e-:c: 1.1
'.(4~.11'!'. '11).1
· .~~8. · " -1S.t
• .EC· ,-'<;;, <>O.E
. ,t·lf.~t!..: ~1.~
. ,l'~'i,/~; M> I
. ,;.r.· .4~; .:~.~ '.~··~.111.!·1 "' ,1,;
jJ':\1-:>;).I,i
M.'2 !i0.{1
j4~.i-~.~.·
i~~.' 'J.'JA.'
i~);·.Sf.,)J o'J(;.('.)(i.(O •'.I.? ;.1_') ?j
.. ~~~-14 :OJ o'•!;).'l )/.('
IJvn Hinn•.loio.: O!l .. 111" o'h.''"'"'"r
r,
,
,,.
Ci IJ( R:~,w •'•:r:.:.:U~;
8:'t.*M
11.0 P\1 :1·~'!.2J .::t7 IOJ 5 ~~.9)
I.CSS.?~J -~"!.~ ,'S$.i-~\'i,+ t_;n,r,;.,1 :f'.l1 :SO-tl.;.lj I,':'J,.,t4:. 1\1~~ 1!1::.'1-f.i!.J.
t,r.!l·,"n
l.Ow.l~li
1..1':!,311
AA I :Al< lt·l•:•.l :j 1{,'.!, (t:l ).)',!,!J
1-:~.$ 060 ··' t2:.-r. I.U~IH IC4..: ,•$C.J.t;-l.~:
l,l)o',~U ·~; ';$ +'!1$1.0:1 :0:1 ')J
~lf ~41 ~).7 ('f 'J.i¢:,'))
•'tl,·H~ O::lJ::I 1:.:'! l •IJ.~J !'.1'?<>0!1 ·"')1 (~!";.,~~~,
~;~;J:.Ii :.t.u o.; :..: 1.JJ M:". il'!' .:,):\ 1'''' 'J,7,~4J
l.G:!.l~ll oJ.i.:! t:oi !1·•:./J
9Ct-1:!:! .:.tO NHe-2.-fJ
:u~.\lt.lt
3:'~30-:!
~:.,: (I'! :I·!~.JJ SS.I t2J ~ ·11.2)
4~f ~~.E ~;.,_s (;;; 'J • .:.:-.!'it
-:s~::.-:s11~ :;.us a.;:' ~"V.I!J s..~.q47 "u (.U 1·~:79) 4li,,o':.t! '_,J..:! (:i> 1.4J.JJ
,'!Hf~ N 7 (f~ "1.,:,, 4) :.:;~,o'l)'. • .. ,.,,. ('i'! ;1.4/,(;,1
~.· o;r, .v ... O!! t.~'~' :...i~.IJ:Jl: :,.t,G '!·:•.! :•1'.1, ~'-""'C: C.:!lt>:·!? f~r O_,CU(' (~!10'01 ~!l<!II'"''OCI•U~n. ~IMI~!IOI CCI'IICtfi)l ;.t:·~ftl'o S~..-!~lk~ 1-lllll~/101 H~lllt!lln~e.-,t.e<t.~ $1,[1'11('',', •.')')$..Jo:oO: • ..l.ti~IY.,l~ b\' tile Amtn,.,nl.uiY,I f,uc·:.»l;>f1 Knur.:-11 ~~-... I'I'OOt-'lllti.,....IC~< IJ'YJ<<O!l . . -Ill' ~1'$~-~~~ ~IJ~/\:\11 <~":."'
'1>:~1-:
;:!! ~·.11~ 111.'\111\:U'J,. I'll!! _,J:Illl11t; \','i~t • .-..:>l'tJ tl!~~b< ?i:"~~: r:MIIdt:l'o!'>~ lrtr->"-VJI
;'.!·'-'~ >'oe'l:•fiKe"""'-''rtlJ,t( .u I!M'!~1'1Q ~\'e~· b , ll!o'f \"))I L'l-'~ k-:tH)< bot I! ~eJOJ2' ,,..,..c:s~~~~~~ D'~\')U l\ll11!~\i".·.\..,.,~
:4j ·:11'11\ :11:': r.~vt~i:.~e'·~ tlf!I.-."YII Hr:1:lll\ lnlt:r.'O":A' ~H"'W'l', In l,l:\,, -~~~(lo.~)IIM 1il••~-.. :~rv·nt1; r!(lf'tr,-'l, :'lrJI:J"(mnr. lr, :~ ~rrii,'IVr,r q:oft!l'~-.~ y,~;
.~1m~·.11nn· '"''-'~:.lr.~l:l\t:l'<~l!ll".~o'l i'IUt.t.•.r.n.~··"""'·i': \~l.~.r:rt.t.'\lll~r,~Yf t .1~1\RY ,., .-.~er ~~lt rr<'ll~'<'~.,.,'lnlllttlt\~u ~'Ill ll~YMJt;~ tTqflY ,:.'! ll"'1
Tl1• t•"'lh( r"«'~~ 1; !llt:n!M,lll'!.'r ','i'lU M~ tin .~~IMM i'lfi\II'~NVOr,•tl'ltc'M tr'll'l:?" \TI:¥.~ lr<) F!<Yit'll'll'llfl~ h'N'I'I'Itll'.' .. \tJ:f<ll'::ll !ll'o.1\'PI'I'IlV;It,'.'M1
(l~!l~n;. 'rx,._., I :otJl hr,•,r. '1~_,.,.,.. IOI:<'l 'l~t:1l\ :rM. 'l':lfi."ICot.1 q 11'1':(0:¥;111': !lf .-,,T,Yo"ft,~>--1':~111': rmli'l 111'11>1 1n ~!!!!'? ilb~"k!IV.t llo";M~'IIi:d 1•'1
-:I"U. ... ~ 1 ,-; '.
;S'•.'U.:~To. :.e,-:. ~~· ... o~ ·~O.c4 u or.:•,o,-.:·~·;c~ :) • ~-:.vevo.1 :,'EJ:;.IJ«r ~~ 1:\'0~UIIII'~':?'lt:<W:I ~~~~~ vc-.. . _ O)Cfii!'IO' c..., :I "='-'~Y.:oi"•<;T 2
Appendix 6
Sex
Figure 4: Percentage Distribution of Asthma Attacks by
Sex, Age, Ethnic Origin and Geographic Region, 2007
(
1JMale 4,958,737
39.9%
•
Female 7,484,37460.1%
Age
Asthma
Attacks
12,443,111
Geographic
Region
Non-Hispanic Other 593,070
. - 4.8%
18-44 years 4,133,895
33.2%
South
4,494,401 36.1%
Source: National Center for Health Statistics. National Health Interview Survey, 2007
Note:
< 5 years 923,306
7.4%
(1) Attack prevalence is defined as answering yes to "Have you EVER been told by a doctor or other health professional that you had
Appendix 7
~kl~-:
F
ig
u
r
e 5: Se
l
f-Reported Cu
r
rent Asthma Prevalence
(%)
Among Ad
ul
ts
by
State, 2007
tiJl) .£1.Jlnt.·:~ir~ ·~:=$'" te.' H:r,o:-:·~·; =VER t.e.:t:»ld·nu'.ccr.:c, nu~:-,cult.ct b::l!lb rroXt~ltrh<! '~li !la:l1s:hrut.1' and 'Do •;-:uitll!l<r.'l:
Appendix 8
Fig
u
re
8
:
Asthma
•
First-Listed
Hosp
i
ta
l
Dlscha
rR
e Rates pe
r
1
0,
000
population
by
Race
1988
·2006
·
"
~~
§ 4{l
·
3•
"
0
..
:<(} 0c,
0
0
;.
•
;1}~ ~ 10
0
1 !iiill 1!~~!1 1f{l(l 1!{;1 'l!l!i? 1~ff,\ '1~:;.:. l~i!\~ E-!lf. 1:!17 l!{if.; 1~l:'i!"l m~n ?ffi'l ;a;ro
n
m
?1)14 )01f·~Wt~ 1-l . .ii 13.~ t'·,
'
·
'
12.8 10.2 11.5 10.5 11.6,
c
,
,
e
n
.e.
·
·
o
.
o
'lOA 1o.3 'liJ. I [o)j 1~'1 10) 1'1.1 f4'Sbc{ -19.4 332 3i·.~ a.::.fi 42.8ns
,~.6 42.7 .::1).1Je
.
.
e
.
.,.,,,; '.!'"•"?
s
.
e
.
~Q.9..
~..
,
.
3'5.!) 3~.-3 J3J 27.{)ftrOillcr 36.1 2~.2 i~.e. 22.51 2-3.8 20.1 L'E 0 21.~ 2€·.5 JO.l 2'1.0 ~1.2 ·[0.3 12.2
s.s
JU' 173 IUtl:.o!<:l;,
1 l!~!fro!'!'fll!illllii'\1:.Ht\ IM n:t'l'l~«<ll<ll\rl1iir~ nm~p:;ltl-.J tli~I~IYI!rt=!;r. rlmm:ear:eltt t ..l,~..:tr:<.IMI n:npnlr.t\t~Mft!!~ fl',dlre:r m·;l!;r.~
~~It p~ rOOMI; undt~sil; ;lt-d, par!i:ub1j h lat~ • y?n, Rr !hi> "l'.'IS)r. o:cmp;.-im,s W,\'*"' ra:~s ~he tit boo n.:ad? .. m (,)Uti:--.
?0.1fl
9.8
29.3
6
·'
'1 :tn~ mr .. wnhl?.filK.'dif.;;friv,lrr;,·A1.t~ypuhhh~ ~;,; r.l:l' l;: -'t~t:<.llli: ·t,<. l!i;j;,rolt~ rrp.Wr.n~l.~;d :EC.:U'I-itH•i\ t":<!iy.:;~;t"'f: h~~r.n.;
t<>l~lfk thy ru1 dil':l btu i;u•~N liul'..,.JJ•! bo v~l:ir~;:l fH:fl' ;~ '-'il"f>UHi Ut.; v:.t;•ut.Ji:m. E;~•;l.,;blapiiiJ·.;pulto;•! b ;111 ;;~.h;~t;;•/ .hO>ITJil ;•n•.!;!i.u