KENNETH J. HAUSLE. A Decision Framework to Assist Local Communities in Managing Troublesome Solid Waste. (Under the
Direction of Dr. DEBORAH A. AMARAL)
Certain solid wastes; tires, batteries, etc. present potential health risks if they are improperly managed. A methodology has been implemented for evaluating available options for managing these materials. Landfilling and incineration are the management options focussed upon but the framework can be expanded to more fully include other options such as recycling and banning. Potential human exposures from each option are compared to risk related
health guidelines or standards to determine health risks. A case study evaluates management of polybrominated flame
retardant materials in municipal solid waste in Wilmington, N.C. Aerometric and ground water models are utilized for estimating probability related exposures. The aerometric model is driven by a Gaussian plume model, and the migration of toxic material in ground water is estimated from a two dimensional analytical model sponsored by the Electric Power Research Institute. Exposure ranges in air, water, and food are developed by assigning probabilities to uncertain input parameters such as stack emission rates and landfill
leachate concentrations. The data produced is for illustrative purposes in order to demonstrate the
methodology. Frequency versus concentration plots are generated from which levels of exposure derived from
different management options can be compared and the option which presents the lowest health risk to the community
I would like to thank my advisor, Dr. Deborah Amaral, for her support, insightful comments, and guidance in writing this report. I am also grateful to Richard M. Kamens and Dr. Douglus Crawford-Brown for
their positive criticism and helpful suggestions.
I would like to express my appreciation to the EPA Center for Waste Minimization and Management and Dr. Michael Overcash at North
Section Sub-section Pages Section Pages —---1---————————-.————---— A. Introduction 1-10
B. Method 10-48
-Introduction 10-13
-Exposure/Intake 13-23
-Health Risks 23-29
-Costs 29-48
c. Discussion/Case Study
-Introduction 49-53
-Exposure evaluation 53-70
-Groundwater 53-61
-Air 61-64
-Surface water 64
-Biota 64-70
-Health Impacts 70-77
-Cost Consideration 77-83
D. Conclusions \
E. References
49-83
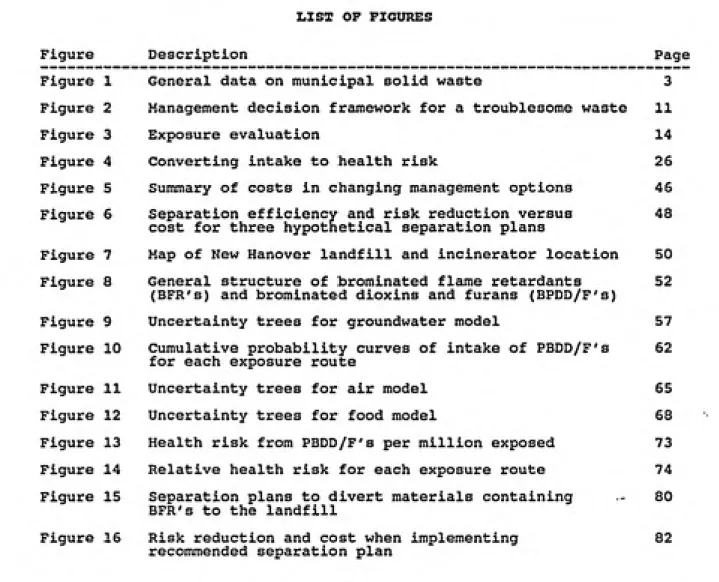
Figure Description Page Figure 1 General data on municipal solid waste 3 Figure 2 Management decision framework for a troublesome waste 11 Figure 3 Exposure evaluation 14 Figure 4 Converting intake to health risk 26 Figure 5 Summary of costs in changing management options 46
Figure 6 Separation efficiency and risk reduction versus 48
cost for three hypothetical separation plans
Figure 7 Map of New Hanover landfill and incinerator location 50 Figure 8 General structure of brominated flame retardants 52
(BFR's) and brominated dioxins and furans (BPDD/F's)
Figure 9 Uncertainty trees for groundwater model 57
Figure 10 Cumulative probability curves of intake of PBDD/F's 62
for each exposure route
Figure 11 Uncertainty trees for air model 65 Figure 12 Uncertainty trees for food model 68 Figure 13 Health risk from PBDD/F's per million exposed 73 Figure 14 Relative health risk for each exposure route 74 Figure 15 Separation plans to divert materials containing - 80
BFR's to the landfill
Table Description Pages Table lA Parameters needed in groundwater modelling 15-17 Table IB Parameters needed in air modelling 17
Table IC Parameters needed for food exposure modelling 17-18
Table 2 Exposures from landfilling and incinerating BFR's 53 Table 3 Populating levels and agricultural activity in a 64
25 km radius around the New Hanover county incinerator
Managing solid waste has become a complex issue for '
local communities. Growing environmental consciousness,
concern for health risks, and rising disposal costs have all increased the attention given to solid waste management.
Local communities are having to make important decisions regarding how to deal with their solid waste. Some
materials, primarily products of modern society such as
certain plastics, tires, and batteries, are particularly
troublesome to manage safely. These materials often do not
readily biodegrade, pose health hazards if improperly
disposed, and are not easily recycled. Local decision makers need a conceptual framework with which to determine the best solid waste management option for troublesome
materials. For the purpose of this paper, management
options will include all methods available to a community to
manage solid waste such as disposal, material and energy recovery, as well as alternatives such as banning particular
materials.
A wide array of information is needed by community
decision makers to make management choices regarding a
troublesome solid waste. This information includes among
other items the quantity of the troublesome waste produced,
the transport properties of the waste or its by-products in
environmental media as it is being managed, the health
costs of the various options for managing the waste. For
the majority of waste materials, such a wide array of
information is not available, and few if any communities have the resources necessary to ascertain all of the unknown
parameters.
To make a decision amidst this uncertainty and
complexity it is very difficult to be objective. Some
subjective judgments are often needed to make estimates for
uncertain parameters. In order to estimate uncertain
parameters in a rational manner, a decision analysis
approach is used. As stated by Ronald A. Howard (17), decision analysis is a methodology for making logical
decisions in complex, dynamic and uncertain situations. It
treats uncertainty effectively by encoding informed
judgement in the form of probability assignments to events
and variables. An important benefit of decision analysis is that it provides a formal language for communication among the people involved in the decision making process.
The components of municipal solid waste (MSW) are
presented in Figure 1. Many potentially harmful metals and organic chemicals are components of products and packaging
that are used at residences and offices and then discarded
as MSW. When MSW is landfilled, incinerated, recycled or
Estimated Use of MSW Management Options,
1986
Landfilli 80%
Recycling
10%
Incineration 10%
Permitted Landfills
Percentage of existing 1986 landfills
X^^^
60
. \^^^^
40
^^~'~^-^-^
20
0
' : ^~^~~\
\-% 6-10 11-16
Years after 1988
16-80
Estimated Portions of Materials and Products In MSW, 1986, by Weight
Metals 9%
Glass 8«
Food wastes
9%
Paper/paperboard 36*
Figure 1. General data on MSW management. Source: Office of Technology Assessment, Facing America's Trash: What Next for Municipal Solid Waste, Washington D.C., 1989.
Plastics 7%
Textiles/Wood
6%
Rubber/leather
3%
Yard wastes 20% Misc. Inorganics
waste. In the report Facing America's Trash (31), published by the Office of Technology Assessment in 1989, troublesome wastes are discussed. Information from this report is
briefly summarized in the following three paragraphs.
Mercury, lead and cadmium are the metals which have
been focussed upon as posing potential health risks. Sources of mercury include most household batteries, fluorescent light bulbs, thermometers, and mirrors. The primary source of lead in MSW is automobile batteries, but
it is also found in solder in steel cans and electronic
components, paint pigments, and plastics. Cadmium is found in metal coatings and platings, rechargeable household
batteries, paints, and as a heat stabilizer in plastics. Approximately 98% of the lead and 64% of the cadmium are in noncombustible materials, suggesting that separation of
these materials from waste to be incinerated would reduce
the amount of these metals in emissions and ash.
Household hazardous waste are another component of MSW
that contains potentially toxic substances. Over 100 substances listed in RCRA as hazardous are present in household products. Household hazardous waste includes cleaning products, automobile products, home maintenance products, personal care products and yard maintenance products.
Most plastics contain additives to give them specific useful properties. Over 4,000 individual types of additives exist and they can be classified into four major types: reaction controls, processing additives, stabilizers, and performance additives. Concern over the fate of additives when plastics are discarded has focussed primarily on heavy metal
additives and organic and halogenated chemical additives. Heavy metal additives, particularly lead and cadmium are used as heat stabilizers in wire and cable insulating material, furniture film, floor tiles, and pressure pipes and colorants in a wide variety of thermoplastics. Organic chemical additives are used for example as "plasticizers" which impart flexibility and as flame retardants. Flame retardant additives are made up of a variety of highly brominated organic compounds and are the troublesome waste evaluated in the application of the decision framework outlined in this paper.
In Figure 1, the estimated use of MSW management
methods is presented. Landfills have traditionally been the disposal method of choice for communities, however capacity
is declining for the following reasons: 1) older landfills are reaching their capacity; 2) increased Federal and State regulation has resulted in the closure of substandard
landfills and reduced the number of potential sites available for landfills; and 3) the public is extremely
displays a graph of the estimated decline in existing permitted landfills.
Incineration, which is used extensively in Europe, was seen as the ultimate solution for disposal problems, but it too has problems as follows: 1) the technology is unproven
in the U.S. (American facilities have a history of operating problems some of which are thought to be caused by the
higher percentage of plastics in American waste, leading to corrosion and unplanned shutdowns); 2) incineration can be a
disincentive for recycling if the plant is oversized; 3)
emission and regulatory standards have not been clearly
defined; 4) there is a lack of operator training in
facilities; 5) many toxic constituents have been measured in
incinerator ash and emissions (7,29,30,31). These problems
suggest that incineration is not the cure all for MSW management needs.
Despite their problems, the use of landfills and
incinerators is likely to be relied upon in the future as
the primary disposal methods of most communities, and when
it is carried out appropriately can be the best method to
manage particular wastes (29,40,46). Landfills will be
needed to dispose of ash from incinerators and in some cases
plant. The waste is the raw material and the products for
example are energy in the form of methane collected as it is produced in the landfill, or fertilizer from a compost heap
made up of organic waste (29,34).
To have a successful solid waste management program,
recycling must play a central role and options such as
composting which can convert organic waste into a useful
product should be coordinated into the overall management
scheme if possible. Recycling should be a top priority in
managing solid waste because of its materials conservation
benefits and its energy savings compared with manufacturing
using virgin materials. In a community which has a
comprehensive solid waste management program, several
disposal and recycling alternatives should be available.
Two reasons for this are that it enables manufacturing of
products specifically for a particular management option
(e.g. by designing products for recyclability) and it
enables solid waste management to be approached on a
material-by-material basis where waste material is diverted
to the most appropriate management method based on its
physical and chemical characteristics. To make informed
decisions regarding solid waste management alternatives,
local communities need to be aware of what the health risks and costs are for each alternative. There is considerable
uncertainty in evaluating the health risks that result from
there is uncertainty in determining the entire cost of a management alternative. The health risks depend on the magnitude of exposure to individuals from various
environmental media, and the potential harm this exposure causes. The costs are very specific to the local community and depend oh many factors such as local wages, land values, transportation systems, and the size of the community
(13,29,43,44).
When confronted with such uncertainty there are many
differing opinions as to what values should be assigned to
parameters of concern such as the concentration of a
substance leaving an incinerator stack. One approach is to
assign a best estimate to an uncertain parameter. A problem
with this approach is that it masks the inherent uncertainty in the parameter by assigning it only one value. In the event that the best estimate is incorrect and results in an
underestimate of risk, this approach can have disastrous consequences. Another approach is to assign the most conservative estimate to the uncertain parameter so as to minimize the possibility of underestimating risk. This approach however also masks the parameter uncertainty and tends to overestimate the risk. The conservative approach
assumes that the value of avoiding a negative outcome such
as one additional cancer case is extremely high. This can result in spending a considerable amount of resources to
place, and can lead to financial expenditures that may be
better utilized elsewhere.
The approach outlined in this paper is to use a range
of values to accurately represent the uncertainty of a
parameter. The range is based upon the best information
available. In the event of little information, the range of
values for a parameter is greater to reflect the high uncertainty. Models are used to represent the physical processes occurring, and assumptions made are explicitly
stated. A specific effort is put forth to prevent the
models from becoming tools to hide assumptions and cloud the
uncertain nature of the input parameters.
The decision framework presented in this paper attempts
to maximize reduction of health risks posed by a troublesome solid waste while minimizing the cost of implementing the
risk reducing management option. The focus will be on
landfills and incinerators, but management options such as
recycling, composting and banning of materials are
considered and can enter the decision framework if they are alternatives for managing the troublesome waste. Landfills and incinerators are the primary focus of this study because they are the predominant solid waste management alternatives
used by local communities today, and are a starting point
for the development of the framework. This by no means
communities should be to develop comprehensive solid waste management policies providing many options for managing waste. The framework developed can be extended to
comprehensively include all feasible management options,
providing a consistent comparison of expected performance as
measured by attributes such as risks and costs.
Method
The decision framework follows the outline shown in
Figure 2. Initially the management options for a
troublesome waste and the resulting exposures that occur for
each option are determined. Next, the health impacts of the exposure for each management option are assessed and it is
determined which option or combination of options poses the
least health risk. The management option that poses the
least health risk is called the preferred management option. Finally, the costs of managing the waste using the preferred management option are assessed and a recommendation as to
what action should be carried out is made.
If the costs are too high for the reduction in health risk,
a new option is evaluated to see if it has a more favorable
cost to risk reduction ratio. In a situation where several
risk reducing options exist, the costs can be evaluated for
each option. These steps will each be described in more
detail and an application of the framework will be made in a
Management
Option
Trou
Incinerate
Exposure
Incinerate
Preferred Management Option
Based on Health Risks
Risk
Cost to Implement
Option
Cost of Health Risk Reduction
Implement Option
Wilmington, North Carolina.
Models play a crucial role in the decision making
process. They are used to avoid the potentially expensive
cost of actually obtaining data as well as to make
predictions concerning future events. Decision analysis is
based on choosing the course of action which results in the
greatest likelihood of obtaining the most desirable future.
Typically a decision analysis is performed with a sequence
of progressively more realistic models. These models can be
referred to as the pilot model, the prototype model and the production model (17). The pilot model is an extremely
simplified representation of the problem and is utilized to
determine important parameters and their relationships. The prototype model is a more detailed but not entirely complete
representation of the problem. It gives an indication of how the final model will appear and perform. The production model is the most accurate representation of reality that a decision analysis can produce given spending limitations.
Throughout the modelling sequence, sensitivity analysis
is used to determine the most important parameters.
Sensitive parameters are those that highly influence the
output of a model. These parameters are included in the
of additional modelling is merited. This practice is referred to as the value of perfect information technique and may be applied at several points within the decision
framework.
Exposure/Intake
Individuals can be exposed to contaminants through air,
water and food. What actual exposure levels are and who is
exposed as a result of managing a troublesome waste are a function of several factors. These factors include how much
waste is generated, what management methods are available for the troublesome waste, environmental conditions in the community such as average wind velocity and direction, and
the population characteristics of the community. Processes
which lead to human exposure to troublesome components of MSW are summarized in Figure 3. For landfills, the typical
environmental medium that is contaminated is groundwater, but contamination of surface water is also possible. For
incinerators, the contaminated media include air from
emissions and groundwater from incinerator ash disposed in a landfill. Air emissions may subsequently lead to deposition
in surface water and onto soil and vegetation which then is
passed up the food chain. Thus, by carrying out groundwater
modelling and air modelling with consideration for
deposition onto soil, vegetation and surface water, overall
exposures can be determined.
Froubiesome
TRANSPORT MEDIA EXPOSURE
\ MOW /
Landfill
k. 1 k.
Water Consumption
\ • y
^ Leachate ^
^~—-r—-"'^ ^
i^ ^
r 1r4
^
M
Ir L Surface Water 1
Management
Option
^
r
k Surface Water Deposition
r^
Ashr
r
^ Incinerate
k Soil and
Vegetation Deposition Food Consumption L Stack Emission t r f
f
1
rͣ .
^
Animal Intake Respirationp>
^
Air rFigure 3. Flow chart for evaluating human exposure for the management
determine which input parameters are uncertain and which can be determined with a high level of confidence. Once those parameters of uncertainty are determined, each must be
evaluated for its sensitivity to the final exposure
concentration. If the parameter is uncertain, but changes
in the parameter have little effect on the overall
concentration, then it is an efficient use of analytical resources not to perform detailed analysis to determine the
range of values for the parameter. The parameter must be
adjusted under several different conditions before being
considered non-critical in concentration determination.
This can be done by keeping several combinations of
parameters constant and adjusting the parameter of interest
for each combination. Those parameters that cause
considerable fluctuation in the final concentration must be
further analyzed. This analytical process is called
sensitivity analysis and is at the heart of an application
of this framework.
Groundwater modelling, air modelling and food exposure evaluation require several input parameters. These
parameters as well as the quality of information regarding them and their sensitivity to the model prediction are listed in Tables lA and IB and IC. The ratings for
uncertainty/sensitivity are very general and in specific
cases may not apply.
TABLE lA: Pareuneters needed in groundwater modelling (9,23,36) Parameter Method of Determination Relative Uncertainty/ Sensitivity -saturated hydraulic conductivity, K, (m/yr)
-measure at site
-base upon soil type
MODERATE/ MODERATE
-hydraulic gradient,
I, (m/m)
-measure at site
-base on local
characteristics
LOW/ MODERATE
-porosity, p
(unitless)
-measure at site
-base upon soil type
LOW-MODERATE/ MODERATE -seepage velocity, V, (m/yr) -estimate with equation
V = (K * I)/p
MODERATE-HIGH/HIGH
-Longitudinal dispersivity
coefficient, Cl, (m)
-estimate as 0.1 times distance of
interest MODERATE/ LOW -Longitudinal dispersion, Dx, (m/yr) -estimate with equation
Dx = Cl * V
MODERATE/ LOW
-Transverse dispersion,
Dy, (m /yr)
-estimate as
0.1 - 0.3 times Dx
MODERATE/ LOW
-Vertical dispersion,
Dz, (m /yr)
-estimate as
0.1 - 0.01 times Dx
MODERATE/ LOW
-Retardation, R, (unitless)
-refer to literature -use estimation
HIGH/HIGH HIGH/HIGH
technique based on solubility or
octanol water coeff.
-measure in lab using
soil from site
-Decay rate, T,
(1/unit of time)
Note: Applies to
organic chemicals
-refer to literature -use estimation
technique
HIGH/HIGH
-Source Concentration,
Co, mg/liter
-measure at site -refer to literature
17
TABLE lA (cent.)
Parameter Method of Determination Relative Uncertainty/ Sensitivity ͣ
Penetration depth, P,
(m)
-Aquifer thickness, d,
(m)
-use estimation technique
-measure at site -measure at site -base on local
characteristics
MODERATE/
LOW
MODERATE/ LOW
TABLE IB: Pareuneters needed in air modelling (3,42,45)
-Stack emission
concentration, Cs,
(mg/m )
-Stack exit gas
velocity, Vs, (m/s)
-Weather/wind profile
for community of
interest
-Degradation
-measure
-refer to literature -calculate based on
input and destruction ratio
LOW-HIGH/ HIGH
-Stack height, H, (m) -measure -measure
-calculate -base on data
for actual or nearby community
-refer to literature
LOW/MODERATE LOW/MODERATE
LOW-MOD./
HIGH
HIGH
TABLE IC: Parameters needed for food exposure modelling
(15,38) NOTE: Relative sensitivity not rated
for food exposure parameters
-air concentration
-soil deposition
-vegetation deposition -decay in soil
and vegetation
-air modelling HIGH
-refer to literature MODERATE
-estimation technique
-refer to literature MODERATE -estimation technique
TABLE IC (cont.)
Parameter
-animal intake
-animal uptake
-human intake
Method of
Determination
Relative
Uncertainty -refer to literature
-measure for site -refer to literature
-measure/estimate
LOW-MODERATE
MODERATE-HIGH
-refer to literature LOW-MODERATE
-measure for community
evaluating exposure as a result of managing a troublesome MSW. The levels of uncertainty are based on the amount and
quality of information for a particular parameter. The
level of uncertainty for retardation, decay rates,
contaminant intake and uptake by biota, and to a lesser
extent deposition rates are uncertain primarily because of
the complexity of the physical process. These parameters
are a function of many variables making them site specific
and difficult to estimate. The parameters source concentration, stack emission, and to a lesser extent
seepage velocity may be uncertain due to the lack of
measurement data rather than the inherent complexity of the
physical process.
As previously stated, the sensitivity ratings are very
general and may not apply to all cases. For example, if a
community was interested in the potential contamination of
groundwater at a specific well obtaining water at a given
Dy, and Dx) may be highly sensitive to the contamination ' concentration. However, when considering general levels of
groundwater contamination, changes in the dispersion values
do not have a great impact on the contamination level. On
the other hand, under most circumstances changes in seepage
velocity, retardation, and decay rates, have a significant
impact on concentration levels. Seepage velocity regulates
the distance the groundwater plume will travel; retardation
essentially reduces the seepage velocity and when it has a high value can dominate the other variables; and the decay rate causes reduction in concentration as the plume spreads
away from the troublesome waste source. The source
concentration and emission rate are directly correlated with
the contaminant level, and thus, the model prediction is
highly sensitive to their value.
The sensitivities for parameters used in evaluating
food exposure are case specific and not cannot accurately be
generalized. If a substance has a high rate of decay on vegetation, than the vegetation deposition and uptake will
have little impact on overall food exposure. Of course the
exact opposite impact would result if there was little decay
on vegetation and vegetation was the primary source for human consumption. In this way, all of the parameters in
food exposure have the potential to highly effect the model
prediction.
exposure impact are population characteristics such as
location relative to source of contamination, density of
population and future projections for population
characteristics. If an exposure is very high but effects only a few individuals, its impact may be less than a low
exposure effecting many.
Once the parameters of greatest uncertainty and
sensitivity have been determined, a statistical distribution is used to represent the uncertainty. This can be carried
out at different levels of complexity. For the case study
in this paper, the uncertainty is represented by
establishing a range of discrete values for each parameter and assigning each value a corresponding probability. A more complex approach is to establish a distribution such as normal or Poisson that reflects the uncertainty as a
continuous function. Both approaches are based on the same
concept of expressing the uncertainty over a range of
values. The continuous range simply provides more detailed data and should be applied if this detail is considered
important in making the final decision.
The following is an example of using discrete values to represent a parameter's uncertainty. For groundwater
seepage velocity, the expected range may be from 10 m/year to 100 m/year, and this could be expressed as 20% likely
that flow is 10 m/year, 60% likely that flow is 55m/year and
values used depends on the level of uncertainty for the
parameter. For a parameter that is highly sensitive to the
final outcome with an extremely wide range of potential values, it is appropriate to assign more discrete values to reflect its uncertainty. In assessing a likelihood for each value in the range, as much information as is readily
available should be used. It is recommended that in order
to understand and make explicit the assumptions underlying
how the numbers are arrived at, each value and its
corresponding likelihood must be defended.
There are many sources of information to obtain values
for the parameters. Ideally the actual values can be found
in the literature, but this often is not the case. There
are chemical estimation techniques which enable one to
calculate various characteristics of a particular chemical (1,21). The estimation techniques can be based upon
information from a similar chemical, and/or data on the
chemical such as the octanol water coefficient or water
solubility. Other sources of information include
engineering studies such as groundwater boring at a landfill site and design or operating conditions for a facility such as the exit temperature from an incinerator stack. For some parameters, current data such as lab analysis of groundwater or incinerator ash can be useful. Finally when there is no
information in the literature or in order to further defend
field can be a source of information. In the event that no
information can be obtained, then the range for the
parameter will have to reflect the great deal of
uncertainty. For parameters such as this, if appropriate
and possible it may be worthwhile to perform actual research
to obtain a better understanding of its potential value.
The value of perfect information technique mentioned
previously is useful to evaluate the appropriateness of
investing time and money in research.
Once values and their corresponding likelihoods have
been established, the probability of environmental media
concentration for the contaminant can be determined. When
discrete values are assigned to uncertain parameters, there
are a given number of resulting scenarios to be input into
the model. For example, if there are four parameters whose
value is uncertain, and each is expressed with a range of
three values, there would be 3 to the 4th or 81 possible
scenarios. The probability of each scenario is the
multiplication of each of its parameter value's likelihoods.
Thus, the contaminant concentration in a particular
environmental medium, as calculated through the use of a
model, will have a range of possible overall values each
with a corresponding overall likelihood. This contaminant
concentration range for exposure can be converted to a range
of human intake by using a standard factor (i.e. 2 liters of
contain uncertainty. A cumulative distribution curve for
the probability that the intake of a contaminant is lower
than a given value can be generated. This is accomplished
by arranging the intake values from lowest to highest and
adding their corresponding likelihoods. The probability
that an individual receives less than a given intake, X, is
equal to the summation of all the probabilities for each
scenario resulting in an intake value below X.
Health Risk
Once the range of intake through air, water, and food
has been determined, the next step is to assess what effect
this intake has on human health. Typical communities may
not have the resources to carry out a full fledged health
risk analysis. This will be the case particularly for those
wastes for which health effects are unknown. For each
management method, the corresponding intakes (i.e. air, water, food) need to be evaluated for their health risks.
Because the intake amounts are over a range, the health
effects are also over a range. The final output is a curve
of likelihood of a particular health risk (e.g. increase in
lung cancer or expected number of increased cases of heart
attacks, etc.) for the community as a result of a particular
management option. Each management option has a different
range of possible effects, and that option which minimizes
health risks is called the preferred management option.
such as a No Observed Adverse Effects Level (NOAEL) or a "
Virtually Safe Dose (VSD) value which can be used to assess risk. The NOAEL level is based on the assumption that there
must be a threshold before a substance has a harmful effect
and is usually determined in animal experiments involving
lifetime exposure (10). The NOAEL dose is divided by a
safety factor to allow for increased human sensitivity and varying sensitivities amongst humans to calculate an
Acceptable Daily Intake (ADI). VSD's are used by United
States regulatory agencies to regulate chemical carcinogens
and represent a daily dose which correlates to an additional
cancer case per million individuals over a lifetime (14).
Health guideline values are calculated and published by several federal agencies, primarily the Environmental
Protection Agency, but also the Food and Drug
Administration, the Center for Disease Control and other concerned agencies. The values are based on cellular,
animal and/or human exposure studies and are best estimates
as to risk and are available for a wide variety of
substances including metals and organic compounds. There is
considerable uncertainty in these values, and this
uncertainty will be briefly described. Nevertheless they are often the only measures available to assess what health
risk a substance poses, and although relying on a single value for health risks masks the uncertainty in the value
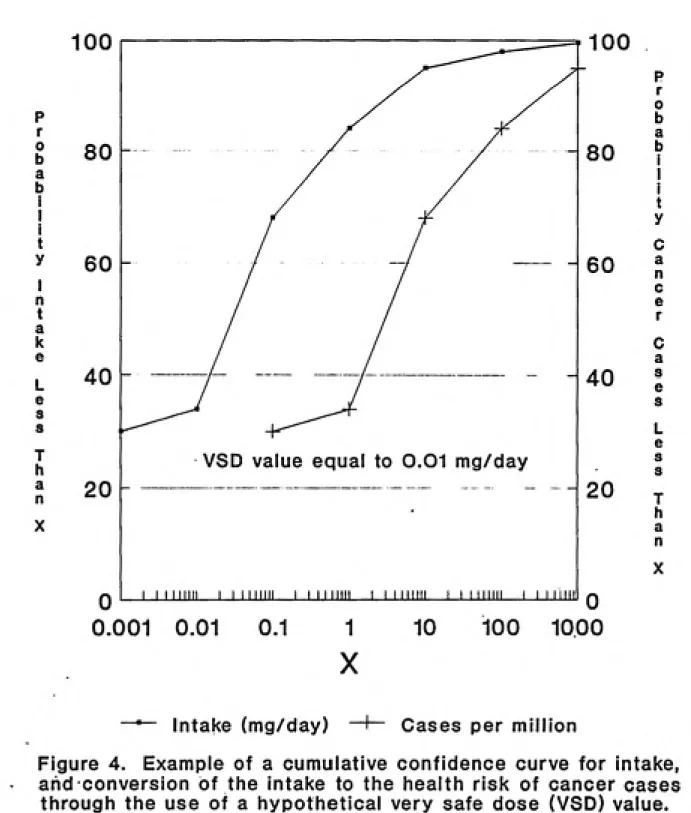
Health guideline values for a chemical (or values for
similar substances if none exist for the actual chemical of
interest) can be used to carry out simple analysis of
potential risk. The range for intake previously calculated
can be divided by the guideline value to determine the level
of risk the intake poses. This is demonstrated in Figure 4.
As previously mentioned, assessing health risks for
exposure to a substance is laden with considerable
uncertainty. For many substances, there simply is no
information available pertaining to their health risks. For
those in which health risks have been evaluated, many
factors contribute to uncertainty in the results. Several
key contributors to uncertainty in assessing health risk are
briefly described below.
Extrapolating data from animal studies to humans is a
difficult process. Two major extrapolations are:
interspecies adjustments for differences in size, lifespan
and basal metabolic rate and extrapolation of the
dose-response relation observed at doses used in animal
experiments to lower doses to which humans are likely to be
exposed (10). Chemical agents vary widely in extent of
absorption among animal species and ideally this should be taken into account, but there are limited data on absorption
for most chemicals (10,27). Another difficulty in making
p r o b a b i I i t y I n t a k e L e s • T h a n 20
VSD value equal to 0.01 mg/day
20
Q...I mil___...___I I I null___I I I iiiiii Q
0.001 0.01 0.1 1 10 100 1000
X p r o b a b i j t y 0 a n c e r C a s e L e s s T h a n
Intake (mg/day) Cases per million
Figure 4. Example of a cumulative confidence curve for intake,
and conversion of the intake to the health risk of cancer cases
through the use of a hypothetical very safe dose (VSD) value.
The VSD value represents risk of one additional cancer case
accurately represent human exposure. For instance, the animal dose may be given in their food whereas the typical human dose occurs by inhalation. High doses are used in
animal studies in part to account for the small number of experimental animals used. Animal studies are very
expensive and costs limit the number of animals that can be
studied. It is hoped that by giving high doses
statistically significant results can be obtained. However,
this creates the problem of extrapolating from high to low doses. Scientist have developed several mathematical models
to estimate low-dose carcinogenic risks from observed
high-dose risk. These models tend to fit the experimental, high
dose data, but the predicted risks at low doses may vary
significantly (2,10). Knowledge of actual biological
mechanisms of a substance and how these lead to harmful
effects is important to truly understand the impact a
substance has on human organs and tissues. This knowledge facilitates risk extrapolation from animals to humans and guides researchers in what is the best method to study a
substance's toxicity (2,27). However, Even for highly
studied substances such as dioxin (2378-TCDD), biological
mechanisms are not clearly understood (14). Even when
biological mechanisms are understood, varying sensitivities
among humans of different ages, for example, further complicates the extrapolation process and risk
When human exposure data are available the problems of extrapolation can sometimes be avoided. However, human
exposure data are often unavailable, missing or imprecise, and once a substance is suspected of being harmful it is
usually too late to obtain human data. Efforts to
reconstruct past exposure levels have not been extremely successful and have led to conclusions which were later
refuted (20).
There are several additional problems in general when
attempting to determine health risk. Present studies do not
attempt to account for multiple and mixed exposures which
are common in the environment and workplace and may play a
role in health risks (20). Most risk assessments do not even consider health risks other than cancer and results are
essentially unverifiable without using epidemiological
techniques, which due to methodological limitations cannot
be done (20).
Awareness of these uncertainties is important so that a decision maker understands the limitations of his findings. Amidst all of this uncertainty a decisionmaker in a local
community can only be expected to obtain as much information
as possible and to act in an appropriate manner. This paper
describes a simple and relatively conservative method to carry out a health risk analysis. If after using
conservative health risk assumptions there is no significant
is not needed. A more detailed analysis may be appropriate when the costs and risks involved are high. Substances whose health risks have been more thoroughly studied lend themselves to a more detailed analysis. These substances
may have an actual range of potential health risks per unit
of intake and can be combined with the range for intake
previously calculated to determine a final range of health risks for the community. In cases where it is possible to obtain better information on health risks, value of perfect
information techniques can again be utilized to determine if
it is worth the cost to acquire the information.
Once health risks are assessed the preferred management
option can be chosen. Difficult comparisons such as low exposures for many in the near future versus high exposure for few many years into the future need to be made. The best choice may be to utilize one management option only
such as incineration, several management options, or on the other hand to exclude one management option which presents high risks. One community's preferred option(s) may be
different than another even for the same troublesome waste.
Costs
Once health risks are established, the final step is to
30
that costs of changing management methods are evaluated with respect to a single troublesome waste and not solid waste in general. The following list of questions, which will be discussed in more detail can be used as a guide to
estimating costs:
1. How much total waste and how much troublesome waste does
the community discard, how is the waste distributed amongst management alternatives, what factors determine
the distribution, and is the preferred management option the same or different than currently being practiced? 2. If the preferred management option is different than
currently practiced, what factors unique to the
community may affect their willingness to implement the
preferred management option?
3. For various separation methods, what will the cost be, and what separation will be achieved?
4. Once the waste is separated, can it be recycled?
5. What will be the additional cost (or savings) in changing the management method after the waste is
separated?
6. What is the total cost and is there a separation and management option that reduces health risks at a cost the community is willing to pay?
Question 1: A basic piece of information is how much total
solid waste a community discards and what proportion of that
waste is the troublesome waste. Knowledge of how the
troublesome waste of concern is distributed amongst
management options and what the factors are that dictate the
location within the community, contractual agreements to
deliver specified amount of waste, or existence of a central
collection facility or transfer station from where waste is
divided among management alternatives (44). Some
distribution schemes result in consistent waste makeup sent to management alternatives of the community (i.e.
distribution based solely upon location) whereas others may
result in daily fluctuation in amount and content of waste sent to alternatives (distribution after waste arrives at
central facility). Those schemes that tend to be consistent
will simplify implementing separation procedures.
An example of carrying out step 1 follows. It is
determined that for a troublesome waste in Community X, 60% is sent to an incinerator and the remaining 40% is sent to a landfill. The distribution is based on the following facts:
1) Location within the community determines whether waste is
sent to the landfill or incinerator; 2) 60% of all the solid waste goes to the incinerator and 40% goes to the landfill;
3) it is assumed that the troublesome waste is the same
proportion of total waste across the entire community.
Knowledge of the distribution of a troublesome waste and the factors controlling the distribution is needed to develop a
plan to separate the troublesome waste from the overall
waste stream. For instance, since community X has a rather
consistent distribution that is based upon location,
3 2
then a separation program only needs to be set up in
locations where the waste is sent to the landfill. Had the
waste in community X been delivered to a central facility
where the waste distribution between landfill and
incinerator was not consistent, then a separation program
would have to be implemented for the entire community or at
the central facility.
Whether or not the preferred management option is
different or the same than is presently carried out in the
community is also important. In the example case, had the
preferred management option been to send the waste to a
landfill and the community already sent 90% of the
troublesome waste to a landfill then no further action may
be called for, however if the community only sends 20% of
the troublesome waste to a landfill, then removing the
troublesome waste from the overall solid waste stream may be
necessary.
Question 2; Different communities will place different
values on the reduction in health and environmental risk
they achieve by modifying their method of managing a
troublesome waste, and there is no set formula to determine
the value of risk reduction. Many factors play a role when
a community is deciding how much it would be willing to
spend to correct a solid waste health risk. These factors
attitude of citizens in the community as to the amount of
risk they feel is acceptable.
One way to think about the health and environmental
risks for a particular management option is as the liability
a troublesome waste poses to officials and government in the
community. For other types of liability, insurance costs could be used as an indication of the costs; however, this
is not the case for liability caused by exposure to
pollution. The insurance industry in general has attempted to exclude coverage "to bodily injury or property damage arising out of the discharge, dispersal, release or escape
of smoke, vapors, soot, fumes, acids, alkalides, toxic
chemicals, liquids or gases, waste materials, or irritants contaminants or pollutants into or upon land the atmosphere or any water course or body of water" (6). Despite the exclusion, courts have often ruled that the insurance does cover liability expenses in cases of pollution and as a result general liability coverage for environmental
contamination is difficult to find and limited in protection
(6,11). Nevertheless, a community may be able to estimate
what its potential liability would be. Liability costs include compensation costs which are payments made out to individuals who suffered as a result of exposure to a toxic substance, abatement costs which are the costs to cleanup a contaminated site and administrative costs which include
acquiring information to handle the problem in the first '
place (11).
As well as costs to the community government, there may
be social and economic costs to the community in general.
Poor health in the community can disrupt many normal
everyday activities including one's ability to work. In addition, personal suffering of individuals and families can
occur. How the community values avoiding these social costs
will determine how much should be spent in changing
management options for a troublesome waste.
Question 3; Separation costs depend on many factors such as
the desired separation percentage, the method of separation
implemented, and what proportion of the community's waste
already is managed using the option(s) of choice. Generally
the more money that a particular community spends the
greater separation they can achieve. However, to achieve the same desired distribution, different methods may be
implemented by different communities depending upon local
characteristics. Rural areas are likely to rely more upon
citizen participation in the separation process. in many
rural areas citizens are responsible for delivering their
normal waste to a central pickup site (44).
Separation can be carried out at a central facility
where all the solid waste is delivered or at the source by
community residents. Source separation programs depend on
Whether materials are collected at curbside or delivered to
a central collection area and whether separation is
voluntary or mandatory (34,44).
In order to calculate the cost of a separation program
the following information is needed: 1) capital costs; 2)
operating expenses; and 3) resident expenses. Capital costs
include such items as new collection vehicles, storage bins,
modifications made to present collection vehicles,
mechanized separating equipment and planning costs. Operating expenses include labor costs, fuel costs,
maintenance and repair costs, and administrative costs. Resident time and space expenses include time spent
separating troublesome waste, space required to store waste and expenses in delivering waste to collection site if
carried out by residents.
Below is a list of potential separation methods and a
general indication of efficiency and costs.
Method 1; Use unskilled labor to separate troublesome waste
at a facility after it has already been collected with
regular solid waste. EFFICIENCY—Low to High CAPITAL COST—Low
OPERATING COST—Moderate to High
RESIDENT COST—None
COMMENTS: This approach may be appropriate when the
troublesome waste is easily separated by hand when mixed
troublesome waste needs to be separated out because the
majority is already being managed using the option(s) of
choice (for instance only the waste sent to the landfill
needs to be separated). ,.(6r if unskilled labor is readily
available. It has the advantages that very little if any
new equipment needs to be purchased and no changes to
regular solid waste collection are needed. Disadvantages
are that it is very labor intensive, and there are potential
health and safety hazards for the workers. These health
risks will have to be evaluated and incorporated into the
overall health risk consideration.
Method 2; Mechanized separation at central facility after
troublesome waste has been collected with regular solid
waste.
EFFICIENCY—Moderate to High CAPITAL COST—Moderate to High
OPERATING COST—Moderate RESIDENT COST—None
COMMENTS: Some wastes such as paper, aluminum, and iron
which can be recycled have been separated using mechanized
equipment (32,44), and these procedure may be applicable to
certain troublesome wastes. However applications are
limited, and capital expense and economic risks are likely
to be high. This approach does have the advantage that the
regular solid waste collection system does not need to be
changed but should only be used when the technology is
Method 3: Pickup of troublesome waste during regular collection times using a normal truck that is modified to
accommodate separation of waste. EFFICIENCY—Moderate to High
CAPITAL COST—Low to Moderate OPERATING COST—Low to Moderate
RESIDENT COST—Low
COMMENTS: This method is primarily applicable to
troublesome waste that is widely distributed throughout the
community. It has the advantage that there is little
disruption to the normal collection operation and the waste
is separated before taken to a facility. Trucks can be modified by adding special racks or attaching a trailer which is specifically designed to handle the troublesome waste (32) . A disadvantage is that extra time may be
required as a result of waste separation thus increasing the
time needed for a collection crew to complete its regular route. The efficiency of separation is a function of
resident participation. Test have suggested that mandatory
separation programs tend to have higher levels of
participation (32).
Method 4; Use of separate truck to collect troublesome
waste.
EFFICIENCY—High CAPITAL COST—High
OPERATING COST—Moderate to High
RESIDENT COST—Moderate
COMMENTS: This is an effective but relatively expensive
operating costs include hiring a crew and maintenance and
repair on the trucks. However, if the troublesome waste is
not part of normal everyday waste and one truck can service
a large area, or this waste can be picked up by trucks the
community presently uses to collect recyclable material,
this may be the most appropriate and economic collection
method. Residents will need to be informed what the
operating procedures are for the new collection truck.
Method 5; Resident separation and delivery to central
collection centers.
EFFICIENCY—Low to Moderate CAPITAL COST—Low to Moderate
OPERATING COST—Low
RESIDENT COST—High
COMMENTS: This may be the most appropriate method when
there is little capital available to implement a separation program or if the community is rural. The primary burden is
on the residents who must separate the waste and deliver it
to the central facility. Thus the efficiency of the
separation relies totally upon resident participation and
participation rates for delivering waste to a central
facility have traditionally been lower than when the waste was picked up at curbside. The only capital costs are for
dumpsters to collect the waste and cost of setting up
facilities. Operating expenses include cost of periodically picking up the waste and transporting it to the final
Method 6; Contract with private firm to carry out
separation procedure. EFFICIENCY—Low to High
CAPITAL COST—Low
OPERATING COST—Medium to High
RESIDENT COST—Low to Moderate
COMMENTS: This approach reduces the administrative burden
on local authorities and may be particularly appropriate if
the contractor has some use for the troublesome waste. It
enables a community to take advantage of the expertise an
outside contractor may have. The "purchase" of this
expertise may have a high initial cost but in complicated
situations may pay for itself by minimizing avoidable
expenses. Cost and efficiency will be a function of the
contract and can vary considerably, and liability
responsibilities will have to be agreed to in the contract.
Many of the same issues and costs outlined above will also
hold for this method, but will be passed through by the
contract.
Question 4: Once the troublesome waste has been separated,
does it have a potential use that would eliminate disposal
costs and possibly even have recycling value? If it does,
this value serves to reduce the overall cost of separating
the waste. In some cases private contractors may be willing
to accept the waste for a smaller cost than any disposal
option. The availability of consistent secondary markets
40
option.
Question 5; Once a waste has been separated the cost of
managing it using the preferred management option based on
health risks as opposed to the current option needs to be
calculated. In this step, the focus is on solid waste
disposal costs in general rather than upon the specific
troublesome waste. Once a cost difference per ton between the new and old options is calculated, the marginal cost (or savings) of changing the option for the troublesome waste can be determined based upon the amount of troublesome
waste.
The cost for a management option can be broken down
into collection (including hauling) and disposal (recycling will be considered a method of "disposal"). Historically
collection of the waste has been the primary cost averaging
60-80% of entire costs (13,29,31) However, as waste
facility sites become increasingly expensive to build, the disposal costs have begun to increase (13,31). For
instance, in Charlotte N.C., the cost of curbside collection
of normal MSW is approximately $35 per ton while the cost of
incinerating the waste is $23 per ton (16). Depending upon
the management option different components of the cost will
be different. For instance, again in Charlotte N.C., the collection cost for recycled waste is approximately $70/ton
and the disposal cost is $7/ton (16). Care should be taken
because these costs can be a function of one another. For
instance if a community normally incinerates 25% of its
waste but due to a breakdown has to send this waste to a
landfill, the cost on a per ton basis at the landfill may
drastically change. All of the costs work together.
Nevertheless, when considering what the differences in cost
of management options are for a troublesome waste, unless
the troublesome waste is a significant proportion of the
total waste stream then it can be assumed that the costs for
each management option will not be altered by changing the current management option for the troublesome waste.
Each community has a unique cost structure. Major
sources of cost variation between communities are wage
rates, method of collection, disposal options, land costs,
and the size of the community (29,44,47). Additionally,
some communities own and operate the management facility as
well as the collection service whereas some facilities are
privately owned and operated. In rural areas, waste is often collected by private operators or hauled by residents to a central location. When determining the disposal costs at a
community owned and operated facility, capital costs and
operating and maintenance costs must be known, whereas in determining costs at a private facility these costs are all
accounted for in one set tipping fee based on the same
elements. A more detailed description of collection cost,
cost is below.
Collection costs
Collection costs include capital cost to purchase
trucks and operating and maintenance costs for labor, fuel,
truck repair, and administrative expenses. These costs
depend upon the crew size, type of collection truck, type of
pickup (curbside vs back door), frequency of pickup, and
distance to disposal site or transfer station (44,46). In
the event that a private hauler picks up the waste, then the
collection cost are normally a standard rate charged to
households. Collection costs for landfills and incineration
are typically equivalent.
Hauling cost
Hauling cost will occur if a transfer station is needed
to deliver the waste to the final disposal site. Transfer
stations are utilized to reduce transportation costs by
using tractor trailers which can carry more waste than a
regular garbage truck and only have one driver as opposed to
an entire crew in a garbage truck. The cost is highly
correlated to the distance to the final disposal site. The
following parameters are needed to determine hauling cost
(13):
1. Time based transportation costs
-Tractor trailer costs
-Driver salary 2. Mileage Cost
-Fuel Cost
-Oil and Tire Cost
-Maintenance and Repair Costs
maintenance costs.
Operating and Maintenance Costs
These costs include expenses of day to day operation at
a facility. Expenses include labor, utilities, equipment
operation and repair, and administrative costs. Certain
costs are unique to disposal facilities. Modern landfills have groundwater monitoring and cell development costs and
incinerators have ash disposal costs. Incinerators are
often not run by the community but rather by a firm who
establishes a contract with the community where they are
paid a specific rate (16). The firm is then responsible for
some of the operating and maintenance costs. In general
operating and maintenance cost for incinerators is greater on a per ton basis than landfills. In a small study carried out by the Office of Technology Assessment (OTA) for their
report Facing America's Trash (31), incineration operating
costs ranged from $18-$50/ton while at landfills operating
costs ranged from less than $3/ton to $40/ton at a state of
the art facility.
Capital costs
Capital costs include all the expenses of building a
facility. They vary considerably from one type of facility
to the next and one community to the next. The estimated
cost of building a modern landfill in 1983 was 1.25 million
for a 50 ton per day facility and 5.62 million for a 500 ton
generalize but tend to be approximately 4-10 times greater
than a comparatively sized landfill (13). The 1986-87
Resource Recovery Yearbook reported adjusted capital costs
(in 1986 dollars) ranging from $250,000 to $429 million for
incinerators with an average of $58 million (31). Landfill
costs are projected to increase more quickly than
incinerators in the coming years as increased regulations
are imposed increasing the difficulty of establishing and building approved disposal sites (13,30).
Typical capital costs include: land, site preparation,
buildings, utilities, equipment, and planning expenses.
Costs that are unique to landfills include a liner, leachate
control system, and groundwater monitoring system. Costs
unique to incinerators include: steam/power generation
equipment and transmission lines for energy recovery
facilities, air pollution control equipment, and start-up
and acceptance testing expenses (13). Capital costs at a
composting facility depend upon the level of technology
utilized. The level of technology depends upon the space
available for the composting operation and the speed with
which it is desired to produce a compost product (34).
Higher technology composting operations require more
equipment to control moisture content, oxygenation, and
temperature in the compost piles.
Question 6: The total cost can be calculated in dollars/ton
companies the procedure is fairly straightforward because
the expenses are in the form of tipping fee's and collection
fee's which can readily be broken down into a cost per ton
basis. For services owned and operated by the community,
the capital expenses are amatorized over their lifetime into
a yearly cost which can then be converted to a cost per ton
value based on the tons of waste "handled" by the particular
piece of equipment be it the incinerator itself or a trailer
at the hauling station. Operating and maintenance costs
can likewise be calculated for a one year period and
converted to a dollar per ton value.
Overall costs for a management option are expressed in
Equation 1. Cost on a per ton basis can thus be determined
for the preferred management option and the normal
management option. The cost to switch to the preferred
management option is the tons of troublesome waste switched
times the difference in cost per ton between the old
management option and the management option of choice.
Adding the cost of switching management options to the cost
of separating out the troublesome waste gives the total cost
of changing management options for a troublesome waste
(Equation 2).
Equations
1. MC(X) = OM + Cap + coll + Haul
MC(X) - Management Costs for option X ($/Ton of MSW)
OM - Operating and maintenance costs ($/Ton of MSW)
Costs
Capital Cost
Collection vehicles
Storage Bins
Mechanized equipment Planning expenses
Operating Costs
Labor Fuel
Maintenance
Resident Costs Time
Space
Option Costs Option Costs
(on a per ton basis)
COSTS
Change in Collection and Hauling Costs
Difference in distances to management sites
Change in Capital Costs
Land Site preparation
Buildings Planning expenses Equipment
Change in Operating Costs
Labor Utilities
Equipment maintenance and repair
Administrative costs
Figure 5. Summary of costs involved when changing management options for a
Coll - Collection costs ($/Ton of MSW) Haul - Hauling cost ($/Ton of MSW)
2. TOTAL COST =( MC)*{T) + SC
TT - Mass of troublesome waste (Tons)
SC - Costs of separating troublesome waste
The total costs are a function of the desired
separation of the troublesome waste. With increasing levels of separation and thus greater reduction of health risk, there are higher costs. A separation efficiency/risk
reduction versus cost graph can be generated for each of the
separation alternatives. This is demonstrated in a
hypothetical example in Figure 6. Utilizing the generated
graph the community can determine what is the most cost effective method, based on what they are willing to spend,
for reducing the risks posed by the troublesome waste.
In the event that costs are prohibitively high and risks
are also high, the community may choose to ban the
troublesome waste altogether. There are costs involved when
a waste is banned. The value of the service provided by the
product which eventually becomes the troublesome waste and the availability of alternatives to the troublesome waste
must be determined. In some instances, the use of
alternatives may also present risks which must be evaluated.
Banning of a troublesome waste ordinarily should only be
considered when there appears to be no alternative and the
-^- Plan 1 H— Plan 2 -^ Plan 3
% Separation Efficiency Risk Reduction (Cases X per million)
Low Moderate
COSTS
High
105
Figure 6. Separation efficiency and risk reduction versus cost for three hypothetical
separation plans. The risk reduction is evaluated at the 85% point on the cancer case
cumulative confidence curve in Figure 4. This point correlates to a health risk of less
than 150 cancer cases per million lifetimes. Thus, with 50% separation efficiency,
Discussion/Case Study
Brominated Fire Retardants in Wilmington. NC MSW
Wilmington, NC is located iii a small county - New
Hanover -on the southern coastal area of the state. The
county's population in 1980 was approximately 100,000 and
was centered primarily In the southeast section of the
county (43). New Hanover county has both a double lined
landfill and a massburn steam recovery incinerator. The
landfill and incinerator are both located in the northwest
area of New Hanover close to both Fender and Brunswick
counties which are more rural than New Hanover (see Figure
7). Presently the incinerator is being expanded to increase
its capacity from 200 tons/day to 450 tons/day, and when the
expansion is complete in 1991 the county intends to
incinerate all MSW except unburnables such as concrete (4).
Unburnables will be sent to the landfill along with
incinerator ash (4). The landfill has a leachate removal
system and the leachate is treated in a lagoon and pumped
into the Cape Fear river (36).
Brominated organic compounds are among the most widely
used and effective flame retardants. Hydrogen bromide,
which is one chemical formed when a brominated organic
compound burns, is one of the most effective agents to react
with hydroxy radicals and similar species in flames, which
are responsible for the propagation of fires (18).
County
Landl
Lake Sutton
Industrial Area
1 Mile
Highway 421 to Wilmington