COMPARISON OF SINGLE-AGAR LAYER AND TWO-STEP
ENRICHMENT SPOT PLATE METHODS IN THE DETECTION
OF SOMATIC AND MALE-SPECIFIC COLIPHAGES IN NC
TYPE II RECLAIMED WATER SAMPLES
By
Matthew Price
A technical report submitted to the faculty of the University of North
Carolina in partial fulfillment of the requirements for the degree of
Master of Science in Public Health in the Department of
Environmental Sciences and Engineering, School of Public Health
Chapel Hill
2014
Approved By:
______________________________
Mark D. Sobsey, Ph.D.
______________________________
Louise M. Ball, Ph.D.
ABSTRACT
MATTHEW TYLER PRICE. Comparison of Single-Agar Layer and Two-Step Enrichment Spot Plate Methods in the Detection of Somatic and Male-Specific Coliphages in NC-Type II Reclaimed Water Samples. (Under the direction of
Mark D. Sobsey, Ph.D.)
Somatic and male-specific coliphages serve as valuable indicators of fecal contamination in water systems. While numerous findings show their
and C3322 were excluded for much of the study due to their inefficiencies in detecting appropriate coliphage levels during the initial phase of experimentation. The study did find, however, that CB390 was sufficient in detecting both somatic and male-specific coliphages when compared to the sum of Famp and CN13 coliphage totals tested individually. While both types of coliphages were detected in all 39 samples, somatic coliphages vastly outnumbered male-specific ones over the course of the study. After examination of coliphage levels within the various water samples and after analysis of coliphage log reduction data, it was
determined that both SAL and ENR methods are equally sensitive with regards to coliphage detection in reclaimed water samples. Variances in sample preparation time offer one of the key differences between the two methods, with SAL
allowing a more fast and direct approach to experimental results. Therefore it is because of this key difference that SAL is the recommended method of choice in coliphage detection for NC-Type II reclaimed water samples over ENR.
TABLE OF CONTENTS
Table of Contents………. i-iv
Acknowledgements……….. v
List of Tables……… vi-vii List of Graphs……… viii
List of Figures………... ix
List of Appendix Tables……… x
List of Appendix Graphs……….. xi
List of Appendix Figures………... xii
Chapter I: Introduction………. 1-3 Chapter II: Objectives...……..……….. 4
Chapter III: Experimental Design………. 5-7 Chapter IV: Literature Review……….. 8-43 1. Water as a Means of Personal Health……… 8-13 2. Enteric Viruses……… 13-16 3. Hepatitis A & E……….. 16-20 4. Rotavirus………. 20-21 5. Human Calciviruses (Noroviruses)………. 21
c. Escherichia coli……… 28
d. Other Potential Indicators: Enterococci & Clostridium
Perfringens……… 29-30
e. Bacterioides………... 30 f. Coliphages………. 30-33
i. Male-Specific Coliphages……… 31-32 ii. Somatic Coliphages………. 32-33 8. Methods for Coliphage Detection……….. 33-36 9. Escherichia coli Hosts………. 36-39
a. Male-Specific (F+) E. coli Host Famp……….. 37 b. Somatic E. coli Host CN13………... 37-39 c. E. coli CB390 and C3000 Hosts……….... 39 10.The Use of Reclaimed Water Sources………. 39-41 11.NC Reclaimed Water………... 41-43
12.Objectives………. 43
Chapter V: Materials and Methods……… 44-55 1. Sample Collection……… 44-45 2. Sample Preparation: Two-Step Enrichment Spot
Plate Method……… 45-50 a. Preparation of Overnight E. coli Host and Antibiotics
(Day Two)………. 48-49 d. Enrichment Assay Plate Spotting (Day Three)……….. 49 e. Interpretation of the Enrichment Results (Day Four)………. 50 f. Statistical Analysis of the ENR Samples……… 50-51 3. Sample Preparation: Single-Agar Layer Assay……… 51-55
a. Preparation of Overnight E. coli Host and Antibiotics
(Day One)……… 51 b. Log Phase Host and Agar Preparation (Day Two)…………. 52 c. Creation of Negative Control Plates (Day Two)………. 53 d. Making of Single-Agar Layer Plates (Day Two)………….. 53-54 e. Interpretation of Single-Agar Layer Results (Day Three)…. 54 f. Statistical Analysis of the SAL Sample……… 54-55 Chapter VI: Results……….. 56-92
1. Comparison of Somatic, Male-Specific/F+ Hosts and Total
Coliphages Using SAL Method: Phase 1... 56-62 2. Comparison of Somatic, Male-Specific/F+ Hosts and Total
Coliphages Using ENR Method: Phase 1... 62-67 3. Comparison of SAL and ENR Methods for Coliphage Detection in Phase 1 Reclaimed Water Samples……….. 68-72 4. Phase 2 Analysis of Reclaimed Water Samples (Raw Sewage,
Pre-UV and Treated Effluent)... 72-74 5. Comparison of Somatic, Male-Specific/F+ Hosts and Total
6. Comparison of Somatic, Male-Specific/F+ Hosts and Total
Coliphages Using ENR Method: Phase 2... 76-80 7. Comparison of Coliphage Detection in Wastewater and Reclaimed Water by SAL and ENR on Difference E. coli Hosts: Phase 2….. 80-84 8. Log10 Reductions of Coliphage Concentrations Following
Wastewater Treatment……… 85-89 9. Average Daily and Monthly Coliphage Mean Concentrations in Final Treated Effluent……… 89-92 Chapter VII: Discussion………. 93-103 1. Phase 1 Analysis……….. 96-97 2. Phase 2 Analysis……….. 97-99 3. Treated Sample Log10 Reductions……… 99-102
Chapter VIII: Summary/Conclusion……….. 103-106
1. Summary……….. 97-98
Acknowledgements
LIST OF TABLES
Table Page
1 Pathogens Transmitted Through Drinking Water 11 2 Commonly Transmitted Human Enteric Viruses 15 3 Examples of Enterovirus Disease and their Corresponding
Health Effects 16
4 Bacteriophage Families 23
5 Key Characteristics of Indicator Organism 26 6 Methods for Coliphage Detection: Freshwater 34 7 Various E. coli Hosts Along With Evident Coliphages 36 8 NC Reclaimed Water Microbial Indicator Requirements 42 9 E. coli Hosts with Respective Coliphages 46 10 100x Antibiotic Stock Solution Preparation 47 11 Preparation of the Agar Media Using the ENR Method 48 12 Preparation of the Agar Media Using the SAL Method 52 13 Variables Compared Between Experimental Phases 56 14 Coliphage Concentrations Using SAL with Respective Means
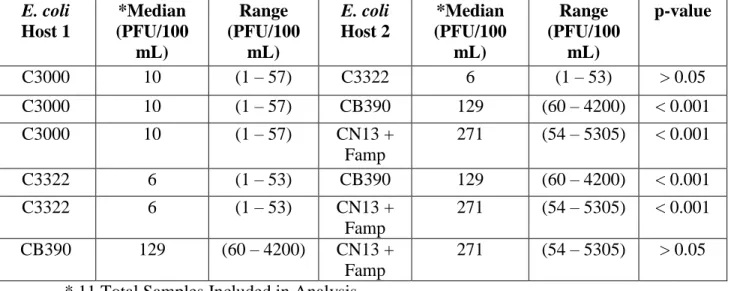
and 95% Confidence Intervals for Eleven Phase 1 Samples 58 15 Concentrations (PFU/100 mL) of Coliphages
Detected by Different E. coli Hosts Using Kruskal-Wallis
Post-Tests for Data from the SAL Method for 2013 Phase 1 60 16 Coliphage Concentrations (PFU/100 mL) Detected by
Different E. coli Hosts as Mean Values and 95% Confidence Intervals in Pre-UV Reclaimed Water Samples by the SAL
Method for 2013 Phase 1 61
17 Coliphage Concentrations Using ENR with Respective Means
18 Concentrations (PFU/100 mL) of Coliphages Detected by Different E. coli Hosts Using Kruskal-Wallis Post-Tests for
Data from the ENR Method for 2013 Phase 1 65 19 Concentrations (MPN/100 mL) of Coliphages as Mean
Values and 95% Confidence Intervals in Reclaimed Water
Samples by the ENR Method for 2013 Phase 1 66 20 Analysis Using Kruskal-Wallis Post-Tests of Coliphage
Concentrations in Reclaimed Water Samples by the SAL and
ENR Methods, Phase 1 69
21 Paired Analysis of Coliphage Concentrations in Reclaimed
Water Samples by the SAL and ENR Methods, Phase 1 70 22 Coliphage Concentrations Using SAL with Respective
Means and 95% Confidence Intervals for Phase 2 Samples. 73 23 Concentrations (PFU/100 mL) of Coliphages Detected by
Different E. coli Hosts Using Kruskal-Wallis Post-Tests in Reclaimed Water Samples by the SAL Method for Combined
Phase 1 (2013) and Phase 2 (2014) Data 75 24 Concentrations (PFU/100 mL) of Coliphages Detected by
Different E. coli Hosts as Mean Values and 95% Confidence Intervals in Reclaimed Water Samples by the SAL Method
for Combined Phase 1 (2013) and Phase 2 (2014) Data 76 25 Coliphage Concentrations Using ENR with Respective Means
and 95% Confidence Intervals for Phase 2 Samples 77 26 Concentrations (PFU/100 mL) of Coliphages Detected
by Different E. coli Hosts Using Kruskal-Wallis Post-Tests in Reclaimed Water Samples by the ENR Method for Combined
Phase 1 (2013) and Phase 2 (2014) Data 79 27 Concentrations (MPN/100 mL) of Coliphages Detected by
Different E. coli Hosts as Mean Values and 95% Confidence Intervals in Reclaimed Water Samples by the ENR Method for
Combined Phase 1 (2013) and Phase 2 (2014) Data 80
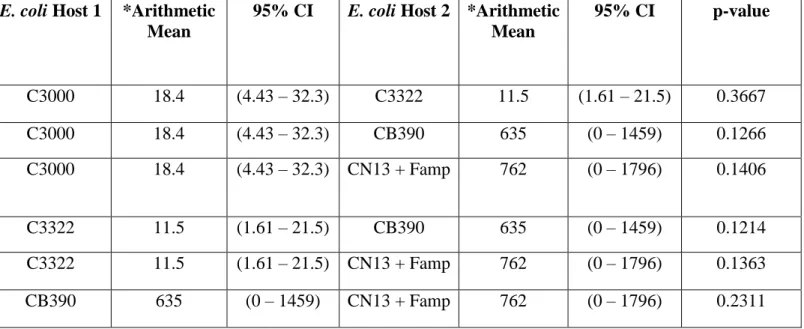
28 Analysis Using Kruskal-Wallis Post-Tests of Coliphage Concentrations in Reclaimed Water Samples by the SAL
29 Comparison of Coliphage Concentrations in Reclaimed Water
Samples by the SAL and ENR Methods, Phase 2 82 30 Concentrations of Total Coliphages in Wastewater and their
Log10 Reductions by Treatment: SAL Method 86
31 Concentrations of Total Coliphages in Wastewater and their
Log10 Reductions by Treatment: ENR Method 87
32 NC Reclaimed Water Microbial Indicator Requirements 90 33 Daily and Monthly Geometric Means Coliphage Concentrations
per 100 mL Using SAL Method 91
34 Daily and Monthly Geometric Means Coliphage Concentrations
LIST OF GRAPHS
Graph Page
1 Box-and-Whisker Plots of Concentrations (PFU/100 mL) of Coliphages in Reclaimed Water Samples by the SAL Method
for 2013 Phase Samples 61
2 Box-and-Whisker Plots of Concentrations (MPN/100 mL) of Coliphages in Reclaimed Water Samples by the ENR Method
for 2013 Phase Samples 65
3 Comparisons of Coliphage Concentrations Detected by the SAL and ENR Methods on each E. coli Host in Phase 1 Reclaimed
Water Samples 68
4 Comparisons of Coliphage Concentrations Detected by the SAL and ENR Methods on each E. coli Host in Phase 2 Reclaimed
Water Samples 77
5 Coliphage Log10 Reductions for Type 2-like Reclaimed Water
LIST OF FIGURES
Figure Page
LIST OF APPENDIX TABLES
Table Page
1A Percent Somatic vs. Male-Specific of Total Coliphage Count
Using SAL Method for Phase 1 (2013) Samples 108 2A Percent Somatic vs. Male-Specific of Total Coliphage Count
Using ENR Method for Phase 1 (2013) Samples 109 3A Percent Somatic vs. Male-Specific of Total Coliphage Count
Using SAL Method for Phase 1 (2013) and Phase 2 (2014)
Samples 110
4A Percent Somatic vs. Male-Specific of Total Coliphage Count Using ENR Method for Phase 1 (2013) and Phase 2 (2014)
Samples 111
LIST OF APPENDIX GRAPHS
Graph Page
1A Coliphage Concentration (PFU/100 mL) Trends Using Various E. coli Hosts within the SAL Method for Phase 1
(2013) and Phase 2 (2014) Data 113
2A Coliphage Concentration (MPN/100 mL) Trends Using Various E. coli Hosts within the ENR Method for Phase 1
LIST OF APPENDIX FIGURES
Figures Page
1A Example of Somatic and Male-Specific/F+
Plaques Using the SAL Method 115
2A Example of Zones of Lysis Indicating Somatic and
Male-Specific/F+ Results Using the ENR Method 116 3A EPA Method 1601 Providing Step-By-Step Instructions
in the Preparation of Samples Using the Two-Step
Enrichment Spot Plate Method for 100-mL Samples 117 4A EPA Method 1602 Providing Step-By-Step Instructions
in the Preparation of Samples Using the Single-Agar Layer
Chapter I.
INTRODUCTION
With rapid population growth in North Carolina coupled with an increasing demand for water domestically, innovative solutions have been established in order to meet the growing needs of an expanding urban environment. These resolutions include the use of “reclaimed” wastewater
effluents meeting stringent guidelines set for the purpose of conserving the State’s water resources, ultimately reducing the overall use of potable water, surface water and groundwater (NC OAH, 2012). The processes used in the treatment of reclaimed water provide various barriers for the control of pathogens. These treatments must be effective in pathogen reduction in order to safely reuse the water for non-potable uses (Ex. irrigation, industrial process water and as cooling water) (Hardwood et al, 2005). Furthermore, treatments used by facilities in the processing of reclaimed water include biological treatment (Ex. UV radiation), physical removal and chemical treatment (Ex. chlorination).
been found to be representative of enteroviruses present within the environment (Gantzer et al, 1998). In comparison, male-specific bacteriophages are found extensively in most animal species, however, studies have shown that
concentrations of these phages are relatively low once excreted (Calci et al, 1998). Therefore, greater studies are needed in order to better understand the relative concentrations of these two indicator organisms within water sources believed to be affected by fecal contamination.
Rapid and reliable methods are needed in order to properly detect male-specific and somatic coliphages within water samples. Proposed methods by the Environmental Protection Agency (EPA) have advised towards the use of both single-agar layer (SAL) and two-step enrichment spot plate (ENR) methods in the detection of these coliphages (EPA Method 1601 & 1602, 2001). Using these methods, one can enumerate the quantity of coliphages present within water samples in hopes of determining possible safety risks associated with either consumption or contact. By comparing the two methods, one can also determine which, if either, offers a more efficient technique in coliphage detection, with emphasis on reclaimed water sources. Additionally, there is very little
comparative data on the various candidate host bacteria used in detecting both somatic and male-specific coliphages. These hosts include Famp and CN13 which are known to detect male-specific and somatic coliphages respectively and
C3000, C3322 and CB390 which can detect both (Guzman et al, 2008). Therefore, in addition to comparing the effectiveness of the SAL and ENR
examine the overall abilities of several E. coli hosts in detecting both somatic and male-specific coliphage levels within reclaimed water samples. By studying these comparisons, we can hope to better understand the occurrence of fecal
Chapter II.
OBJECTIVES
To compare and evaluate the single-agar layer (SAL) assay and two-step
enrichment spot plate (ENR) methods for detection of coliphages as indicators of fecal contamination in NC Type-2 reclaimed waters.
To compare the occurrence of male-specific/F+ and somatic/F- coliphages in NC Type-2 reclaimed water samples using bacterial hosts E. coli Famp and CN13.
To test the effectiveness of using bacterial hosts E. coli C3000, C3322 and CB390 in the detection of both somatic/F- and male-specific/F+ coliphage totals in
reclaimed water samples when compared to the combined coliphage sums using Famp and CN13 hosts.
To evaluate coliphage concentrations at various stages of water treatment including raw sewage, primary and secondary-treated water (pre-UV treatment) and post-UV treated water (final) effluent.
To determine appropriate coliphage log10 reductions (> 5.0) after tertiary
Chapter III.
EXPERIMENTAL DESIGN
In this study the effectiveness of two alternative methods used to detect somatic and male-specific coliphages in North Carolina Type II reclaimed water were evaluated. The central comparisons of the study examine differences in coliphage detection using two analytical methods: the single-agar layer (SAL) plaque assay and the two-step enrichment spot (ENR) plate assay. Furthermore, various E. coli
bacterial hosts and wastewater sample types were compared in order to determine their ability to detect coliphage concentrations in reclaimed water samples. To obtain a representative sampling of North Carolina reclaimed water types, five water reclamation facilities within the Research Triangle region of NC were included in the study. The coliphage assay experiments were carried out in a blind study in that the identities of the treatment facilities were left unknown to provide greater focus on the methods being tested.
In order to ensure impartiality with regards to the sample methods or E. coli hosts, identities of the five treatment facilities were left unknown throughout the study. Furthermore, both detection methods, SAL and ENR, were tested simultaneously when analyzing each sample over the course of a week in order to reduce sample preparation time. E. coli hosts were evaluated for performance using both SAL and ENR methods to examine their effectiveness in quantifying the infectivity of their respective coliphages. In addition, the study was carried out in two phases: Phase 1 which took place during the summer and fall of 2013 (23 July – 29 October) and Phase 2 which was performed during the summer of 2014 (20 May – 11 August). During Phase 1, five E. coli hosts were examined: Famp, CN13, C3000, C3322 and CB390, with Famp being used in the detection of male-specific coliphages, CN13 in the detection of somatic coliphages and C3000, C3322 and CB390 in the detection of both. During Phase 2 of the experiment, only three of the initial five hosts were used: Famp, CN13 and CB390.
Secondary-treated (pre-UV) reclaimed water samples were the only sample type analyzed during Phase 1 of the experiment while raw sewage, pre-UV reclaimed water and tertiary treated (final effluent) samples were examined during Phase 2.
Chapter IV.
REVIEW OF LITERATURE
WATER AS A BASIS FOR PERSONAL HEALTH
On the basis of public health, it is widely known there is an association between water availability and quality with one’s personal health. Millions of individuals, however, suffer daily with conditions and illnesses attributed to either the lack of water sources or safe water supplies. While the exact amount of water needed to ensure total health is largely disputed, the World Health Organization estimates an amount of 7.5 liters is required daily per capita in order to sustain life. This figure is founded on the requirements of “lactating women living in above-average temperatures and engaging in increased levels of physical activity” (Howard, 2003). Furthermore, the WHO recommends 20 liters per capita per day to ensure that an individual has enough water for both consumption and hygienic purposes (Howard, 2003). These amounts are strictly for domestic uses, however, and do not account for other personal water practices also attributable to one’s personal health (Ex. water used in medical facilities or in agricultural settings).
and prosperous ones. By including a target solely based on water and sanitation needs, the impact of diarrheal disease in developing countries was finally acknowledged. This awareness would ultimately bring attention to the fact that worldwide 1.5 million (2.7%) deaths annually are attributable to diarrheal diseases (WHO, 2014). This figure is even greater in children under the age of five where it is believed that 11% of all deaths worldwide occur as a result of diarrheal diseases (WHO, 2014). These percentages are shocking considering these deaths, if people were given access to clean drinking water and adequate sanitation practices, could potentially be prevented.
predominately porous limestone, may have helped increase the probability that the spring was affected by the surrounding surface water. Finally, the spring water tested positive for E. coli (Salmonella was not tested), suggesting that the spring ultimately was the source of the waterborne contamination (Brunkard et al, 2011).
In addition to the previous case, another well-documented waterborne outbreak, which happens to also be associated with E. coli, is believed to be one of the first reported cases via waterborne transmission. The outbreak occurred in the small town of Cabool, Missouri during the winter months of December 1989-January 1990. Prior to the E. coli outbreak, the public water supply for the town was obtained from deep wells which transmitted the water untreated to storage reservoirs within the town’s distribution system (Geldreich et al, 1992). The outbreak, which resulted in 243 documented cases of diarrhea, 32 hospitalizations and 4 deaths, was linked to E. coli found in the feces of the affected individuals. After extensive testing of the water distribution modeling system for the town, it was determined that the cause of the waterborne E. coli outbreak resulted from disturbances in the system which may have allowed in contaminants (Ex. the forty-three water meter replacements and two line breaks that occurred around the time of the reported cases) (Geldreich et al, 1992). Implications from this study highlight the use of a systems distribution model aimed to study patterns of illness associated with water movement throughout the system. Furthermore, waterborne outbreaks such as this one provide scientists a greater understanding of the
In addition to E. coli, various other pathogenic agents have also been known to cause diarrhea and other waterborne infectious diseases in both developed and developing countries (Table 1).
Table 1. Pathogens Transmitted Through Drinking Water
Pathogen *Health
Significance Persistence in Water Supplies Resistance to Chlorine Relative Infectivity Important Animal Source Bacteria Burkholderia pseudomallei
High May multiply Low Low No
Campylobacter jejuni, C. coli
High Moderate Low Moderate Yes
Escherichia coli – Pathogenic
High Moderate Low Low Yes
E. coli – Enterohaemorrhagic
High Moderate Low High Yes
Francisella tularensis
High Long Moderate High Yes
Legionella spp High May multiply Low Moderate No
Leptospira High Long Low High Yes
Mycobacteria (non-tuberculosis)
Low May multiply High Low No
Salmonella Typhi High Moderate Low Low No
Other salmonellae High May multiply Low Low Yes
Shigella spp. High Short Low High No
Vibrio cholera High Short to Long Low Low No
Viruses High
Adenoviruses Moderate Long Moderate High Yes
Astroviruses Moderate Long Moderate High Yes
Enteroviruses High Long Moderate High Yes
Hepatitis A virus High Long Moderate High Yes
Hepatitis E virus High Long Moderate High Potentially
Noroviruses High Long Moderate High Potentially
Rotaviruses High Long Moderate High Yes
Sapoviruses High Long Moderate High Potentially
Protozoa High
Cryptosporidium hominis/
Parvum
High Long High High Yes
Cyclospora cayetanensis
High Long High High No
Entamoeba histolytica
High Moderate High High No
Giardia intestinalis High Moderate High High Yes
Naegleria fowleri High May multiply Low Moderate No
Helminths High
Dracunculus medinensis
High Moderate Moderate High No
Schistosoma spp High Short Moderate High Yes Adapted from WHO Guidelines for Drinking Water Quality (2011).
* Health significance relates to the incidence and severity of disease, including association with outbreaks.
electron microscopy (EM) confirmed rotavirus as the pathogen responsible for the outbreak. Various factors were believed to have contributed to the spread of rotavirus. These included the fact there was no chemical or physical pretreatment of the water before filtration at the area’s water treatment plant as well as the failing of the chlorinator in the treatment facility for an undetermined amount of time leading up to the outbreak (Hopkins, 1984). This case indicates the dangers of other pathogens besides E. coli, which have the potential to infiltrate water distribution systems in developed countries.
ENTERIC VIRUSES
Human enteric viruses infect the gastrointestinal tract and are usually transmitted via the fecal-oral route. Comprised of nucleic acids, either DNA or RNA (not both), and a protein coat (capsid) used for protection and for attachment to host cells to initiate infection, these pathogens must obtain their energy and all other metabolic functions from a host organism. Enteric viruses, which are spread by food, water, fomites and even human contact, are of exceptional concern with regards to public health due to their high probability of infection and disease at low doses (Haas et al, 2014). It is estimated that approximately 20 million cases of enteric disease occur annually in the U.S. Furthermore, studies have shown that 8-40% of all groundwater could potentially be contaminated with enteric viruses (Haas et al, 2014). This raises great concern considering the high amounts of virus shed in the feces of infected individuals (typically 105 to 1011 per 1 gram of stool)
excreted in the feces of animals and humans (see Table 2). With regards to studying enteric viruses as possible water quality indicators, two of the most well studied groups are the enteroviruses and adenoviruses (Fong, 2005).
Enteroviruses, which are composed of polioviruses, coxsackie viruses,
echoviruses and other higher numbered enteroviruses, are in the Picornaviridae
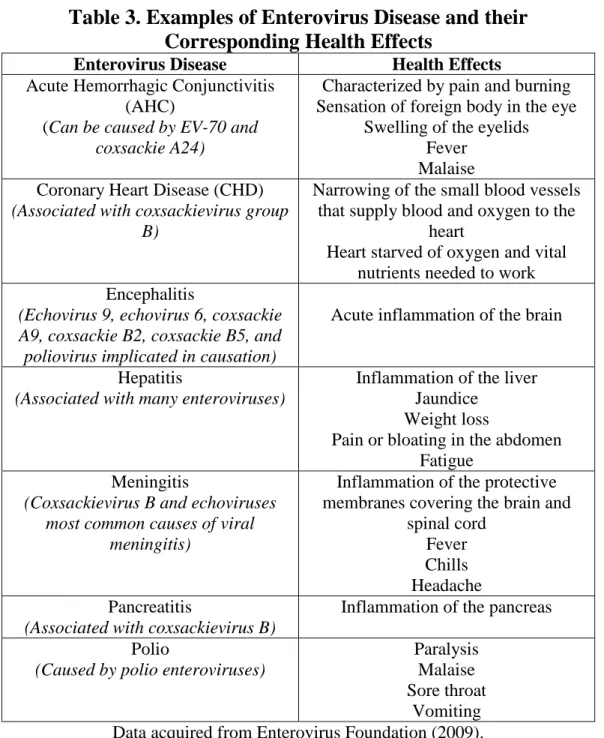
family. Adenoviruses, on the other hand, are non-enveloped, consist of double-stranded DNA and typically have greater resistance to UV radiation compared to other enteric viruses and most other waterborne pathogens (Fong, 2005). Both virus types may cause complications in the respiratory tract of infected organisms. In addition to adverse intestinal and respiratory health effects, enteroviruses are known to cause a wide range of complications (Table 3). Therefore,
Table 2. Commonly Transmitted Human Enteric Viruses
Genus Popular Name Disease Caused
Enteroviruses Hepatovirus Reovirus Rotavirus Mastadenovirus Calicivirus Hepevirus Astrovirus Parvovirus Coronavirus Torovirus Poliovirus Coxsackievirus A & B
Echovirus *EV68 *EV69 *EV70 *EV71 Hepatitis A Human reovirus Human rotavirus Human adenovirus Human calicivirus Norwalk virus SRSV Hepatitis E Human astrovirus Human parvovirus Human coronavirus Human torovirus
Paralysis, meningitis, fever Herpangina, meningitis, fever, respiratory disease,
hand-foot-and-mouth disease, myocarditis, heart anomalies, rush, pleurodynia,
diabetes?
Meningitis, fever, respiratory disease, thrush, gastroenteritis Mild-severe respiratory illness, skin
rashes, pneumonia, dehydration Respiratory illness
Acute hemorrhagic conjunctivitis, polio-like radiculomyelitis Causative agents of hand, foot and
mouth disease (HFMD), severe central nervous system disease,
meningitis, encephalitis Hepatitis Unknown Gastroenteritis Gastroenteritis, respiratory disease, conjunctivitis Gastroenteritis Gastroenteritis, fever Gastroenteritis Hepatitis Gastroenteritis Gastroenteritis
Gastroenteritis, respiratory disease Gastroenteritis
Adapted from Bosch (1998).
Table 3. Examples of Enterovirus Disease and their
Corresponding Health Effects
Enterovirus Disease Health Effects
Acute Hemorrhagic Conjunctivitis (AHC)
(Can be caused by EV-70 and coxsackie A24)
Characterized by pain and burning Sensation of foreign body in the eye
Swelling of the eyelids Fever
Malaise Coronary Heart Disease (CHD)
(Associated with coxsackievirus group B)
Narrowing of the small blood vessels that supply blood and oxygen to the
heart
Heart starved of oxygen and vital nutrients needed to work Encephalitis
(Echovirus 9, echovirus 6, coxsackie A9, coxsackie B2, coxsackie B5, and poliovirus implicated in causation)
Acute inflammation of the brain
Hepatitis
(Associated with many enteroviruses)
Inflammation of the liver Jaundice
Weight loss
Pain or bloating in the abdomen Fatigue
Meningitis
(Coxsackievirus B and echoviruses most common causes of viral
meningitis)
Inflammation of the protective membranes covering the brain and
spinal cord Fever Chills Headache Pancreatitis
(Associated with coxsackievirus B)
Inflammation of the pancreas Polio
(Caused by polio enteroviruses)
Paralysis Malaise Sore throat
Vomiting Data acquired from Enterovirus Foundation (2009).
HEPATITIS A & E
evaluations provided by the World Health Organization, an estimated 20 million individuals are infected with Hepatitis E every year with an additional 1.4 million becoming infected with Hepatitis A (WHO Hepatitis A & E, 2014).
Hepatitis E is a non-enveloped virus belonging to a distinct genus (Hepevirus) and family (Hepeviridae) and possesses a single-stranded ribonucleic acid (RNA). Furthermore, HEV is known to cause liver inflammation within infected individuals. Hepatitis A, which is caused by the Hepatitis A Virus, is in the
Hepatovirus genus of the Picornaviridae family and also results in infection of the liver. Both HAV and HEV are transmitted primarily via the fecal-oral route through contaminated drinking water and food sources. Typical signs and
symptoms of Hepatitis A and E include jaundice (yellow discoloration of the skin and sclera of the eyes), dark urine and pale stools, anorexia, abdominal pain and tenderness, nausea, vomiting and a fever (WHO Hepatitis A &E, 2014). The virus is usually a self-limiting infection and resolves itself within 4–6 weeks, however severe cases may lead to acute liver failure or even death. An estimated 56,600 people, out of the 3.3 million acute cases of the virus, are believed to die annually (WHO Hepatitis A & E, 2014). Those at greatest risk for contracting infectious hepatitis disease include individuals living in poorer sanitation conditions without safe, clean drinking water and inadequate immunization resources.
attack rate of 3.0% within the region (Zhuang et al, 1991). Of great interest to researchers was the fact the incidence rate was higher in one of the local tribes using the pools and canals as a water source when compared to other tribes using their own personal water wells. Additionally, coliform tests confirmed positive results for each of the pool and canal sites examined, showing gross fecal contamination of the water with counts ranging from 90-230 coliforms per deciliter (Zhuang et al, 1991). These findings, in addition to higher attack rates within tribes choosing not to boil their water, lead researchers to assume the Hepatitis E outbreak was waterborne in nature.
While infectious hepatitis outbreaks predominate in less-developed, rural areas around the world such as China and other parts of Southeast Asia, outbreaks occurring here in the U.S. are an all too common reality as well. In fact, one of the most recent outbreaks here in the U.S. occurred as the result of contaminated food sources used in a Pennsylvanian restaurant in 2003. After analysis of the outbreak, 601 cases of HAV were identified with 124 of these individuals being
within food processing and handling and the ever-present threat of HAV and HEV outbreaks through mishandled water and food sources.
In addition to threats associated with food preparation, waterborne outbreaks of HAV also affect individuals in the U.S. One well-documented case of such an outbreak occurred during the summer of 2006 on a farm in western North Carolina. In all, the investigation identified 16 cases of acute hepatitis A in individuals who had consumed contaminated spring water from the months of May to August of that year (Tallon et al, 2008). Water from the spring was distributed into a ventilated manufactured barrel reservoir and pumped to various locations on the site such as the house, a greenhouse, and a camping area downhill from the spring (Tallon et al, 2008). Furthermore, the fact that the spring was located downhill from the septic tank of the farm residence, raised concerns regarding possible ground and spring water contamination. After analysis of the spring water samples, scientists were able to recover HAV from the fecally contaminated drinking source that was identical to HAV isolated from the sera of people linked with hepatitis A outbreaks (Tallon et al, 2008). Ultimately the results provided evidence that the contaminated spring was the source of the waterborne outbreak, once again highlighting the potential public health threats here in the U.S. associated with uncontrolled HAV occurrences.
The literature clearly shows an association of HAV and HEV outbreaks with contaminated water and food sources. It is also important to note the
polymerase chain reaction (PCR) methods in detection of the Hepatitis E virus in sewage treatment plants. Over the course of the study researchers collected 500 milliliter samples of both the sewage influent and treated effluent at three separate wastewater treatment plants throughout India on a monthly basis (Jothikumar et al, 1993). In order to quantify the amounts of HEV present in both the untreated and treated samples, researchers developed protocols for testing the virus. These included methods used to determine virus adsorption to membrane filters, elution with a urea-arginine phosphate buffer and reconcentration using magnesium chloride (Jothikumar et al, 1993). Results of the study found the PCR method to show a high degree of sensitivity and specificity in detecting HEV in sewage samples. This study ultimately helped reveal that wastewaters from sewage treatment plants can be a constant and distinct source of infectious hepatitis viruses, which in this case was enterically transmitted HEV.
ROTAVIRUS
(1989) found increased percentages of infection rates of individuals living within close proximity to a wastewater spraying irrigation sight. In response to infection, seroconversions were observed in 32.7% (32 out of 98) of children under the age of 16 and in 12.7% of adults (33 out of 260) (Ward et al, 1989). While reusing wastewater for the purpose of irrigation offers a cost-effective way of fertilizing plant crops, it does appear to come at a significant price to public health.
HUMAN CALICIVIRUSES (NOROVIRUSES)
Members of the human calicivirus family, for example the Norwalk virus, are well-known causes of acute gastroenteritis resulting from waterborne
outbreaks. Characterized by nausea, vomiting and a mild fever, symptoms of the illness usually last from 1-3 days. As is the case with many other enteric illnesses, transmission of the disease occurs via the fecal-oral route with humans being a common reservoir. Previous outbreaks caused by contaminated ice and cooked shellfish have suggested that calciviruses are capable of surviving in harsher environmental conditions. However recent findings have found the viruses to be highly sensitive to ozone treatment and moderately sensitive to UV-radiation used by drinking water treatment facilities (Shin & Sobsey, 2003).
BACTERIOPHAGES
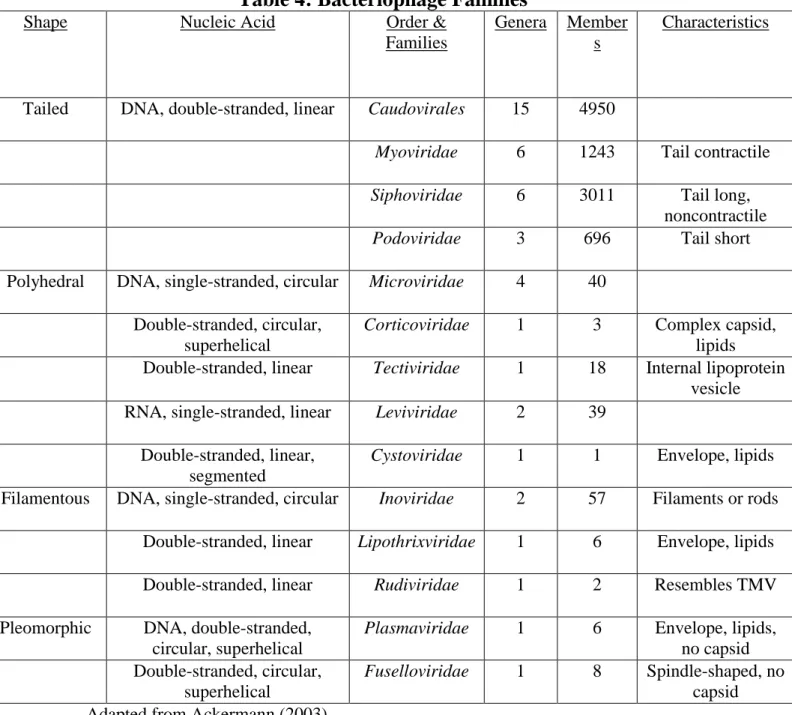
in structure. While viruses are classified into 3 orders, 61 families and 241 genera, bacteriophages themselves constitute 1 order, 13 families and 30 genera (Table 4), clearly making up a large portion of total viruses present within the environment (Ackermann, 2003). Virus particles, known as virions, take various shapes and may be tailed, polyhedral, filamentous or pleomorphic. These variations are important with regards to their ability to infect host cells and overall persistence within the environment. Ultimately, infection of bacterial cells occurs as a sequence of multiple events within the host cell organism. The phage first has to attach itself to the host cell where it then separates its nucleic acid from the protein coat and enters. Using the replication mechanisms of the host, the phage then begins making new viral particles, taking over the cell’s functions.
Table 4: Bacteriophage Families
Shape Nucleic Acid Order &
Families
Genera Member s
Characteristics
Tailed DNA, double-stranded, linear Caudovirales 15 4950
Myoviridae 6 1243 Tail contractile
Siphoviridae 6 3011 Tail long, noncontractile
Podoviridae 3 696 Tail short Polyhedral DNA, single-stranded, circular Microviridae 4 40
Double-stranded, circular, superhelical
Corticoviridae 1 3 Complex capsid, lipids Double-stranded, linear Tectiviridae 1 18 Internal lipoprotein
vesicle RNA, single-stranded, linear Leviviridae 2 39
Double-stranded, linear, segmented
Cystoviridae 1 1 Envelope, lipids Filamentous DNA, single-stranded, circular Inoviridae 2 57 Filaments or rods
Double-stranded, linear Lipothrixviridae 1 6 Envelope, lipids Double-stranded, linear Rudiviridae 1 2 Resembles TMV Pleomorphic DNA, double-stranded,
circular, superhelical
Plasmaviridae 1 6 Envelope, lipids, no capsid Double-stranded, circular,
superhelical
Fuselloviridae 1 8 Spindle-shaped, no capsid Adapted from Ackermann (2003).
Podoviridae. The next category of bacteriophages, those that are polyhedral, are comprised of the families Microviridae, Corticoviridae, Tectiviridae, Leviviridae and Cystoviridae. These families are grouped based on whether they possess DNA or RNA. Microviridae, for instance, are small, have no envelope and contain a single piece of circular single-stranded DNA (Ackermann, 2003). Cystoviridae, on the other hand, contain three molecules of double-stranded RNA and RNA polymerase. Their capsids are also surrounded by lipid-containing envelopes, which they lose after entering the space between a cell’s cell wall and cytoplasmic membrane. The Inoviridae family of bacteriophages, which are comprised of Lipothrixviridae and Rudiviridae, start out single-stranded, however after infection within the cell, convert to double-stranded DNA. This group of viruses occur in enterobacteria and are sensitive to chloroform and sonication, yet resistant to heat (Ackermann, 2003). A final category of bacteriophages, the pleomorphic phages, are made up of the groups Plasmaviridae and Fuselloviridae. Plasmaviridae particles have no capsid and consist of an envelope and a “dense nucleoprotein granule.” These viruses infect their hosts by fusing their viral envelope with the mycoplasma cell membrane, releasing their viral particles by budding. Fuselloviridae, on the other hand, are lemon-shaped particles consisting of two hydrophobic proteins and host lipids, with short spikes at one end
Figure 1: Schematic of Major Phage Groups
Figure obtained from Ackermann (2003).
INDICATOR ORGANISMS
Indicator organisms are a monitoring tool that measure levels of fecal contamination in various water distribution systems. These organisms are not pathogenic in nature, however their existence reflects the presence or absence of pathogens due to the similar physical, chemical or nutrient conditions with which they are grown. Table 5 below highlights some of the key characteristics required of indicator organisms. Furthermore, examples of some commonly used indicator organisms include:
Total coliforms (gram negative bacilli, growth at 35oC after 48 hours)
Fecal coliforms (growth at 45oC after 48 hours)
Bacteria within the total coliform group, like E. coli, that have adapted for growth at intestinal temperatures.
Enterococci (gram-positive cocci, growth at 41oC after 48 hours)
Clostridium perfringens (spore-forming anaerobic bacterium that grows at 45oC after 24 hours (Griffin, 2001).
Table 5: Key Characteristics of Indicator Organism
Occurs where pathogens do Cannot grow in the environment
More resistant to disinfection than are pathogens Easy to isolate and count
Can be isolated from all water types Not subject to antibiosis
Only found in sewage
Found in higher numbers than pathogens
Density of indicator relates to degree of contamination
Overall, viruses tend to be more resistant to treatment processes, such as chemical disinfection, especially when compared to total and fecal coliforms and bacterial indicators such as E. coli. To better explain common advantages and
disadvantages of each group of indicators, it is best to examine them individually.
TOTAL COLIFORMS
“Total coliform bacteria” refers to a defined group of facultative anaerobic, rod-shaped, Gram-negative bacteria identified by their ability to ferment lactose and produce acid/gas within 48 hours at 35-37oC (Grabow, 1996). This group of indicators are mainly used for the assessment of sanitary water quality after the water has properly been treated and disinfected. Their association with fecal pollution, along with their relatively rapid and easy detection, make them a useful indicator. Total coliforms are not considered feces-specific, however, since many are capable of growth in both the environment and in drinking water distribution systems. Furthermore, while total coliforms are good indicators of bacterial contamination, they are not representative of viral contamination.
FECAL COLIFORMS
contamination if they are found to be present within the water supply (Whitlock et al, 2002). While they ultimately cannot point to a specific source of fecal
contamination, identifying the presence of this group of bacteria within water can help improve risk assessment and intervention methods with regards to preventing the spread of illness through fecal contamination.
ESCHERICHIA COLI
Of the three groups of indicators mentioned thus far, E. coli is regarded as the most specific to fecal contamination within water sources. Thermotolerant,
lactose-fermenting, enteric and Gram-negative, E. coli falls within the category of both total and fecal coliforms. This bacteria is an indigenous member of the intestinal flora of humans and other warm-blooded animals and makes up approximately 1% of the total bacterial biomass (Tallon et al, 2005). While the majority of E. coli bacteria have developed a commensal relationship within organisms, a small group are capable of causing disease. While there are obvious advantages to using the bacteria as an indicator for fecal contamination, possible disadvantages include the natural occurrence of E. coli in water systems. Also, E. coli is not an adequate indicator of some specific enteric pathogens, such as
OTHER POTENTIAL INDICATORS: ENTEROCOCCI & CLOSTRIDIUM PERFRINGENS
Enterococci, also referred to as fecal streptococci, are spherical Gram-positive bacteria closely associated with fecal contamination. These bacteria have a high presence within the environment as they are commensal inhabitants of many warm-blooded animals and are frequently shed in high densities. However, the use of enterococci as a fecal indicator has numerous disadvantages when compared to other indicators such as E. coli and fecal coliforms. One such disadvantage includes the fact populations of enterococci may be endogenous in soil and sediments and not exclusively fecal in nature (Byappanahalli et al, 2012). In addition, enterococci are found in a wide variety of domestic and wild animals, complicating the ability to understand possible point-sources within a system. Previous studies have shown enterococci may become rapidly inactivated upon introduction into the environment which could lead to a greater number of false-negatives when using the bacteria as a pathogen surrogate (Byappanahalli et al, 2012). Conversely, the underlying sediments and aquatic vegetation may act as a reservoir for enterococcus ultimately leading to overestimates of health risks (Byappanahalli et al, 2012).
With regards to Clostridium perfringens as a fecal indicator, a previous study conducted by P. Payment & E. Franco (1993) monitored the efficiency of C. perfringens and somatic coliphages at quantifying virus and cysts loads following water treatment. The results of their study found statistically significant
Cryptosporidium oocysts (Payment & Franco, 1993). This confirmed the use of C. perfringens as a potential indicator for the presence of fecal pathogens in surface waters. Furthermore, the study found that C. perfringens is an ideal indicator of virus and cyst inactivation as well as an overall indicator of water treatment efficiency. One can assume that the presence of C. perfringens in a treated water sample is indicative of less efficient treatment and consumption of the water may result in adverse health conditions (Payment & Franco, 1993).
BACTERIOIDES
This group of bacteria, commonly found in the gastrointestinal tract, are part of the normal microbiota in warm-blooded animals. Previous studies have shown them to be among the most prevalent genera in feces, however as anaerobic organisms, they are unable to survive long periods in aerobic conditions (US EPA, 2007). Current molecular techniques have been able to differentiate between human and animal strains of bacterioides, yet the diversity of the group limits their usefulness considering current detection methods. On the other hand, strengths for using bacterioides as fecal indicators include the fact methods for detecting them are inexpensive and their presence within samples does ultimately indicate fecal contamination (US EPA, 2007).
COLIPHAGES
well as prominent within human feces and sewage water, coliphages are ideal as an indicator of fecal contamination. In addition, coliphages may also be used as enteric virus indicators since they display similar behavior and survival methods in the aquatic environment (Borrego et al, 1990). In a study conducted by Juan Borrego and colleagues (1990), it was found that coliphages showed similar survival rates to Salmonella in marine environments while also displaying comparable resistance within fresh waters. The fact coliphages exhibit similar characteristics to many commonly known bacteria highlights a key reason why they are currently being used as indicators with regards to fecal contamination. Furthermore, since coliphages are viruses themselves, they also exhibit higher resistance to water disinfection processes such as chlorination (Borrego et al, 1990).
MALE-SPECIFIC COLIPHAGES
Male specific coliphages, also referred to as F+ coliphages, infect bacteria via the pili, which is a small appendage on the bacterium’s surface. Bacteria with these appendages are considered “male” in nature and in a project carried out by Mark Sobsey and colleagues (1995) the reliability of such coliphages as indicators for human enteric viruses in drinking water was tested. The male-specific phages were ultimately found to be valid in detecting fecal contamination, considering the F+ coliphages met four key criteria:
They are present in fecally contaminated waters at easily measureable levels, Their removal and inactivation from fecally contaminated source waters by water treatment processes (coagulation, filtration, and disinfection) are similar to those for disease-causing human enteric viruses, and
Determination of male-specific coliphage reductions by water treatment processes are simple, quick, reliable and inexpensive means to evaluate and monitor
treatment plant performance in achieving virus reductions (Sobsey et al, 1995). Furthermore, the study produced new information regarding the use of F+ coliphages as both fecal and viral indicators. Two such findings showed that F+ coliphages are readily detected at high concentrations in raw sewage and
secondary effluent and that reductions in F+ coliphages were similar to reductions shown in two enteric viruses observed within the study, HAV and rotavirus SA-11 (Sobsey et al, 1995). Overall, findings of the study determined F+ coliphages to be indicative of fecal contamination within water sources.
SOMATIC COLIPHAGES
infectious somatic coliphages and their persistence within the environment was studied. Their experiment found that the phage type Myoviridae was the most frequent type of somatic coliphage present in raw sewage, while Siphoviridae
became increasingly more abundant after chlorination of the raw and treated effluent (Muniesa et al, 1999). The study highlights the diversity of somatic coliphages present at different intervals of water treatment which may make it significantly more difficult in determining causes of fecal contamination present within water distribution systems.
METHODS FOR COLIPHAGE DETECTION
Table 6: Methods For Coliphage Detection: Freshwater
Method Coliphages Sample Volumes Quantification Unit Time Until Results EPA 1602 Single
Agar Layer (SAL)
F+ coliphage, somatic coliphage
100 mL Plaque forming units 16-24h culture and detection EPA 1601
Two-step enrichment (ENR)
F+ coliphage Total volume = 100 mL sub samples
Most Probable Number (MPN), positive volumes as
zones of lysis
16–24 h 1st culture ± 12–16 h 2nd
culture 28–40 h total 30 mL x 3
3 mL x 3 0.3 mL x 3 Somatic
coliphages
Total volume = 100 mL sub samples
Most Probable Number (MPN), positive volumes as
zones of lysis
16–24 h 1st culture ± 12–16 h 2nd
culture 28–40 h total 30 mL x 3
3 mL x 3 0.3 mL x 3 5 h Enrichment
(5-h-ENR)
F+ coliphages Total volume = 1 L sub samples
Most Probable Number (MPN), positive volumes as
zones of lysis
5 h initial culture period + 12–16 h 2nd
culture period for overnight enrichment
17–21 h total 300 mL x 3
30 mL x 3 3 mL x 3 5 h Enrichment
Coliphage Latex Agglutination &
Typing (5-h-ENR-CLAT)
F+ coliphages Total volume = 1 L sub samples
Most Probable Number (MPN), positive volumes as
particle Immuno-agglutination
5 h culture ± 1 min detection 5 h total
300 mL x 3 30 mL x 3
3 mL x 3 Overnight
Enrichment (ENR-CLAT)
Total volume = 1 L sub samples
Most Probable Number (MPN), positive volumes as
particle Immuno-agglutination
16–20 h culture ± 1 min detection 16–20 h total
300 mL x 3 30 mL x 3
With respect to the current study, our primary interests include the EPA 1601 and 1602 reports detailing sample preparation using the single agar layer (SAL) and enrichment spot plate (ENR) methods. In a study conducted by Roberto
Rodriguez and colleagues at the University of North Carolina-Chapel Hill, comparison methods were used to detect coliphage numbers in recreational marine waters at two California beaches. Of great importance is that both single agar layer and enrichment spot plate methods were used in this comparison study. Findings suggest that the two-step overnight enrichment spot plate method was the most sensitive for detection of coliphages in seawater, when compared to both SAL and modified ENR methods (Rodriguez et al, 2012). These modifications included shortening the incubation time of samples to 5 hours, providing “rapid” coliphage results and ultimately reducing the overall detection time from 40 to 17 hours (Rodriguez et al, 2012). One drawback of using the overnight ENR method, however, is the time required for the detection of coliphages (approximately 36 hours). Ultimately, the results of this study encourage the use of both the
overnight enrichment and rapid (5 hour) enrichment methods over the single agar layer method when quantifying fecal contamination in marine water systems (Rodriguez et al, 2012).
materials (Ex. petri dishes) (US EPA, 2007). The report also analyzed the limitations associated with the two-step enrichment method. While they found this method to be convenient in analyzing samples with volumes of up to 1 L, using it to resolve coliphage mixtures is made more difficult when more than one type of coliphage is present in the enriched sample. In many cases, one coliphage type will grow faster and to a higher concentration than others within the sample (US EPA, 2007). Ultimately, the report concludes by stating the need for further research using both methods in order to better understand their effectiveness in quantifying fecal contamination.
E. COLI HOSTS
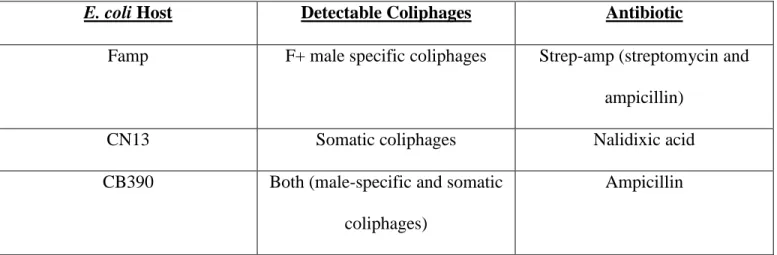
Various E. coli hosts have been studied to better understand coliphage detection within water and wastewater sources. Table 7 below summarizes well-known E. coli hosts such as Famp, CN13, CB390 and C3000. It is important to note that while the E. coli host C3000 is not antibiotic resistant and supports the growth of both male-specific and somatic coliphages, it is impossible to differentiate between the two unless further testing is completed (Hyman & Abedon, 2012).
Table 7: Various
E. coli
Hosts Along With Evident Coliphages
E. coli Host Detectable Coliphages Antibiotics
Famp F+ male specific Streptomycin-ampicillin
CN13 Somatic Nalidixic acid
MALE-SPECIFIC (F+) E. COLI HOST FAMP
Previous research has been conducted on E. coli hosts in order to better
understand their correlation with fecal contamination in surface waters. One such study conducted by Jill Stewart-Pullaro and colleagues (2005) used coliphages as a means to detect and track fecal pollution in surface waters exceeding state fecal coliform standards. In this experiment, coliphages were isolated from 117 surface water samples using two methods, single agar layer (SAL) and enrichment presence/absence (EP/A) methods. In order to distinguish between male-specific and somatic coliphages, 8 microliters of isolate suspension was spotted onto three plates: one containing E. coli CN13, another containing E. coli Famp and a third containing E. coli Famp plus RNase A. Lysis zone formation on the E. coli Famp and the E. coli Famp plus RNase indicated the presence of F+ coliphages,
whereas lysis zone formation on E. coli CN13 plates indicated the presence of somatic coliphages (Stewart-Pullaro et al, 2006). Findings suggested that overall male-specific coliphage concentrations were generally lower than fecal coliform or somatic coliform concentrations. This trend is consistent with previous studies and ultimately led to the conclusion that E. coli Famp appears to be highly specific for the detection and enumeration of male-specific isolates from environmental water samples (Stewart-Pullaro, 2006).
SOMATIC E. COLI HOST CN13
bacteriophages from the families Myoviridae, Siphoviridae, Podoviridae and
Microviridae (Hyman & Abedon, 2012). While these phages have been examined as “fecal, treatment efficacy, and health effects indicators,” little is known about the specificity of their occurrence in human or animal feces. Furthermore, their taxonomic diversity and lack of convenient detection methods have made it difficult in determining which, if any, are effective as health indicators (US EPA, 2007).
A recent study however, that examined using the E. coli host CN13 in detection of somatic coliphages, was conducted by Hee Suk Lee at the University of North Carolina-Chapel Hill. In order to investigate the reliability of somatic coliphages as viral indicators, survival tests were conducted in order to determine the quantity of specific somatic coliphage families (Ex. Microviridae and
Myoviridae) at differing temperatures. Based on the prevalence of somatic coliphage groups within experimental waters, it was determined that the E. coli
CN13 host was effective in quantifying somatic coliphage levels present. It was also found that the specific virus families tested were likely to be preferred candidate indicators for fecal contamination (Hee Suk Lee, 2009). These
phages belonging to the Microviridae family are promising representatives of human enteric viruses because of their persistence and prevalence in fecally contaminated waters (Hee Suk Lee, 2009).
E. COLI CB390 AND C3000 HOSTS
While E. coli CN13 and Famp hosts are used to determine the presence of somatic and male-specific coliphages respectively, recent studies indicate the use of E. coli CB390 and C3000 as indicators of both. In a study conducted by Carolina Guzman and colleagues (2007), E. coli CB390 was examined for simultaneous detection of both somatic and male-specific coliphages. Ultimately, the host CB390 strain identified lower values of somatic and male-specific coliphages when compared to the sum of phages expected using the International
Organization for Standardization (ISO) and US EPA estimates (Guzman et al, 2007). The CB390 amounts were, however, higher than the amounts determined using the E. coli C3000 host strain. A possible explanation for this may be the fact C3000 has a “narrower spectrum of infecting phages” (Guzman et al, 2007). Methods in this study include the use of double agar layer techniques and findings seem to encourage the use of the CB390 host for quantification of both somatic and F+ coliphages.
THE USE OF RECLAIMED WATER SOURCES
field of public health. Defined as “cleaned” wastewater that has undergone advanced water treatment processes, the ultimate goal of reusing water resources is to improve the overall efficiency and sustainability of water systems so that a greater number of people may have access to potable drinking water (Surendran, 1998). There are also economic incentives as well, since the use of reclaimed water has been proven to be more cost effective long term for economies (Surendran, 1998).
many that highlight the importance of reusing treated wastewater in order to meet the increasing demands of a growing population.
NC RECLAIMED WATER
In an attempt to conserve state water resources, North Carolina legislation enacted new laws concerning the use of reclaimed water. Using reclaimed water sources ultimately aims to reduce both the demand for potable water as well reduce discharge amounts from waste water treatment facilities (WWTF). In a new round of reclaimed water rules adopted in 2011 referred to as the 2U rules, key changes were enacted that established two classes of reclaimed water. Type 1 reclaimed water, which is the lower quality class, is equivalent to the previous reclaimed water standard in North Carolina. Typical uses of this class of water include “irrigation of golf courses, ball fields, and crops such as corn for animal feed” (Drummey-Stiegel et al, 2011). Furthermore, Type 1 reclaimed water has microbial limits based on E. coli and fecal coliform and its microbial standards are slightly less strict than previous ones. This is the case since E. coli and the remaining Type 1 limits have the same numerical criteria as the previous rules, which only included fecal coliform (Drummey-Stiegel et al, 2011).
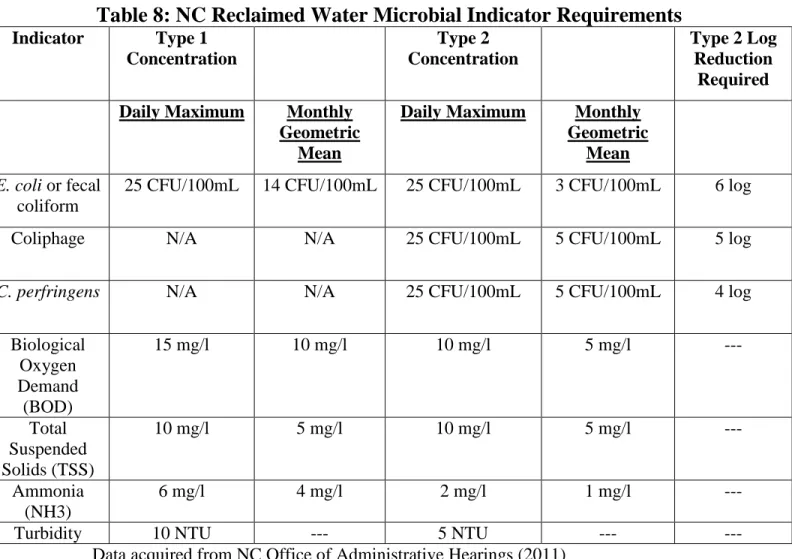
pathogen control requirements” (NC OAH, 2011). These treatment facilities also must meet stricter limits for E. coli as well as stringent microbial limits for indicator levels of coliphages and C. perfringens. Examples of these limits are included in the table below.
Table 8: NC Reclaimed Water Microbial Indicator Requirements
Indicator Type 1 Concentration
Type 2 Concentration
Type 2 Log Reduction
Required
Daily Maximum Monthly Geometric
Mean
Daily Maximum Monthly Geometric
Mean
E. coli or fecal coliform
25 CFU/100mL 14 CFU/100mL 25 CFU/100mL 3 CFU/100mL 6 log
Coliphage N/A N/A 25 CFU/100mL 5 CFU/100mL 5 log
C. perfringens N/A N/A 25 CFU/100mL 5 CFU/100mL 4 log Biological
Oxygen Demand (BOD)
15 mg/l 10 mg/l 10 mg/l 5 mg/l ---
Total Suspended Solids (TSS)
10 mg/l 5 mg/l 10 mg/l 5 mg/l ---
Ammonia (NH3)
6 mg/l 4 mg/l 2 mg/l 1 mg/l ---
Turbidity 10 NTU --- 5 NTU --- ---
Data acquired from NC Office of Administrative Hearings (2011)
OBJECTIVES
To compare and evaluate the single-agar layer (SAL) assay and two step enrichment-spot plate (ENR) method for detection of both somatic and male-specific coliphages in NC-Type II reclaimed waters.
To compare the occurrence of male-specific and somatic coliphages in reclaimed water samples using bacterial hosts E. coli Famp for male-specific coliphages and CN13 for somatic coliphages, each group detected individually.
To test the effectiveness of using bacterial hosts E. coli C3000, C3322 and CB390 in the detection of both somatic and male-specific coliphages simultaneously in reclaimed water.
To compare coliphage concentrations at various levels of reclaimed water treatment: (1) raw sewage, (2) primary and secondary-treated water pre-UV treatment and (3) post-UV treated and chlorinated (final) effluent.
To determine coliphage log10 reductions after treatment of the wastewater samples
by the type 2-like treatment facilities.
Chapter V.
MATERIALS AND METHODS
SAMPLE COLLECTION
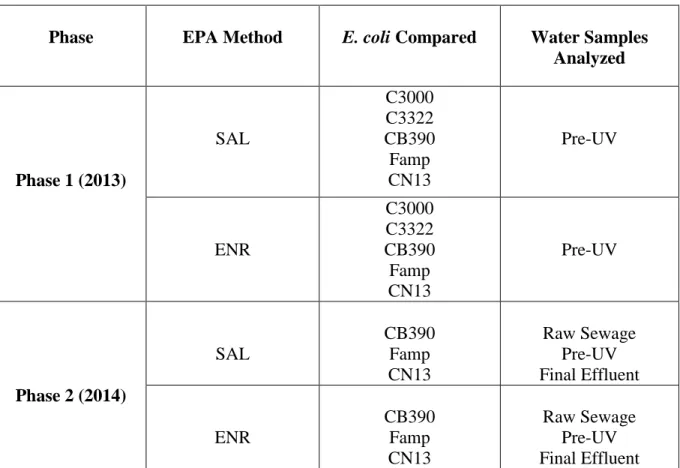
For practical reasons, sample collection and analysis was done in two phases, taking place first in the summer and fall of 2013 and then again in the summer of 2014. In Phase 1 of the study (23 June 2013 – 29 October 2013), 11 samples were collected and processed while 28 samples were analyzed in Phase 2 (20 May 2014 – 11 August 2014).
layer (SAL) and enrichment-spot plate (ENR) methods on five E. coli hosts (C3000, C3322, CB390, Famp and CN13), while only three hosts (Famp, CN13 and CB390) were studied in Phase 2. Only physically and chemically treated (“Pre-UV” irradiation) samples were analyzed during Phase 1 of the study while Phase 2 samples included raw sewage and treated effluent (post-UV) samples in addition to the “pre-UV” ones.
Table 9:
E. coli
Hosts with Respective Coliphages
Adapted from Coliphage Bench Sheet (Bailey & Witsil, 2014).
Preparation of Overnight E. coli Host and Antibiotics (Day One)
Prior to the start of sample inoculation into culture media with E. coli hosts, culture materials were prepared. Antibiotic stock solutions were prepared (Table 10) and overnight E. coli hosts were grown in 25 mL volumes of tryptic soy both (TSB). These antibiotic stock solutions were required in order to suppress the growth of competitive bacteria within the media, while E. coli hosts were needed to support the growth of the coliphages. For overnight cultivation of E. coli hosts, cells from a frozen stock of the E. coli host were inoculated into 25 mL of TSB supplemented with 0.25 mL of 100X antibiotic stock and incubated at 37oC on a shaker tray (90-100 rpm) overnight for 18-24 hours.
E. coli Host Detectable Coliphages Antibiotic
Famp F+ male specific coliphages Strep-amp (streptomycin and ampicillin)
CN13 Somatic coliphages Nalidixic acid
CB390 Both (male-specific and somatic coliphages)
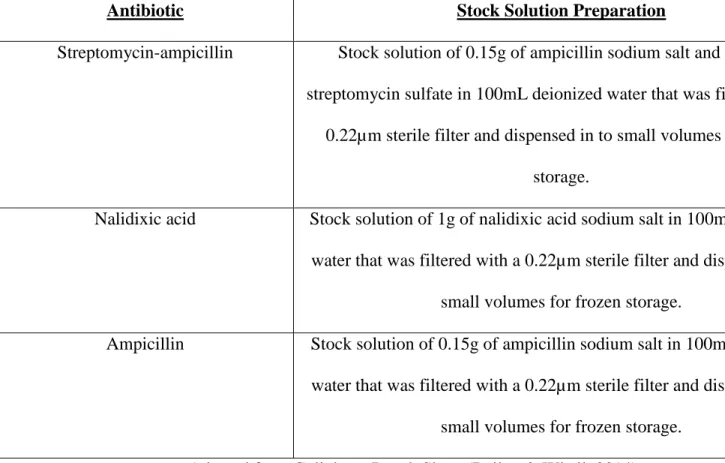
Table 10: 100x Antibiotic Stock Solution Preparation
Adapted from Coliphage Bench Sheet (Bailey & Witsil, 2014)
Log Phase E. coli Host and Agar Media Preparation (Day Two)
At the beginning of Day 2 during experimentation, log phase E. coli host was prepared for the growth of the coliphages. For this step, 50 mL of sterile tryptic soy broth was mixed with both 0.5 mL of the appropriate antibiotic and 0.5 mL of the previously prepared overnight host where the mixture was then incubated at 37oC on a shaker tray for 1.5-3 hours depending on the host (Famp: 1.5 hours, CN13 & CB390: 2-3 hours). The turbidity of the E. coli broth culture was then analyzed for achievement of appropriate turbidity levels between 0.2-0.8
Antibiotic Stock Solution Preparation
Streptomycin-ampicillin Stock solution of 0.15g of ampicillin sodium salt and 0.15g of streptomycin sulfate in 100mL deionized water that was filtered with a
0.22µm sterile filter and dispensed in to small volumes for frozen storage.
Nalidixic acid Stock solution of 1g of nalidixic acid sodium salt in 100mL deionized water that was filtered with a 0.22µm sterile filter and dispensed in to
small volumes for frozen storage.
Ampicillin Stock solution of 0.15g of ampicillin sodium salt in 100mL deionized water that was filtered with a 0.22µm sterile filter and dispensed in to
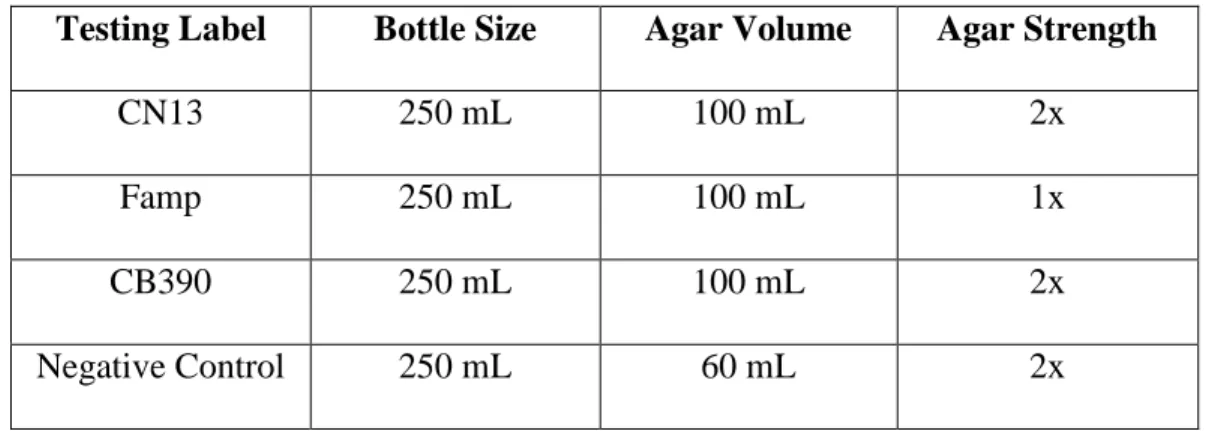
nephelometric turbidity units (NTU). Following preparation of log phase E. coli
host, agar media was made and kept molten (Table 11) by placing it in a 45-48oC
water bath to prevent hardening.
Table 11: Agar Media Preparation: ENR
Testing Label Bottle Size Agar Medium
and Volume
Agar Strength
Enrichment Assay 250 mL Tryptic soy agar medium plus antibiotics, 90 mL
1x
Adapted from Coliphage Bench Sheet (Bailey & Witsil, 2014)
Preparation of Dilution Tubes and Enrichment-Spot Agar Medium Plates (Day Two)
Also taking place on Day 2 of the experiment, sample broth culture tubes were prepared. After inoculating the E. coli host in 100 mL of water sample, the
quantifiable coliphage concentrations. This was done by suspending 0.01 mL of raw sewage sample in 99.99 mL of deionized water in order to complete a 10-4
dilution. After preparing the water samples in broth culture medium, volumes of 32 mL, 3.2 mL and 0.32 mL were dispensed in triplicates into labeled tubes that were then incubated overnight at 37oC.
To make the enrichment-spot plates, autoclaved tryptic soy agar was placed in 45-48oC water and allowed to temper. Following this, 3.0 mL of E. coli
host strain culture was added along with 0.3 mL of appropriate antibiotic to 30 mL volumes of the tryptic soy agar media and the mixture was then poured into labeled, sterile 150 mm petri dishes. The agar medium-host cell mixture was allowed to harden for 15-20 minutes and the plates stored at 4oC overnight.
Enrichment Assay Plate Spotting (Day Three)
The solution was allowed to soak into the agar medium for approximately 15-20 minutes and the plates were then inverted and incubated at 37oC for 18-24 hours.
Interpretation of the Enrichment Results (Day Four)
On the fourth and final day of testing, spot plates were examined with positive zones of lysis being present (Figure 2A). These zones of lysis indicate the
presence of coliphages in the enriched water sample volumes that were allowed to grow overnight at 32, 3.2 and 0.32 mL increments. Based on the relative patterns of the 9 spotted samples grown at the three concentrations (32, 3.2 and 0.32), positive results were entered into an MPN calculator where MPN/100 mL was calculated. Certain difficulties did arise, however, with regards to determining the absence/presence of coliphages within the samples. If the zone of lysis is small, for example, or the growth of unwanted bacteria obscures the zone of lysis, one may be unable to determine with certainty whether or not coliphages are truly present. Therefore, training is needed in order to effectively interpret the results when using the ENR method. Once results were recorded, the data was input into an MPN calculator where MPN concentrations, along with their respective 95% confidence intervals, were calculated.
Statistical Analysis of the ENR Samples