Statement of the Problem and Specific Aims
Since 1980, the number of obese children and adolescents in the United States has tripled. According to the CDC, 17% or 12.5 million children are categorized as obese (1). The health risks associated with childhood obesity are immediate and long-term. Obese children are at risk for developing high blood pressure, type II diabetes, high cholesterol, sleep apnea, bone and joint problems (1, 2). They are more likely to suffer social and psychological issues including discrimination, depression and poor self-esteem. Furthermore, once established in childhood, obesity and associated health problems will most likely continue into adulthood (3).
Farm to School (F2S) programs are becoming an increasingly popular approach for addressing student
nutrition and overall health; however, few programs have been rigorously evaluated to test their impact in these areas. The United States Department of Agriculture (USDA) is poised to award $3.5 million dollars in grant funds for Farm to School programs, presenting an opportunity to expand the evidence base for obesity prevention. The planned evaluation for these grants is focused almost entirely on the important questions of procurement and economic benefits to farmers, and not the obesity prevention potential, because of the interests of the funding agency (the USDA). Because USDA, CDC, and other funders are dedicating increasing amounts of resources to farm to school programming, it is vital to also understand the potential impact on dietary intake and physical activity related to obesity. Drawing on our prior experience evaluating the National Farm to School Network efforts, we propose an evaluation to assess the USDA-funded school-based Farm to School programs’ potential to impact obesity and the health of students and to examine the barriers and facilitators to project implementation. We will use tools developed and validated as part of our prior National Farm to School Network evaluation, refining them further in the process. We further propose to add value to this evaluation implementing a system to disseminate the results of the most promising Farm to School models and providing a web-based toolkit and technical assistance to assist schools with
implementation of best practices.
Due to the scope of the childhood obesity epidemic, there has been a shift “upstream” toward environmental and policy interventions that facilitate behavior change at the population level. Unfortunately, the evidence base for such interventions is currently very limited. What is called for are rigorous evaluations that expand the evidence base for obesity prevention and clarify the complex issues surrounding implementation and
maintenance of such programs. The imminent awarding of Farm to School projects by the USDA offers an excellent opportunity to develop an evaluation that will complement, but not duplicate the procurement and farmer economic benefits evaluation efforts of the USDA. Because the USDA Farm to School grants are slated to be awarded in mid-November 2012, the time-sensitive nature of this grant mechanism is the only viable option that would allow us to capture baseline data to take advantage of this unique research opportunity. While we have based our research design strategy on the RFA for the USDA grants, we will likely need to make some adjustments in study design and measures as soon as we are able to review the funded grant protocols, giving us the opportunity to standardize some measures across sites. We are working closely with the National Director for the USDA’s Farm to School Program (see letter) to assure a timely approach to this process.
Specific Aims:
Aim 1: Evaluate the impact of USDA-funded Farm to School programs on student diet, physical activity/sedentary behavior, and health.
Aim 2: Use the RE-AIM model to assess the reach, effectiveness, adoption, implementation and maintenance of USDA-funded Farm to School programs, identifying facilitators of and barriers to program
implementation and maintenance.
Aim 3: Use the results from Aims 1 and 2 to identify promising evidence-based obesity-related F2S interventions, implementation strategies and program adaptations and package these findings for dissemination and implementation through the Center for Training and Research Translation.
Hypotheses: Students in comprehensive Farm to School projects will experience greater increases in fruit and vegetable consumption; improved knowledge and attitudes about nutrition, gardening, and farming; and
Research Strategy: A. Significance
Childhood Obesity. More children than ever before are suffering the consequences of obesity. Approximately 17%, or 12.5 million, American youth are obese (1), with prevalence disproportionately higher among Mexican-American boys and non-Hispanic black girls (1). Obese youth are at risk for immediate and long-term health problems. Compared to their normal-weight-counterparts, obese youth are more likely to have high blood pressure, type II diabetes, high cholesterol, sleep apnea, bone and joint problems (2). They are more likely to experience social and psychological issues including discrimination, depression and poor self-esteem (2). Furthermore, obese youth are more likely to become obese adults. One study found that 80% of children who were overweight at the ages of 10-15 years were obese at the age of 25 (3). This is cause for alarm as obesity in adulthood is associated with a number of chronic diseases including heart disease, type II diabetes, stroke, several types of cancer, and osteoarthritis, which all totaled accounts for $147 billion in medical care costs nationwide (4,5). The prevalence and long-lasting effects of childhood obesity call for urgent action to identify and implement effective interventions to prevent this growing problem.
Factors Affecting Obesity. There is no single factor responsible for obesity and it’s increasing prevalence. However, poor food choices and lack of physical activity tip the scales toward excess weight gain. Research shows that children are not meeting dietary recommendations. For example, one study found that children and adolescents in the United States get nearly 40% of their total daily calories from solid fats and added sugars (6). Energy-dense foods lack the nutrients children need for proper growth and development (7) and put them at risk for obesity (8,9). Meanwhile, fruit and vegetable consumption among children in the U.S. is suboptimal. Data from the 2011 Youth Risk Behavior Surveillance indicate that only 22.4% of adolescents in grades 9 through 12 eat three or more servings of fruit per day; and only 15.3% eat three or more servings of vegetables per day (10). The burden of obesity falls disproportionately on low-income and minority children. They are less likely to have access to and consume healthy foods like fruits and vegetables (11). They are also more likely to be exposed the harmful food advertising that has been shown to affect dietary intake (12). This is concerning because diets rich in fruits and vegetables are recommended for healthy weight maintenance and have been associated with reduced risk of certain diseases (13). Several studies have demonstrated that gardening and garden-based nutrition education can increase children’s intake of fruits and vegetables (14-17) and we found a link between parents who are regular purchasers of local foods having children who eat at least five fruits and vegetables per day (manuscript under review, see Appendix).
Physical Activity/Sedentary Behavior in Children. It is recommended that children engage in at least 60
minutes of moderate to vigorous physical activity each day and limit sedentary screen time to less than 2 hours per day (18-21). However, children for the most part are not meeting this physical activity goal. A recent study indicates 42% of 6-11 year olds and a mere 8% of 12-19 year olds obtain 60 minutes of physical activity on a daily basis (22). The study also found significant gender, ethnic, age, and BMI disparities; males (49%), African Americans (66%), adolescents (56%), and obese children (59%) are more likely to spend two or more hours engaged in sedentary behaviors (23). It is thought that sedentary behaviors such as
television/videos/DVD viewing, playing video games and computer usage, are especially harmful because they can negatively impact physical activity as well as diet by displacing physical activity, exposing children to food advertising and encouraging snacking on unhealthy foods (25-29).
community. School-based interventions offer a practical and promising way to address the issue of childhood obesity.
Farm to School. Farm to School (F2S) programs are relatively new yet gaining popularity as an approach to addressing student nutrition and overall health. For the 2011-2012 school year, there are an estimated 12,429 schools in all 50 states involved in F2S programs (www.farmtoschool.org/). F2S programs link schools and local farms to serve healthy school meals, improve student nutrition, and provide agricultural, food and nutrition learning opportunities while supporting local farmers. Programs vary by the community and its resources, needs, and concerns. Although programs are diverse, the key elements of F2S programs include:
procurement of local farm products by schools; experiential learning; school gardens; taste tests; farm visits; and cooking lessons. Evaluating the impact of F2S has been hindered by insufficient time, resources,
appropriate tools, and funding (35). A review of programs that have been evaluated suggests F2S and school garden projects, both promoting locally grown foods, can have a positive impact on knowledge, attitudes and behaviors that influence dietary intake and sedentary behaviors (36-38). However, these findings should be considered preliminary as many of these studies lack rigorous evaluation designs. Our own team conducted a evaluation of F2S programs; however, the study included just four schools and there was limited assessment of behavioral outcomes (see Farm to School Program Evaluation Report in Appendix). With increasing resources invested in F2S programs, there is a need for more rigorous long-term evaluation of the impact of F2S on diet and other obesity-related behaviors and outcomes (e.g. physical activity/sedentary behavior, BMI), among children.
Evaluating Interventions to Create Healthier Food Environments. The evidence base for intervening to create healthier food environments is limited.One approach to building the evidence base is to take advantage of “emerging and ongoing interventions as sources of practice-based evidence” (Institute of Medicine report: Bridging the Evidence Gap in Obesity Prevention, page 160). Glasgow (Director, Implementation Science, NCI) and Green (member of IOM Task Force) have long argued for the value of practice-based evidence (39) for improving implementation and dissemination. With this approach, practitioners draw on the available
evaluation/research evidence and blend it with local data, expertise, and experience to develop and implement interventions. The evidence generated through this approach has the advantage of greater “inherent
relevance” to real world practice than evidence generated by interventions developed and implemented by researchers (40). Rigorous evaluations of practice-based interventions can provide the additional advantage of contributing evidence on the implementation processes used, the populations reached, adaptations that did and did not work, and challenges encountered (41). Findings from these interventions can also include details on the resources required and a variety of tools that others can use such as promotional materials, evaluation approaches, and protocols. In other words, evaluations of practice-based interventions can “offer practical direction (including strategies to pursue and to avoid) for other teams and organizations facing similar problems” (Ritzwoller et al 2009, p.81) (42). For these reasons, we are proposing to evaluate the context specific obesity-related impact of farm to school programs designed and implemented by practitioners rather than a top down standardized approach across all sites. While this is “messier” from a research perspective, we believe that it in the long run it will provide a more accurate view of impact and allow us to determine factors associated with success and failure. The USDA projects that are about to be funded give us an excellent opportunity to do this but we must act quickly.
Translation and Dissemination Practitioners need the best available evidence in formats they can use to develop evidence-based interventions. Practitioners report that they have difficulty accessing and using evidence because it often is provided in formats that are difficult to use and not relevant to their contexts (43, 44). For evidence to be used in practice, it needs to be translated to maximize relevance and packaged in formats that are useable to practitioners. A growing number of scholars advocate taking a “customer-oriented approach” to dissemination whereby evidence packaging and distribution are customized to the needs and preferences of a defined audience of practitioners (45-47).
be implemented and evaluated by practitioners. For these reasons, we will be working with the Center for Training and Research Translation (described below) to address Aims 3 and 4 of the project.
B. Innovation
Farm to School projects are fairly new programs with a limited number of rigorous evaluations. Our team conducted the National Farm to School Network evaluation
(http://www.farmtoschool.org/publications.php?pt=eval), designed to obtain a broad understanding of the scope and functioning of F2S efforts in the areas of policy, media/marketing, and training/technical assistance. As a part of this study, we developed and validated innovative tools to assess outcomes including a School Lunch Recall survey and a Fruit and Vegetable Neophobia Instrument (see tools and validation studies in the Appendix). While national in scope, in the area of obesity-related impact, this evaluation included only four, very diverse, F2S programs using limited behavioral assessment data. A clear finding from this project was the diversity of approaches to implementing F2S programs. The USDA Farm to School Grant Program will fund as many as 30 projects, providing us a chance to structure a sound evaluation plan that includes standardized measures allowing for comparison of these different approaches and compilation of data across projects. Drawing on our prior experience with F2S programs, we will also be able to tailor measures and evaluation approaches to different contexts. See logic model below.
C. Approach: Overall Strategy
Overview. USDA will announce their Farm to School grantees in mid-November 2012. Farm to School program implementation is not expected to begin until the Spring of 2013, giving our team time to prepare in advance of meeting with grantees at their national meeting and collecting baseline data. Once grantees’ contracts are in place, we will work with each project to assure that our evaluation strategies focused on nutrition and obesity are coordinated with each F2S programs’ goals and objectives and complement their proposed evaluations focusing on procurement and economic benefits to farmers. To the extent possible, we will standardize the basic nutrition/obesity measures across funded sites. We will require that each project allow us access to at least 30 students from which to collect data. We recognize the need to limit disruption of school routines, and have extensive experience working with schools to conduct research and collect data (see Preliminary Studies section below). For example, the School Lunch Recall, a dietary assessment tool
developed as part of the National Farm to School Network Evaluation, was designed to be self-administered by students in a brief amount of time (48). Each grantee will receive up to $1000 in garden and kitchen equipment in exchange for the data collection, depending on the final number of projects funded by the USDA. Because there are many volunteers associated with F2S programs, we believe we will be able to recruit and train data collectors from the local community, supervised by our research staff.
Logic Model for Evaluation of the Impact of the USDA Farm to School Projects on Child Health
Assumptions Inputs/Resources Activities Outputs Outcomes Impact Increasing rates of childhood
obesity, largely due to poor dietary habits, limited availability and accessibility of healthy food options, and inadequate physical activity
Exposure to F2S programs and policies may improve nutrition knowledge, attitudes and behaviors (KAB) and physical activity of children
Local communities will support F2S efforts due to the potential benefits on child nutrition as well as economic development.
State and local child nutrition policies can have a positive impact on children’s KAB related to dietary and physical activity habits associated with obesity
USDA grant funds
Buy-in from school community, school food service staff, teachers, parents and students
Local farmers selling to schools
Child Nutrition programs in schools
Community partnerships
Not-for-profit organizations promoting F2S and local agriculture
Procurement policies that support the purchase of locally grown foods
Educational components (school, gardens, farm tours, cooking classes, taste tests, dinners with families, social marketing campaigns) related to F2S
Incorporate local food into school meals
Measure changes in food-related knowledge and attitudes, fruit and vegetable
consumption, physical activity and BMI
Assess facilitators and barriers to F2S program
implementation and maintenance
Increase purchasing of local agricultural products by schools
Increased awareness of food sources and nutrition
Promising interventions, program adaptations and implementation strategies Packaged interventions to facilitate F2S implementation and evaluation
Webinars to provide technical assistance to schools interested in F2S programs
Short-term: Increase in accessibility to fruits and vegetables from local farms in schools
Improvement in attitudes toward eating new fruits and vegetables
Identify and analyze policies that influence school participation in F2S
Decrease itime children spend in sedentary activities
Aim 1: We will evaluate the impact of each USDA-funded F2S program on students’ diet and additional health behaviors. There is some evidence to date that F2S programs can have an effect on food knowledge,
attitudes, and behavior (50, 51). Further, there is reason to believe that F2S programs that incorporate gardening activities may decrease sedentary behavior (37, 38).
Aim 1 - Plan for Evaluation of impact on students’ diet and additional health behaviors
We will build on tools developed and validated as part of HPDP’s National Farm to School Network Evaluation to assess the effectiveness of each F2S program to positively influence students’ diet and health (48, 49). The outcome evaluation will measure short-term (access to local foods, food knowledge and attitudes, willingness to try new fruits and vegetables), intermediate-term (consumption of fruits and vegetables and sedentary behavior) and long-term outcomes (BMI). Demographic data (age, gender, race and ethnicity) will be collected to assess the representativeness of outcomes, i.e. are those most at risk for overweight and obesity being impacted by the F2S programs. Additional indicators may be evaluated depending upon the nature of each F2S program, however a standardized protocol will be used to evaluate all grantees.
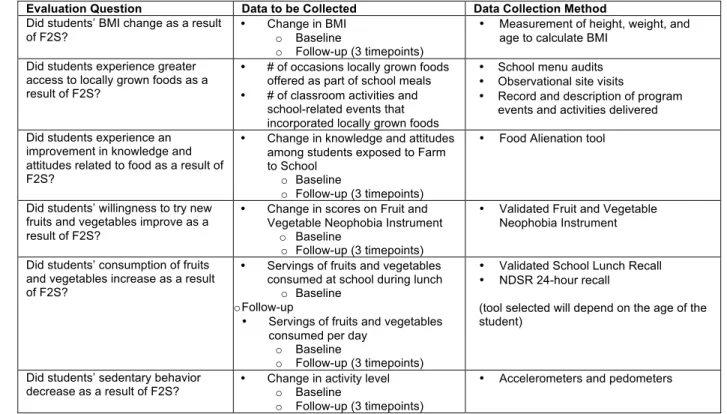
Table 1. Evaluation Plan Matrix for Aim 1
Measurement
Measurements will be collected in 4 waves during the evaluation process: prior to F2S program implementation with follow-up measurements collected in the Spring of Years 2, 3 and 4 to reduce the chance of confounding by seasonal variation in dietary and physical activity patterns. During Wave 1, baseline data for all outcome measures (BMI, knowledge, attitudes and behaviors) will be collected. Wave 2 will serve as an assessment of changes in outcome measures. Waves 3 and 4 will assess maintenance of changes and allow for trajectories to be mapped.
Food-related knowledge and attitudes. We will use a tool measuring “food alienation” developed and tested in both adults and youth by our team. It contains nine different scales pertaining to attitudes about food; of which we will use the grocery shopping, cooking skills, attitudes about farming, attitudes about gardening, and attitudes about food production scales. Items come from several sources, the National Farm to School
Evaluation Question Data to be Collected Data Collection Method Did students’ BMI change as a result
of F2S? • Change in BMI o Baseline
o Follow-up (3 timepoints)
• Measurement of height, weight, and age to calculate BMI
Did students experience greater access to locally grown foods as a result of F2S?
• # of occasions locally grown foods offered as part of school meals
• # of classroom activities and
school-related events that incorporated locally grown foods
• School menu audits
• Observational site visits
• Record and description of program
events and activities delivered
Did students experience an improvement in knowledge and attitudes related to food as a result of F2S?
• Change in knowledge and attitudes
among students exposed to Farm to School
o Baseline
o Follow-up (3 timepoints)
• Food Alienation tool
Did students’ willingness to try new fruits and vegetables improve as a result of F2S?
• Change in scores on Fruit and Vegetable Neophobia Instrument
o Baseline
o Follow-up (3 timepoints)
• Validated Fruit and Vegetable Neophobia Instrument
Did students’ consumption of fruits and vegetables increase as a result of F2S?
• Servings of fruits and vegetables consumed at school during lunch
o Baseline o Follow-up
• Servings of fruits and vegetables
consumed per day o Baseline
o Follow-up (3 timepoints)
• Validated School Lunch Recall
• NDSR 24-hour recall
(tool selected will depend on the age of the student)
Did students’ sedentary behavior
decrease as a result of F2S? • Change in activity level o Baseline o Follow-up (3 timepoints)
Evaluation, the North Carolina Child Health Assessment and Monitoring Program (CHAMP) survey and valid and reliable questions from prior research (52-55). The Cronbach’s alphas for the scales (0.61 to 0.89, mean 0.80) indicate moderate to high reliability in adults and medium reliability in a small (n = 60) sample of middle and high school students in rural North Carolina (0.43 to 0.87, mean 0.64) (unpublished data).
Food preferences. The Fruit and Vegetable Neophobia Instrument (FVNI) developed and validated by our team for the National Farm to School Network Evaluation will be used to measure student attitudes toward trying new fruits and vegetables. The survey is an 18-item self-administered paper and pencil questionnaire. It is divided into separate fruit and vegetable subscales with nine identical items asked about each. Questions pertain to preferences for fruits and vegetables and willingness to try them in different situations and settings. The tool has recently been validated in assessing fruit and vegetable neophobia among third- to fifth-grade students (8-10 year olds) at elementary schools in California and Oregon (49). A combination of strategies (Generalized Least Squares and Maximum Likelihood factor) was used to examine the psychometric properties and construct validity of the subscales. Cronbach’s alphas for the fruit subscale and vegetable subscale, 0.832 and 0.917 respectively, indicate high reliability. In our study with 60 rural youth from North Carolina, the Neophobia scale achieved a Cronbach’s alpha of 0.87, providing further evidence of high reliability (unpublished data). The FVNI is currently being implemented at all ten FoodCorps sites (http://foodcorps.org/). See Appendix for tools.
Dietary intake/Fruit and vegetable consumption. Two tools will be used to measure fruit and vegetable consumption, the School lunch Recall (SLR) and NDSR 24-hour dietary recall. Tool selection will depend upon the age of students participating in each F2S program.
• The SLR was developed and validated by our team as part of the National Farm to School Network Evaluation to be an efficient and cost-effective alternative to 24-hour recalls and other commonly used dietary assessment tools and to address issues associated with young children completing 24-hour recalls (56-61). It will be self-administered by students immediately after lunch for five consecutive days. The tool consists of four questions for each item on the National School Lunch Program’s lunch menu with four additional questions that inquire about fruits and vegetables brought from home and consumed during lunch. Fruit and vegetable servings are based on standardized school-meal portion sizes for each item (48). Using data from the National Farm to School Evaluation, the SLR proved to be a valid tool compared to meal observations for assessing the school lunch intake of third- to fifth-grade students. Omission rates, intrusion rates and total inaccuracy were low and similar to results from other meal recall studies with children (48). See Appendix for tool.
• Dietary intake of older students (over the age of 12) will be assessed by collecting three 24 hour dietary recalls (two weekdays and one weekend day) selected at random and at four points in time. Recalls will be conducted by trained and certified staff of the National Institutes of Diabetes and Digestive and Kidney Diseases (NIDDK) funded UNC Nutrition Obesity Research Center (NORC) Diet Assessment, Physical Activity and Body Composition Core (Core) (directed by Dr Mayer-Davis) using the Nutrient Data System for Research (NDSR) software. Recalls will be used to describe food and nutrient intake, and the extent to which fruits and vegetables are consumed. Core staff will conduct recalls over the telephone with children, and with the aid of the parent as necessary (56, 57, 62), per standard protocols (63).
Sedentary time. Sedentary time will be assessed using ActiGraph accelerometers (models GT1M and GT3X) and Omron HJ-105 pedometers to monitor students’ activity level at four points in time. Accelerometers can provide accurate measures of the intensity, duration and frequency of physical activity, whereas pedometers only measure steps taken during ambulatory behaviors. Accelerometers, however, are far costlier than
classify physical activity intensity: sedentary activity ≤ 100 counts per minute (cpm), low intensity physical activity >100 cpm, moderate intensity physical activity 2220, vigorous physical activity 4136 (69). Due to the nature of the children’s physical activity patterns, i.e. frequent short bursts of activity, a 15-second epoch will be used on accelerometers for collecting and recording data (70). Descriptive analyses will be conducted to
calculate steps per minute (SPM) for pedometers and time engaged in moderate intensity physical activity for accelerometers, respectively. Correlation analyses will be conducted to compare the pedometer’s SPM with the accelerometer’s moderate intensity physical activity (65).
Anthropometrics. Height and weight to obtain body mass index (BMI) will be measured at four points in time using a stadiometer and calibrated scales, without shoes and in light clothing. Examiners will receive training on standardized protocol prior to taking measurements (71). Each participant will be classified into 1 of 4 weight categories described by the Institute of Medicine: underweight (BMI for age less that the fifth
percentile); normal weight (BMI for age from the fifth to 84.9th percentile); overweight (BMI for age from the 85th
to 94.9th percentile) and obese (BMI for age ≥95th percentile) (72).
The development of sampling techniques for schools/classrooms will depend on grantee protocols. We will work with each F2S program to develop a plan for survey administration that makes the most sense. This may mean that teachers, cafeteria staff, or volunteers will administer the surveys. Each grantee will receive up to $1000 in garden and kitchen equipment in exchange for this, depending on the final number of projects funded. Research staff will provide training and written protocols for survey administration. We will work with grantees to determine if a control evaluation design is possible at the school or classroom-level because their protocol calls for phased-in F2S programs.
Aim 1 Statistical Analysis
Objective A: To analyze which Farm to School project characteristics are related to our outcomes of interest (change in consumption of fruit and vegetables servings, BMI, sedentary behavior, food knowledge and attitudes). We expect that F2S projects with multi-pronged approaches and greater sustainability after the USDA grant funding ends will see increases in F&V consumption and food knowledge and attitudes and decreases in BMI and sedentary behaviors that are maintained over the 4 points in time of this evaluation.
Objective B: To determine whether there is a pattern of change in key indicators of F2S success (increases in F&V consumption, food knowledge and attitudes, BMI, and sedentary behavior) that support obesity
prevention. It is expected that there may be different patterns of health indicator trajectories based on implementation approach, school characteristics, and sustainability of the F2S project.
General Analytic Strategy. We will summarize baseline, follow-up, and change data from each measure (see table 1) for each funded F2S project using descriptive statistics such as means, medians, quartiles, standard errors and 95% confidence intervals. Changes in means and proportions will be compared to proposed changes in each funded project whenever possible otherwise, we will use primarily changes to assess effects of each project. In addition, we will compare pre-post changes using paired t-tests and McNemar tests for continuous and binary outcomes, respectively. We also plan to compare differences in changes between different projects to identify more effective projects using t-tests or chi-square tests again for continuous and binary outcomes, respectively. If more than one school collected data for a given project, we will take into account the school effect (i.e. correlated data within schools) by using generalized linear mixed models (GLMM). We will consider combining data from projects that took similar approaches with their F2S projects and analyze similarly as above, on their own. Furthermore, we will consider obtaining cost data associated with implementing each project and estimate cost associated with unit changes in our measures and compare these costs across projects in a descriptive fashion.
We will also conduct longitudinal analyses to assess changes over time for each project and compare response profiles across projects using GLMMs.
race/ethnicity of each student participant. If any of these school or individual level characteristics differs between any two projects we compare, we will include them as covariates in GLMMs.
Sample size and power calculation
For this study, we realize that sample size for each project can be different. We plan to have uniform data for all measures listed in Table 1 from all study participants for each project except for the measure of 24 hour dietary recall for which we plan to have data from at least 30 students for each project if all 30 potentially projects involve schools (900 from all projects). We expect that a portion of the projects may not involve schools. The sample size of 30 students for a project provides 80% power to detect a moderate effect size of 0.51 using a two-sided paired t-test at α=0.05 level.
Aim 2: We will evaluate the barriers and facilitators associated with implementation of each Farm to School program including existing and new local policies that support the implementation and maintenance of each Farm to School program.
Objectives:
• To identify barriers and facilitators to implementation and maintenance of each Farm to School program through interviews and focus groups with key informants.
• To collect and analyze information on the reach, adoption, implementation fidelity and maintenance of each Farm to School program.
• To identify and analyze state and local policies and their impact on each Farm to School program.
Aim 2 - Plan for Evaluation of Barriers and Facilitators to Implementation and Maintenance:
We will use the RE-AIM model to evaluate Aim 2, assessing the reach, effectiveness, adoption, implementation fidelity and maintenance of F2S programs (73, 74). We will focus on identifying barriers and facilitators to implementation and maintenance of F2S programs using qualitative methods including interviews and surveys of stakeholders. We will also identify and analyze school district, local and state policies for their potential impact on F2S programs.
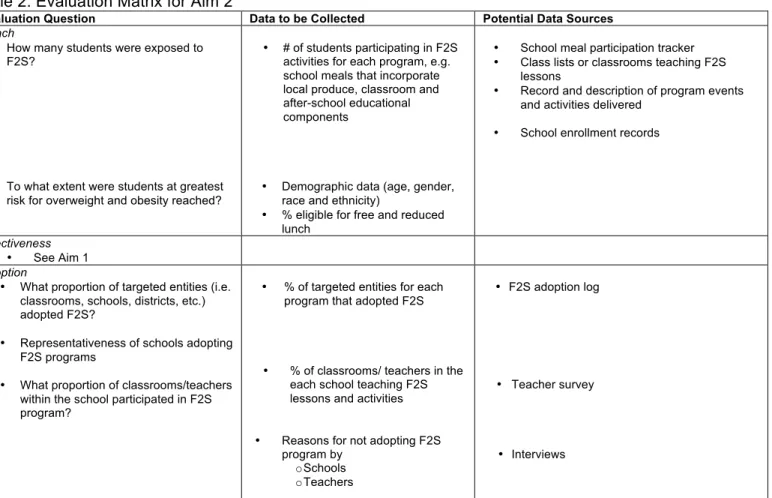
Table 2: Evaluation Matrix for Aim 2
Evaluation Question Data to be Collected Potential Data Sources Reach
• How many students were exposed to F2S?
• To what extent were students at greatest risk for overweight and obesity reached?
• # of students participating in F2S activities for each program, e.g. school meals that incorporate local produce, classroom and after-school educational components
• Demographic data (age, gender, race and ethnicity)
• % eligible for free and reduced lunch
• School meal participation tracker
• Class lists or classrooms teaching F2S
lessons
• Record and description of program events and activities delivered
• School enrollment records
Effectiveness
• See Aim 1 Adoption
• What proportion of targeted entities (i.e. classrooms, schools, districts, etc.) adopted F2S?
• Representativeness of schools adopting
F2S programs
• What proportion of classrooms/teachers
within the school participated in F2S program?
• % of targeted entities for each program that adopted F2S
• % of classrooms/ teachers in the each school teaching F2S lessons and activities
• Reasons for not adopting F2S program by
o Schools o Teachers
• F2S adoption log
• Teacher survey
Implementation
• Fidelity to program components
• Adaptations to program during study
• Barriers to implementation of F2S
programs
• Innovative implementation strategies
• How acceptable, feasible and
affordable was F2S program implementation?
• # of planned program activities
carried out/delivered
• Perceptions of key stakeholders regarding barriers and facilitators to program implementation
• Cost of program implementation
• Perceptions of key stakeholders
regarding resources required to implement program
• Activity logs
• Interviews
• Accounting/financial records
• Interviews
Maintenance
• Is the F2S program ongoing at >6 months after USDA grant funding ends?
• If and how F2S program was
adapted long-term?
• If and how F2S program has been institutionalized?
• Evidence of ongoing activities
• Perceptions of key stakeholders
regarding maintenance of the program and how it has changed over time
• Observational site visits
• Interviews
Measurement
Dr. Maihan Vu, Qualitative Evaluation Specialist, will be leading Aim 2 in collaboration with Dr. Molly De Marco (Co-Investigator and Evaluation Director) and Amy Paxton (Evaluation Coordinator). We will work with each F2S program to develop a plan to carry out process evaluation measures with protocols that are
complementary and not duplicative of what the USDA is requiring. The school food service director and staff, teachers, and administration will be involved in monitoring various aspects of program reach, adoption and implementation. We will develop forms for tracking based on the activities of each F2S program.
Barriers and Facilitators to Implementation and Maintenance. In order to assess relevance and values related to the F2S Programs, we will conduct in-depth interviews with up to 5 participants at each school identified as stakeholders who took part in the F2S Program. In-depth interviews establish a one–to-one relationship between interviewer and respondent, where information comes from the thoughtful reflection of one person aided by exchange with an interviewer. These individual interviews encourage participants to share their experiences in depth within a format with maximum privacy and intimacy. Programs like Farm to School require multiple stakeholders working together to implement core programming elements, and as a result each stakeholder has different experiences and expertise from engaging in the process. We will purposefully sample participants to insure that foodservice directors, foodservice staff, and teachers are
represented. Interview guides, created as part of the National Farm to School Network Evaluation, will be used to facilitate discussions with stakeholders and identify facilitators and barriers to implementation and
maintenance, program adaptations, and innovative implementation strategies (see Appendix for guides). Participants will be asked about their values, relevance of F2S Programs in their lives, and barriers and facilitators to program implementation and maintenance. To complement the interviews, we will use semi-structured surveys, in an effort to further understand individual, interpersonal, and community factors relevant to adopting F2S programs. Interview participants will be informed of the study’s purpose, given a chance to ask questions, and will sign an informed consent form before starting the interview, which will be taped and
transcribed verbatim.
Participants completing surveys will be provided with an informed consent statement, explaining the study’s purpose, the voluntary nature of the survey and information about who to contact with questions.
Impact of State and Local Policies. In order to assess current local and statewide policies as well as to gauge the level of impact on each F2S program, we will conduct in-depth interviews with key National and Regional Farm to School Network Staff leaders regarding their policy initiatives and/or administrative changes as related to the F2S Programs. We will also identify and conduct a content analysis of the policies at the school, school district, city, county and state levels that have the potential to impact F2S programs (e.g. school wellness policies, nutrition standards, buy local purchasing and procurement policies). Program records, evaluation plans, and documents will be reviewed to assess the economic, social/political and
technical/technological feasibility and impact. Lastly, direct site visit observations will be integrated to provide detailed descriptions of the behaviors, activities, and actions that may influence implementation and
Qualitative Data Management and Analysis. All qualitative data analysis will be directed by Dr. Maihan Vu at the UNC Center for HPDP Qualitative Research Unit (QRU). Respondents will not be identified in any of the files. Each transcribed file will be given a unique electronic name.
Members of the research team will review each file for accuracy and completeness. A qualitative data analyses software program, ATLAS.ti 6.2, will facilitate the analysis. Data from all of the qualitative instruments will be combined and synthesized into one shared database. A deductive and inductive process will be used to create a coding scheme (75, 76). Prior to data collection a provisional list of codes will be created from the
conceptual framework, the list of research questions, hypotheses and key variables. Then inductive coding techniques as described by Strauss and Corbin will be employed (77). The initial data will be collected, written up and reviewed line by line, typically by a participant’s response. Beside the responses, categories or labels will be generated and a list of themes will be developed. The themes will be reviewed and then slightly more abstract categories will be attributed to several responses or observations. The responses will then be put into designated qualitative categories. After each interview, focus group, program record, and observation file is coded, text retrievals on specific codes or combination of codes will be completed. These retrievals enable content analysis of particular topics, which will be followed by displaying the data in a series of matrices to facilitate identification of similarities and differences in themes by respondents (i.e., Food Service Director vs. Food Service Staff; Teachers vs. School Staff). Levels of agreement and saliency of themes will be assessed.
Aim 3:
Use the results from Aims 1 and 2 to identify promising evidence-based obesity-related F2S interventions, implementation strategies and program adaptations and package these findings for dissemination and implementation through the Center for Training and Research Translation.
Objectives:
Based on the findings from the evaluation of the Farm to School programs we will: • Identify evidence-based F2S programs and strategies
• Communicate effectively with practitioners regarding the most promising strategies and program adaptations.
• Describe resources required for implementation and maintenance.
• Make evidence and tools accessible to practitioners and those interested in implementing F2S programs in the future through a toolkit and technical assistance.
Translation and Dissemination
We propose to identify, package, and disseminate the evidence from Aims 1 and 2 using a three-phase approach based on a framework developed by UNC’s Prevention Research Center’s Center for Training and Research Translation (Center TRT) (78; Figure 1). Since 2004, Center TRT has translated and disseminated evidence via the Internet to public health practitioners nationwide regarding evidence based interventions for policy and environmental change interventions targeting obesity. In 2011 alone, over 19,000 unique visitors accessed the Center’s website (www.center-trt.org). Dr. Leeman, co-investigator leading the dissemination effort for the proposed study, is Co-Principal Investigator of the Center TRT. The proposed project will identify and review evidence from Aims 1 & 2 (Phase 1), package evidence into standardized formats (Phase 2), and disseminate efforts via the Internet (Phase 3).
Phase 1 – Identify evidence
We will review evidence collected in aims 1 & 2 to identify the most promising interventions as well as cross-intervention evidence regarding barriers and facilitators to implementation and approaches to evaluation. The data from the promising interventions will be mined further to identify promising program adaptations and implementation strategies.
Identifying promising interventions: Building on the work of Center TRT, F2S interventions will be reviewed based on the following three broad criteria: evidence that the project was effective at achieving intended outcomes, extent of project implementation, and dissemination readiness. Center TRT has developed a review tool with multiple items related to each of these criteria that will be adapted for this project.
The review criteria for effectiveness are adapted from the Community Guide (1999) criteria and assess the strength of evidence in support of the effectiveness of the intervention. This includes the strength of the evaluation methods used to test the intervention based on elements such as sampling, design, measurement, and analysis. The review tool also assesses formative work done to develop the project, the project’s
underlying theory and/or logic, and findings from evaluations of the project’s effects on targeted processes and outcomes.
Review criteria – implementation. The RE-AIM framework will be used to guide review of project
implementation. This framework is widely used to assess implementation and includes the following criteria: Whether the project Reaches the priority population, is Effective in achieving intended outcomes, is Adopted by providers and settings, and is Implemented with fidelity and Maintained over time (74, 79).
Review criteria - readiness for dissemination. Each F2S project will be evaluated using criteria adapted from a highly regarded and widely tested assessment of readiness for dissemination -the Substance Abuse and Mental Health Services Administration (SAMHSA) and National Cancer Institute’s Research-tested Intervention Program (http://rtips.cancer.gov/rtips/index.do) (RTIPS). The criteria assess the extent to which the project is described sufficiently to allow replication and materials/supporting documents are available and of useable quality.
Phase 2 – Package Evidence.
Packaging interventions. One way to facilitate adoption and implementation is to translate evidence into a format that clearly communicates benefits and provides guidance on implementation. Several organizations disseminate interventions in “packages” that detail the target audience, implementation process, and data in support of the intervention’s potential benefits and often also provide intervention protocols and materials (e.g.,
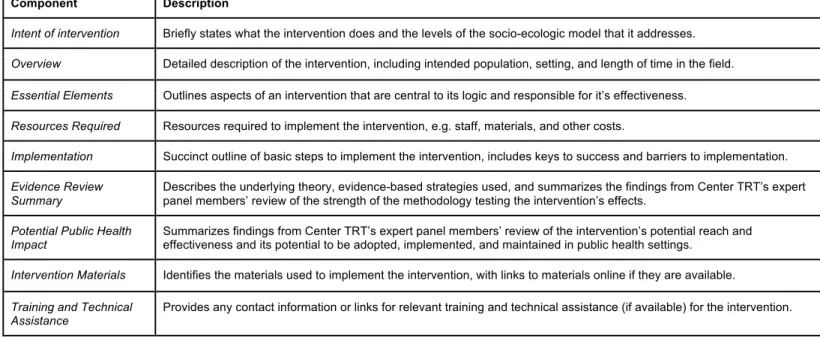
Table 3. Components of the Center TRT Intervention Template
Component Description
Intent of intervention Briefly states what the intervention does and the levels of the socio-ecologic model that it addresses.
Overview Detailed description of the intervention, including intended population, setting, and length of time in the field.
Essential Elements Outlines aspects of an intervention that are central to its logic and responsible for it’s effectiveness.
Resources Required Resources required to implement the intervention, e.g. staff, materials, and other costs.
Implementation Succinct outline of basic steps to implement the intervention, includes keys to success and barriers to implementation.
Evidence Review
Summary
Describes the underlying theory, evidence-based strategies used, and summarizes the findings from Center TRT’s expert panel members’ review of the strength of the methodology testing the intervention’s effects.
Potential Public Health
Impact
Summarizes findings from Center TRT’s expert panel members’ review of the intervention’s potential reach and effectiveness and its potential to be adopted, implemented, and maintained in public health settings.
Intervention Materials Identifies the materials used to implement the intervention, with links to materials online if they are available.
Training and Technical Assistance
Provides any contact information or links for relevant training and technical assistance (if available) for the intervention.
Translating evidence on barriers and facilitators. We will create brief documents that provide public health practitioners and school staff with cross-cutting lessons in facilitators and barriers to implementation of F2S programs. Documents will be available on the Center TRT website and announcements made to publicize their location.
Phase 3: Dissemination.
Evidence will be posted on the Center TRT website, which has national reach to public health practitioners working in obesity prevention. We will disseminate via Center TRT webinars, which are presented quarterly to audiences of between 60 and 285 participants depending on topic. We also will present findings at national and local conferences and through publication in both research and professional journals.
Preliminary Studies: The Center for Health Promotion and Disease Prevention (HPDP) at UNC-CH has a wealth of expertise and experience in developing and implementing obesity prevention interventions and evaluating them. We have developed logic models and evaluation plans for numerous interventions including two F2S interventions. One, the Oregon Farm to School and School Garden Policy Approach evaluation plan focused on acceptability, extent of implementation and effectiveness as well as short-term outcomes including changes in the environment and student knowledge that can lead to behavior change. The second, an
evaluation for the Riverside Unified School District Farmers’ Market Salad Bar Program focused on determining reach, adoption, implementation of the program and its effectiveness at addressing targeted outcomes of changes to the school food environment and student attitudes toward eating fruits and vegetables. In addition, HPDP collaborated with the National Farm to School Network (NFSN) from 2007 to 2010 on the
National Farm to School Network Project, which evaluated the overall effectiveness of the NFSN, focusing on five priorities: policy initiatives and administrative changes; media coverage and marketing efforts; collection and dissemination of F2S information, national and regional networking and capacity for training and technical assistance. Through this effort, HPDP developed two new, validated tools; the School Lunch Recall and the Fruit and Vegetable Neophobia Instrument. A toolkit was created with the goal of building a strong evidence base to improve and promote F2S programs and includes these tools
(http://www.farmtoschool.org/publications.php?pt=eval). In addition, through the Gillings Innovation Laboratory: Linking Local, Sustainable Agriculture and Health project, members of the research team studied the public health impact of moving toward a local, sustainable food system in North Carolina. The research team addressed environmental benefits of smaller scale sustainable farming practices; determined nutrition and health-related benefits; and conducted an economic analysis of opportunities and barriers for developing integrated local and sustainable food systems. During the project we worked in a charter
through interviews with students and teachers in middle schools in North Carolina. Another HPDP study, the
Harvest of Hope Community Garden project, was initiated by members of a rural Black church in a high poverty county to address high rates of chronic disease, limited access to healthy food, and related economic challenges in a transitioning agricultural economy. Change in knowledge attitudes, and behaviors about diet and nutrition were measured in youth and adults and we found that those who were regular attenders had improved attitudes about farming and adult regular attenders saw a reduction in blood pressure. We are currently conducting a study of the impact of community garden involvement on 60 rural, African American youth using the same measures used on the National Farm to School Network evaluation, the Harvest of Hope study, and proposed here. Taste Texting is a project currently underway to address obstacles to serving and choosing healthy school lunches through a coordinated text and web-based ordering system that using
behavioral economics principles to encourage high school students to unknowingly make better choices at lunch. As part of this project, the research team conducted interviews and focus groups in one high school to learn about how students feel about their school lunch program.
Potential Challenges/Limitations and Alternative Strategies. The main challenge to this evaluation study is that the USDA has not yet awarded their F2S grants and so we do not know how many will be awarded or the exact nature of their F2S approach. We have, however, been in collaboration with the National Farm to School Network and the program officers with the USDA Farm to School Program (see letters of support) to plan how this evaluation can be rolled out in a way that complements the plans of the grantees. Further, our research team has conducted similar studies, including developing tools and protocols to facilitate smooth
implementation, and have assembled a team that will be able to hit the ground running to plan and implement this evaluation.
Summary: Childhood obesity is a serious public health concern that demands action on the part of
practitioners and policymakers. Healthy eating and regular physical activity are well-known strategies to help individuals achieve and maintain a healthy weight. However, effective strategies that encourage and support healthy lifestyle choices of populations have yet to be fully realized. F2S is a natural response to concerns about childhood obesity. Farms have been the source of wholesome, nutritious food for hundreds of yearsand schools are established as places where all children come to learn academics, values, and social responsibility that they will carry for a lifetime. Telling students to eat fruits and vegetables is not likely to lead to a healthier diet or solve the obesity crisis. F2S, however, engages students in growing, tasting and preparing food while incorporating fresh local produce into school meals and snacks served to millions of students each day. USDA recognizes the potential benefits of F2S as it will very soon award $3.5 million in grant funding for planning and implementation of F2S programs. This investment of resources in F2S warrants an evaluation of its impact. This is an excellent opportunity to build the evidence base for obesity prevention and encourage continued support of Farm to School programs.
Timeline
Quarters
Activity Y1 Q1 Y1 Q2 Y1 Q3 Y1 Q4 Y2 Q1 Y2 Q2 Y2 Q3 Y2 Q4 Planning/Training on tools with USDA/Grantees X
IRB approval X X
Baseline (T1) QN data collection X X
Baseline QL interviews X X
T2 data collection X X
Grantee site visits X X X X X X
Y3 Q1 Y3 Q2 Y3 Q3 Y3 Q4 Y4 Q1 Y4Q2 Y4Q3 Y4Q4
Refresher training on tools X
T2 QL interviews X X X X
T3 QN data collection X
T4 Maintenance QN data collection X X
Grantee site visits X X X
Y5 Q1 Y5 Q2 Y5 Q3 Y5 Q4
Draft findings report X X
Develop toolkit X X
Develop toolkit marketing & dissemination plan X
Disseminate toolkit X X X
1. Ogden CL, Carroll MD, Curtin LR, Lamb MM, Flegal KM. (2010). Prevalence of high body mass index in US children and adolescents, 2007–2008. Journal of the American Medical Association,
303(3), 242–249.
2. Daniels, S.R., Arnett, D.K., Eckel, R.H., et al. (2005). Overweight in children and adolescents: pathophysiology, consequences, prevention, and treatment. Circulation, 111, 1999-2002. 3. Whitaker RC, Wright JA, Pepe MS, Seidel KD, Dietz WH. (1997) Predicting obesity in young
adulthood from childhood and parental obesity. New England Journal of Medicine, 37(13), 869-873.
4. NIH, NHLBI Obesity Education Initiative. Clinical Guidelines on the Identification, Evaluation and Treatment of Overweight and Obesity in Adults. Available online: http://www.
Nhlbi.nih.gov/guidelines/obesity/ob_gdlns.pdf
5. Finkelstein, EA, Trogdon JG, Cohen JW, Dietz, W. (2009). Annual medical spending attributable to obesity: Payer- and service-specific estimates. Health Affairs, 28(5), w822-831.
6. Reedy J, Krebs-Smith SM. (2010). Dietary sources of energy, solid fats, and added sugars among children and adolescents in the United States. J Am Diet Assoc,110(10), 1477-84. 7. James W.P.T., Nelson M., Ralph A., & Leather S. (1997). Socioeconomic determinants of the: the
contribution of nutrition to inequalities in health. BMJ, 314(7093), 1545.
8. Johnson L., Mander A. P., Jones L. R., Emmett, P. M., & Jebb, S. A. (2007). A prospective analysis of dietary energy density at age 5 and 7 years and fatness at 9 years among UK children. International Journal of Obesity, 32(4), 586-593.
9. Johnson L., Mander A. P., Jones L. R., Emmett, P. M., & Jebb, S. A. (2008). Energy-dense, low-fiber, high-fat dietary pattern is associated with increased fatness in childhood. The American journal of clinical nutrition, 87(4), 846-854.
10. Centers for Disease Control and Prevention (CDC). 1991-2011 High School Youth Risk Behavior Survey Data. Retrieved October 30, 2011, from http://apps.ncce.cdc.gov/youthonline.
11. Baker, E.A., Schootman, M., Barnridge, E., & Kelly, C. (2006). Peer Reviewed: The role of race and poverty in access to foods that enable individuals to adhere to dietary guidelines. Preventing Chronic Disease, 3(3).
12. Kumanyika, S.K., & Grier, S. (2006). Targeting interventions for ethnic minority and low-income populations. The Future of Children, 16(1), 187-207.
13. Hung H. C., Joshipura K. J., Jiang R., Hu F. B., Hunter D., Smith-Warner S. A., & Willett, W. C. (2004). Fruit and vegetable intake and risk of major chronic disease. Journal of the National Cancer Institute, 96(21), 1577-1584.
14. Lautenschlager, L, & Smith, C. (2007). Understanding gardening and dietary habits among youth garden program participants using the Theory of Planned Behavior. Appetite, 49(1), 122-130. 15. McAleese, J.D., & Rankin, L.L. (2007). Garden-based nutrition education affects fruit and
vegetable consumption in sixth-grade adolescents. Journal of the American Dietetic Association 107, 662-665.
16. Parker, Stephany P., Youmasu J. Siewe, and Barbara A. Denney. (2006). After-school gardening improves children’s reported vegetable intake and physical activity. J Nutr Educ Behav 38, 201-202.
17. Lineberger, Sarah E., and Jayne M. Zajicek. (2000). School gardens: Can a hands-on teaching tool affect students' attitudes and behaviors regarding fruit and vegetables?. HortTechnology 10(3), 593-597.
18. American Academy of Pediatrics: Children, adolescents, and television. (2001). Pediatrics, 107, 423-6.
19. Common Wealth of Australia. (2004). Australia’s Physical Activity Recommendations for 5-12-year olds.
20. Office of the Surgeon General. (2007). The Surgeon General’s Call to Action to Prevent and Decrease Overweight and Obesity.
21. US Dep. Health Hum. Serv. (2008). Physical Activity Guidelines for Americans. ODPHP Publ. No. U0036. Washington, DC: Off. Dis. Prev. Health Promot. Retrieved from
22. Troiano, R.P., Berrigan, D., Dodd, K.W., Mâsse, L.C., Tilert, T., & McDowell, M. (2008). Physical activity in the United States measured by accelerometer. Medicine and Science in Sports and Exercise, 40(1), 181.
23. Sisson, S.B., Church, T.S., Martin, C.K., Tudor-Locke, C., Smith, S.R., Bouchard, C., … & Katzmarzyk, P.T. (2009). Profiles of sedentary behavior in children and adolescents: the US National Health and Nutrition Examination Survey, 2001-2006. International Journal of Pediatric Obesity, 4(4), 353-359.
24. Reilly, J.J., Penpraze, V., Hislop, J., Davies, G., Grant, S., & Paton, J.Y. (2008). Objective measurement of physical activity and sedentary behavior: review with new data. Archives of Disease in Childhood, 93(7), 614-619.
25. Rey-Lopez, J.P., Vicente-Rodriguez, G., Biosca, M., Moreno, L.A. (2008). Sedentary behavior and obesity development in children and adolescents. Nutr Metab Cardiovasc Dis, 18, 242-51. 26. Wiecha, J.L., Peterson, K.E., Ludwig, D.S., Kim, J., Sobol, A. & Gortmaker, S.L. (2006). When children eat what they watch: impact of television viewing on dietary intake in youth. Archives of pediatrics & adolescent medicine, 160(4), 436.
27. Gortmaker, S.L., Must, A., Sobol, A.M., Peterson, K., Colditz, G.A., Dietz, W.H. (1996). Television viewing as a cause of increasing obesity among children in the United States. 1986-1990. Arch Pediatr Adolesc Med, 150, 356-362.
28. Gortmaker, S.L., Peterson, K., Wiecha, J., Sobol, A.M., Dixit, S., Fox, M.K., Lair, N. (1999). Reducing obesity via a school-based interdisciplinary intervention among youth: Planet Health. Arch Pediatr Adolesc Med, 153, 409-418.
29. Robinson, TN. (2001). Television viewing and childhood obesity. Pediatr Clin North Am., 48, 1017-1025.
30. Story, M., Nanney, M.S., & Schwartz, M.B. (2009). Schools and obesity prevention: creating school environments and policies that promote health eating and physical activity. Milbank Quarterly, 87(1), 71-100.
31. Cooke, L. (2007). The importance of exposure for healthy eating in childhood: a review. Journal of Human Nutrition and Dietetics, 20(4), 294-301.
32. Pate, R.R., Baranowski, T.O.M., Dowda, M., & Trost, S.G. (1996). Tracking of physical activity in young children. Medicine and Science in Sports and Exercise, 28(1), 92.
33. Knai, Cécile, et al. (2006). Getting children to eat more fruit and vegetables: a systematic review.
Preventive Medicine 42(2), 85-95.
34. van Sluijs, Esther MF, Alison M. McMinn, and Simon J. Griffin. (2007). Effectiveness of interventions to promote physical activity in children and adolescents: systematic review of controlled trials. BMJ 335(7622), 703.
35. United States Department of Agriculture. Food and Nutrition Service. Agricultural Marketing Service. (2011). USDA farm to school team: 2010 summary report. Retrieved on November 4, 2012, from www.fns.usda.gov/cnd/f2s/pdf/2010_summary-report.pdf.
36. Joshi, A., & Azuma, A. M. (2009). Bearing Fruit: Farm to School Program Evaluation Resources and Recommendations. Center for Food & Justice Urban & Environment.
37. Hermann, J., Parker, S., Brown, B., et al. (2006). After-school gardening improves children’s reported vegetable intake and physical activity. Journal of Nutrition Education and Behavior, 38(3), 201-202
38. Twiss, J., Dickinson, J., Duma, S., Kleinman, T., Paulsen, H., Rilveria, L., (2003). Community gardens: lessons learned from California Healthy Cities and Communities. Am J Pub Health, 93, 1435-1438.
39. Green, L.W., & Glasgow, R.E. (2006). Evaluating the relevance, generalization, and applicability of research: issues in external validation and translation methodology. Eval Health Prof 29I(1), 126-153.
40. Institute of Medicine (IOM). (2010). Bridging the evidence gap in obesity prevention: a framework to inform decision-making. National Academy Press.
41. Brouwers, M.C., Makarski, J., Garcia, K., Bouseh, S., & Hafid, T. (2011). Improving cancer control in Canada one case at a time: the “Knowledge Translation in Cancer” casebook. Curr Oncol,
42. Ritzwoller, D.P., Sukhanova, A., Gaglio, B., & Glasgow, R.E. (2009). Costing behavioral interventions: a practical guide to enhance translation. Ann Behav Med, 37(3).
43. Armstrong, R., Waters, E., Crockett, B., & Keleher, H. (2007). The nature of evidence resources and knowledge translation for health promotion practitioners. Health Promot Int, 22(3), 254-260. doi: dam017 [pii]
44. Higgins, J.W., Strange, K., Scarr, J., Pennock, M., Barr, V., Yew, A., … Terpstra, J. (2011). “It’s a feel. That’s what a lot of our evidence would consist of”: public health practitioners’ perspectives on evidence. Eval Health Prof, 34(3), 278-296. doi: 0163278710393954 [pii]
45. Dearing, J.W., & Kreuter, M.W., (2010). Designing for diffusion: how can we increase uptake of cancer communication innovations? Patient Educ Couns, 81 Suppl, S100-110. doi: S0738-3991(10)00621-X [pii]
46. Kreuter, M.W., & Bernhardt, J.M. (2009). Reframing the dissemination challenge: a marketing an distribution perspective. American Journal of Public Health, 99(12), 2123-2127.
47. Maibach, E.W., Van Duyn, M.A., & Bloodgood, B. (2006). A marketing perspective on
disseminating evidence-based approaches to disease prevention and health promotion. Prev Chronic Dis, 3(3), A97. doi: A97 [pii]
48. Paxton, A., Baxter, S.D., Fleming, P., & Ammerman, A. (2011). Validation of the School Lunch Recall questionnaire to capture school lunch intake of third- to fifth-grade students. Journal of the American Dietetic Association, 111(3), 419-424.
49. Hollar, D., Paxton-Aiken, A., & Fleming, P. (2012). Exploratory validation of the Fruit and Vegetable Neophobia Instrument among third- to fifth-grade students. Appetite.
50. Joshi, A., & Paxton, A. (2011). Farm to School Evaluation Toolkit. Retrieved from
http://www.farmtoschool.org/publications.php?pt=eval.
51. Joshi, A., & Paxton, A. (2011). UNC Research Summaries. Retrieved from
http://www.farmtoschool.org/publications.php?pt=eval
52. Heneman, K., Junge, S.K., Schneider, C., & Zidenberg-Cherr, S. (2008). Pilot implementation of the improving children’s health through farming, food and fitness program in select California schools. Journal of Child Nutrition and Management 32(1). Retrieved from
http://docs.schoolnutrition.org/newsroom/jcnm/08spring/heneman-junge/index.asp.
53. Moore, L.V., Diex Roux, A.V., & Brines, S. (2008). Comparing perception-based and geographic information system (GIS)-based characterizations of the local food environment. Journal of Urban Health, 85(2), 206-216.
54. Rose, D., & Richards, R. (2004). Food store access and household fruit and vegetable use among participants in the US Food Stamp Program. Public Health Nutrition, 7(8), 1081-1088. 55. Scholderer, J., Brunsu, K., Bredahl, L., & Grunert, K.G. (2004). Cross-cultural validity of the
food-related lifestyles instrument (FRL) within Western Europe. Appetite, 42(2), 197-211.
56. McPherson, R.S., Hoelscher, D.M., Alexander, M., Scanlon, K.S., & Serdula, M.K. (2000). Dietary assessment methods among school-aged children: validity and reliability. Preventive Medicine, 31(2), S11-S33.
57. Livingstone, M.B.E., Robson, P.J., & Wallace, J.M.W. (2004). Issues in dietary intake assessment of children and adolescents. British Journal of Nutrition, 92, 213-222.
58. Baxter, S.D., Smith, A.F., Litaker, M.S., Guinn, C.H., Shaffer, N.M., Baglio, M.L., Frye, F.H. (2004). Recency affects reporting accuracy of children’s dietary recalls. Ann Epidemiol, 14, 385-390.
59. Baxter, (2009). Fourth-grade children’s dietary recall accuracy is influenced by retention interval (target period and interview time). J Am Diet Assoc, 109, 846-856.
60. Baranowski, T., Beltran, A., Martin, S., Watson, K. B., Islam, N., Robertson, S., ... & Baranowski, J. (2010). Tests of the accuracy and speed of categorizing foods into child vs professional categories using two methods of browsing with children. Journal of the American Dietetic Association, 110(1), 91-94.
62. Burrows, T.L., Martin, R.J., & Collins, C.E. (2010). A systematic review of the validity of dietary assessment methods in children when compared with the method of doubly labeled water.
Journal of American Dietetic Association, 110(10), 1501.
63. Feskanich, D., Sielaff, B., Chong, K., Bartsch, G. (1989). Computerized collection and analysis of dietary intake information. Comput Methods Programs Biomed, 30, 47-57.
64. Gao, Z, Lee, A.M., Solmon, M.A., Kosman, M., Carson, R.L., Zhang, T, Domangue, E., Moore, D. (2010). Validating pedometer-based physical activity time against accelerometer in middle school physical education. The ICHPER-SD Journal of Research in Health, Physical Education,
Recreation, Sport & Dance, 5, 20-25.
65. Corder, K., Brage, S., Ekelund, U (2007). Accelerometers and pedometers: methodology and clinical application. Current Opinion in Clinical Nutrition & Metabolic Care: 10(5), 597-603. 66. Stewart, J.A., Dennison, D.A., Kohl III, H.W., & Doyle, J.A. (2004). Exercise level and energy
expenditure in the TAKE 10! in-class physical activity program. Journal of School Health, 74(10), 397-400.
67. Yilidirim, M., Verloigne, M., DeBourdeaudhuij, I., Androutsos, O., Manios, Y., Felsõ, R., … & Chinapaw, M.J. (2011). Study protocol of physical activity and sedentary behavior measurement among schoolchildren by accelerometry-Cross-sectional survey as part of the ENERGY-project.
BMC Public Health, 11(1), 182.
68. Ward, D.S., Evenson, K.R., Vaughn, A.M.B.E.R., Rodgers, A.B., & Troiano, R.P. (2005).
Accelerometer use in physical activity: best practices and research recommendations. Medicine and Science in Sports and Exercise, 37(11 Suppl), S582.
69. Trost, S. G., Loprinzi, P. D., Moore, R., & Pfeiffer, K. A. (2011). Comparison of accelerometer cut points for predicting activity intensity in youth. Medicine and science in sports and exercise, 43(7), 1360-1368.
70. Bailey R.C., Olson J., Pepper S.L., Porszasz J., Barstow T.J., Cooper D.M. (1995). The level and tempo of children's physical activities: an observational study. Med Sci Sports Exerc 27(7), 1033-41.
71. Westat Inc. (1988). National Health and Nutrition Examination Survey III: Body Measurements (Anthropometry).Rockville, Md: Westat Inc.
72. Himes, J.H., & Dietz, W.H. (1994). Guidelines for overweight in adolescent preventive services: recommendations from an expert committee: the Expert Committee on Clinical Guidelines for Overweight in Adolescent Preventive Services. Am J Clin Nutr, 59, 307-316.
73. Carter R, Moodie M, Markwick A, Magnus A, Vos T, et al. (2009). Assessing cost-effectiveness in obesity (ACE-obesity): an overview of the ACE approach, economic methods and cost results.
BMC Public Health 9:419
74. Glasgow R, Lichtenstein E, Marcus AC. (2003). Why don’t we see more translation of health promotion research to practice? Rethinking the efficacy-to-effectiveness transition. Am. J. Public Health 93(8):1261– 67.
75. Miles M, Huberman A. (1994). Qualitative Data Analysis. Thousand Oaks: Sage.
76. Ulin P, Robinson E, Tolley E. (2005). Qualitative Methods in Public Health. San Francisco: Jossey-Bass.
77. Strauss A, Corbin J. (1990). Basics of Qualitative Research. Newbury Park, Calif: Sage. 78. Leeman J, Sommers J, Leung MM, Ammerman A. (2011). Disseminating evidence from
research and practice: A model for selecting evidence to guide obesity prevention, Journal of Public Health Management Practice, 17(2), 133-140.
79. Jilcott, S., Ammerman, A., Sommers, J., & Glasgow, R.E. (2007). Applying the RE-AIM