Characterizing long-term patterns of weight change in China using Latent Class Trajectory Modeling
Lauren Paynter, Elizabeth Koehler, Annie-Green Howard, Amy H. Herring, Penny Gordon Larsen
ABSTRACT
Background Over the past three decades obesity has increased tremendously in China, leading to high rates of obesity-related non-communicable diseases such that these diseases are the leading causes of morbidity, disability and mortality.
Understanding what patterns of weight change are predictive of disease risk is important for understanding the etiology of disease risk as it relates to weight change, identifying groups at particularly high risk, and shaping prevention strategies. Derivation of weight change patterns through use of latent class trajectory modeling can provide useful and easily applicable information with respect to patterns of weight history.
Methods Latent class trajectory modeling was used to compute weight change trajectories for adults aged 18 and older using the China Health and Nutrition Survey (CHNS) data. Weight change trajectories were computed separately for males and females and by age group at baseline (18 to <30, 30 to <40, and 40 to <66 at the 2009 measurement) due to differential age-related patterns of weight gain in China over the past 20 years. Generalized linear mixed effects models were then used to examine the association between trajectories of weight change and baseline characteristics such as urbanicity, BMI category, age, and year of study entry.
Results A range of 5 to 7 trajectory classes were identified for each of the 6 age-sex subgroups corresponding to ‘weight loss’, ‘weight maintenance’, and several different patterns of ‘weight gain’. Baseline BMI status (‘underweight’, ‘normal weight’, ‘overweight’, or ‘obese’) was a significant predictor of trajectory membership for all age-sex subgroups. Individuals in ‘weight loss’ trajectory classes had higher odds of being overweight or obese at baseline. We found no significant association between baseline urbanization status and weight change trajectory membership after controlling for other covariates.
population, thus pointing to the importance of subgroup analyses in future research.
Keywords Adult, weight change trajectories, latent-class trajectory modeling, longitudinal studies, China, gender, age groups
INTRODUCTION
While obesity had been considered a result of a modern lifestyle, obesity is a growing public health challenge in both modern and developing countries.1 With modernization over the past three decades, obesity has increased tremendously in China.2 This trend towards increasing weight has also led to high rates of obesity-related non-communicable diseases such that these diseases are the leading causes of morbidity, disability and mortality.3
Given the association of obesity and weight gain with chronic disease risk, it is important to identify population subsets at highest risk in order to intervene appropriately to reduce mortality and morbidity. Identification of different patterns of weight change may provide a useful tool for detecting within-population groups at increased risk of chronic disease, and allow for
introduction of strategic public health interventions which may help reduce the magnitude of chronic disease in targeted populations.4,5
Latent class trajectory modeling is one such method of identifying distinct groups with similar underlying trajectories in longitudinal data.6,7 Longitudinal studies can be challenging to summarize due to the magnitude of data provided by long term studies. Multivariate analysis of variance (MANOVA) and structural equation modeling (SEM) are able to estimate growth trajectories over time; however, these methods produce an average trajectory for an entire population and may not be appropriate in settings with more heterogeneous populations.6 While repeated measures analysis of variance (ANOVA) and analysis of covariance (ANCOVA) allow individual-specific growth trajectories, they do not facilitate straightforward identification of distinct groups of individuals. Latent class analysis allows researchers to summarize data across multiple time points in an unbiased manner to identify patterns because this method does not require a priori knowledge about the number or direction of existing trajectories in a given population.5,6 Thus, latent class analysis is a useful tool for summarizing data to identify high risk groups which can then be targeted for intervention or prevention strategies.
In this paper we take advantage of 18 years of longitudinal weight data on 9,750 individuals (40,011 observations) where anthropometric data were measured by trained health care workers.3
Other research has computed BMI trajectories for children, but this has focused on identifying prevalence of overweight and obesity over time rather than identification of patterns of weight change.13 Research that focuses on growth trajectories for adults has computed trajectories across heterogeneous age groups, rather than computing age-specific trajectories.14,15,16 Additionally, although many of the data sources for existing research provide over 20 years of data, height and weight measures are (unlike our data) often self-reported and thus suffer from reporting
biases.14,15,16,17 We hypothesize that patterns of increasing weight gain are more prevalent in individuals who, at baseline, are 1) living in more (versus less) urban areas and 2) are overweight or obese. We also hypothesize that these weight trajectory patterns will differ by age and gender subgroups.
METHODS
Study Population
Data were from the China Health and Nutrition Survey (CHNS), a large-scale household-based, longitudinal survey in China. The CHNS collected health data in 228 communities in nine diverse provinces (Guangxi, Guizhou, Heilongjian, Henan, Hubei, Hunan, Jiangsu, Liaoning, and Shandong) throughout China from 1989-2009 with eight rounds of surveys. Using multistage, random cluster sampling, counties in the nine provinces were stratified by income and weighted sampling used to randomly select four counties and two cities in each province. Villages and small towns within counties and urban and suburban neighborhoods within cities were selected randomly into primary sampling units defined politically and geographically based on State Statistical Office definitions. The surveyed provinces represent 56% of the Chinese population. The CHNS sample is not representative of China, although the sample is designed to obtain a variety of economic and demographic circumstances. Survey procedures have been described elsewhere.18
Analysis sample
Analyses were limited to adults, defined as 18 years or older at baseline measurement and less than 66 years of age at the last data collection in 2009. If a woman reported being pregnant during a particular survey year, her weight is set to missing to ensure that any changes to weight gain during this time period did not skew the results. There were 288 individuals with missing baseline BMI and because baseline weight is defined as an individual’s first non-missing weight, missing baseline BMI corresponded to those with missing height measure at baseline.
gender-specific analyses. We used latent class trajectory analysis (LCTA) to identify within-sex trajectories in the full sample, without regard to the age categories.10
Anthropometry
Anthropometric data and covariates from 1991 through 2009 (at waves 1991, 1993, 1997, 2000, 2004, 2006, 2009) were used for analyses because the 1991 visit was the first collection of systematically measured height and weight. Weight and height measures were collected by trained health workers who followed standard protocol and techniques. Weight was measured in light indoor clothing without shoes to the nearest tenth of a kilogram with a beam balance scale. Height was measured without shoes to the nearest tenth of a centimeter with a portable
stadiometer.3 Weight change was calculated as current weight minus baseline weight.
Covariates
Given our focus on adults, we assume no change in height throughout the follow-up and thus use a single adult height measurement derived from average height to calculate baseline BMI (weight in kg)/height in m2). Baseline BMI was used to classify baseline weight status:
underweight, normal weight, overweight, and obese according to WHO criteria (<18.5 kg/m2, 18.5-24.9 kg/m2, 25-29.9 kg/m2, and >=30 kg/m2 respectively).19
Year of study entry is included as an individual’s baseline time indicator. Due to the fact that data was not collected for all individuals at each time point, the year of study entry varied for study participants and ranged from 1991 to 2004. Baseline age was examined as a continuous variable scaled by a factor of 10 such that interpretation of corresponding odds ratios was in terms of risk associated with a 10 year increase in age. A dichotomous urbanization variable represented whether an individual’s household was in an urban or rural setting at baseline.
Statistical Analysis
Analyses were conducted using SAS version 9.2 (SAS Institute, Cary, NC). Identification of weight change trajectories is through latent class trajectory modeling with the TRAJ
procedure using the censored normal model.7,10 We modeled weight change over time in two separate analyses: 1) for six baseline age by gender subgroups corresponding to the following age categories: 18 to <30, 30 to <40, and 40 to <66 for males and females; and 2) for males and females separately in the total sample. For each age by gender subgroup, latent class trajectory models were used to identify weight change patterns, allowing for a variety of different order polynomials in time to determine the best fitting polynomial form.
Criteria
criteria: i) lowest BIC with ii) at least 2% predicted sample size in each trajectory class. Some authors have suggested 5% group membership as a criterion for model selection; however, it has been noted that in some cases, derived trajectories may include on a small fraction of individuals in the sample.6 In the interest of identifying unique patterns and due to our considerable sample size, the less restrictive 2% group membership criterion is used for this paper. It is important to note that the 2% membership refers to predicted group membership produced from model results. Actual group membership may in fact be less than 2%.
After modeling, individuals were assigned to the class with the highest posterior
probability and average posterior probabilities were computed for each class.6 Research indicates
that ideal average posterior probabilities be greater than a minimum of 0.7 to indicate adequate class assignment.6 For our analyses, over 70% of classes have larger than 0.7 average posterior probabilities for their assigned classes. Furthermore, greater than 80% of classes have more than 0.63 average posterior probabilities, indicating class assignment for our analyses is satisfactory (Table 2).
After determination of weight change trajectories, two nominal categorical variables were created for each individual to describe trajectory membership for each subject. The first variable contained the trajectory number corresponding to the age by gender subgroup analyses, and the second variable corresponded to trajectory membership from overall gender analyses. We next examined baseline predictors of weight change pattern class membership: BMI category, year of study entry, age scaled by a factor of 10, and urbanicity status. Each trajectory class variable was then used as the outcome variable when fitting a multinomial generalized linear mixed effects hierarchical model with random intercepts to account for potential community-level correlation using the GLIMMIX procedure in SAS.
Two sets of models were fit for the age by gender subgroups and for the total gender group across all ages. Included covariates all correspond to baseline measures which were determined a priori to be of interest: baseline age scaled by a factor of 10 (continuous), year of study entry (continuous), baseline BMI status as a four category variable (underweight, normal weight [referent], overweight, or obese), and a dichotomous baseline urban-rural variable (referent: rural). Reference groups for weight change trajectories were chosen on the basis of a pattern indicating “minimal weight change.” One exception for covariate categorization is required for males ages 18 to 30 at baseline because this group has some trajectory pattern classes with inadequate sample size for some covariates (year of study entry was defined as <2000 [referent] or >=2000, and baseline BMI as underweight, normal weight [referent], and overweight/obese).
RESULTS:
A total of 9,750 adults were included in analyses corresponding to 4618 males and 5132 females (Table 1). Approximately two-thirds of our analysis sample lived in rural areas at baseline. At baseline, the majority of our sample was normal weight such that 79% of males and 76% of females had a BMI classified in a ‘normal’ range. A small percentage of males and females were underweight at baseline with this small percentage corresponding to about 8% for each gender overall. A higher proportion of youth for both genders was underweight at baseline as compared to older age groups. Most of the individuals in this sample, 53% and 54% for males and females respectively, entered the study in 1991.
Table 1: Descriptive Statistics
Gender
Male Female
Age Group
All
Age Group
All 18-30 30-40 40-66 18-30 30-40 40-66
N 1625 1565 1428 4618 1928 1781 1423 5132
Mean (Std) Baseline Age Mean 24.52 35.23 46.05 34.81 25.15 35.03 46.20 34.42
Std 3.51 2.74 4.73 9.50 3.25 2.85 4.87 9.18
Mean (Std) Baseline Weight(kg) Mean 59.74 62.25 62.65 61.49 52.27 54.50 56.20 54.14
Std 8.75 9.78 10.26 9.67 7.18 8.27 9.62 8.44
Mean (Std) Average Height(cm) Mean 167.86 167.17 166.05 167.07 156.93 156.48 155.20 156.30
Std 5.93 6.28 6.12 6.15 5.36 5.70 5.94 5.68
Baseline BMI Category
10.34 5.94 4.69 7.10 11.46 6.23 5.06 7.87
Underweight %
Normal Weight % 82.34 78.59 74.23 78.56 80.60 78.38 67.04 76.07
Overweight % 6.58 14.25 19.05 13.04 7.57 14.15 25.23 14.75
Obese % 0.74 1.21 2.03 1.30 0.36 1.24 2.67 1.31
Urbanicity At Baseline (%)
31.32 33.87 37.04 33.95 31.59 33.18 38.58 34.08
Urban %
Rural % 68.68 66.13 62.96 66.05 68.41 66.82 61.42 65.92
Baseline Wave (%)
61.54 55.78 42.79 53.79 51.24 56.32 44.69 51.19
1991 %
1993 % 9.42 6.26 6.16 7.34 8.04 4.10 2.88 5.24
1997 % 18.77 17.12 18.21 18.04 17.58 16.17 19.11 17.52
2000 % 5.66 10.03 12.54 9.27 11.93 10.33 13.14 11.71
Gender
Male Female
Age Group
All
Age Group
All 18-30 30-40 40-66 18-30 30-40 40-66
2006 % 1.48 2.88 5.81 3.29 3.32 4.27 5.83 4.35
2009 % . . 0.07 0.02 . . . .
Trajectories
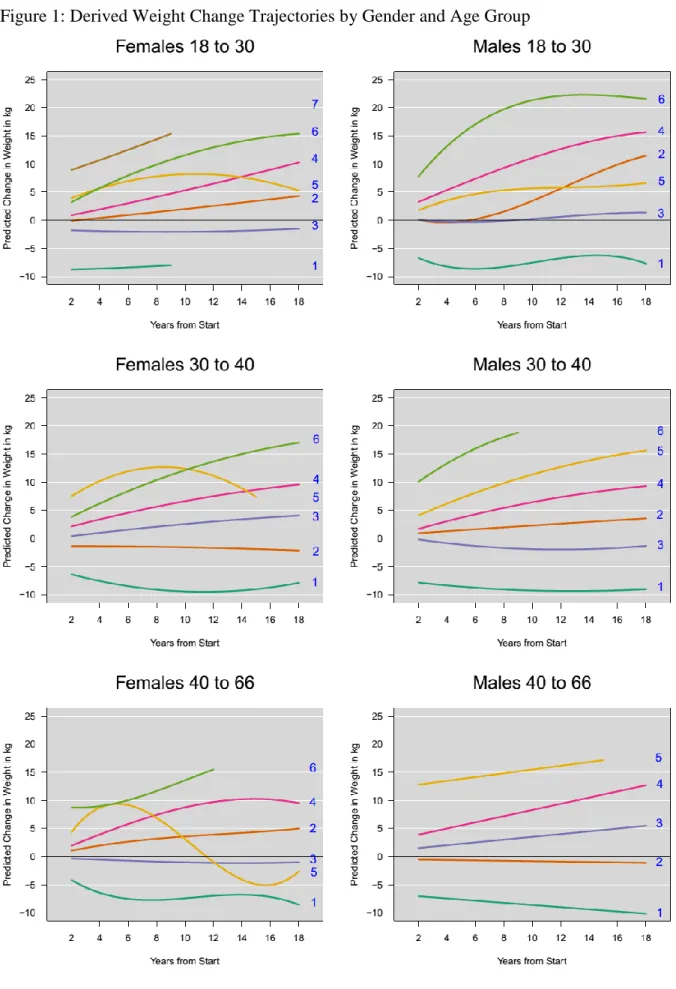
Trajectory results for all of the 6 baseline age-gender analysis groups, as well as the two overall gender groups, are shown in Table 2 and Figure 1. We classified the resulting classes based on rate and pattern of change.
Females
The number of weight change trajectories for adult female analysis groups ranged from 5 to 7. Analyses for females aged 18 to 30 showed 7 trajectories, and the remaining female
subgroups (30 to 40 at baseline and 40 to less that 66 at 2009) have a total of 6 weight change patterns. All age-specific analyses showed that a majority of each age subgroup followed a slow gain (low) pattern with 48.5%, 52.0%, and 42.5% respectively. The smallest percentages of group membership for our analysis populations were classified in the categories of each extreme of weight loss or weight gain. Females aged 40 to 66 had the largest percentage in a ‘weight loss’ pattern at 4.7% as compared to the younger age groups. Similar patterns and membership
percentages were seen in overall analyses for females as were found in the age-group specific analyses.
An interesting pattern is seen in females aged 40 to 66, where latent class analyses
identified a group of women with initial rapid gain followed by rapid loss and subsequent regain. Even though group membership in this category is only 1.8%, this unique pattern of weight change is important to note.
Males
males in the oldest age category experienced the highest membership percentage in the ‘weight loss’ category as compared to their younger counterparts at 4.4%.
Overall, trajectory analyses for males identified similar weight change patterns in analysis subgroups. However, over 25% of males aged 18 to 30 at baseline followed a slightly different pattern of weight change as compared to other age-groups with a moderate initial gain (low) with subsequent weight maintenance.
Table 2: Trajectory Descriptions, Average Posterior Probabilities and Group Membership Percentage
Trajectory n
Average Posterior
Probability Description Percent membership
Females 18 to
30 1931
Class 1 55 0.88958 Weight Loss 2.8
Class 2 936 0.95926 Slow gain (low) 48.5
Class 3 215 0.52368 Maintenance (referent) 11.1
Class 4 402 0.90291 Moderate gain (medium) 20.8
Class 5 78 0.3873 Initial gain with loss 4.0
Class 6 197 0.87751 Rapid gain (high) 10.2
Class 7 48 0.48088 Rapid gain (very high) 2.5
Females 30 to
40 1784
Class 1 56 0.71973 Weight Loss 3.1
Class 2 234 0.98051 Maintenance (referent) 13.1
Class 3 927 0.48022 Slow gain (low) 52.0
Class 4 483 0.70948 Moderate gain (medium) 27.1
Class 5 31 0.99939 Rapid gain (very high) with loss 1.7
Class 6 53 0.47836 Rapid gain (high) 3.0
Females 40 to
66 1418
Class 1 66 0.9251 Weight Loss 4.7
Class 2 602 0.50829 Slow gain (low) 42.5
Class 3 599 0.99024 Maintenance (referent) 42.2
Class 4 97 0.64078 Moderate gain (medium) 6.8
Class 5 26 0.71859 Rapid gain (high), rapid loss, regain 1.8
Class 6 28 0.52258 Rapid gain (very high) 2.0
Overall
Females 5133
Class 1 173 0.70755 Weight Loss 3.4
Class 2 952 0.98914 Maintenance (referent) 18.5
Class 4 1024 0.94752 Moderate gain (medium) 19.9
Class 5 290 0.96205 Rapid gain (high) 5.6
Males 18 to 30 1626
Class 1 61 0.9804 Weight Loss 3.8
Class 2 87 0.63113 Rapid gain (low) 5.4
Class 3 637 0.65049 Maintenance (referent) 39.2
Class 4 367 0.84248 Rapid gain (medium) 22.6
Class 5 414 0.7083
Moderate initial gain (low) with
maintenance 25.5
Class 6 60 1.0 Rapid gain (high) 3.7
Males 30 to 40 1566
Class 1 63 0.7436 Weight Loss 4.0
Class 2 769 0.89057 Slow gain (low) 49.1
Class 3 213 0.67171 Maintenance (referent) 13.6
Class 4 345 0.59191 Moderate gain (medium) 22.0
Class 5 145 0.96488 Moderate gain (high) 9.3
Class 6 31 0.99816 Rapid gain (very high) 2.0
Males 40 to 66 1425
Class 1 63 0.8983 Weight Loss 4.4
Class 2 627 0.9406 Maintenance (referent) 44.0
Class 3 546 0.54783 Slow gain (low) 38.3
Class 4 158 0.9975 Moderate gain (medium) 11.1
Class 5 31 0.98354 Slow gain (high) 2.2
Overall Males 4617
Class 1 168 0.90174 Weight Loss 3.6
Class 2 2262 0.67755 Slow gain (low) 49.0
Class 3 844 0.85161 Maintenance (referent) 18.3
Class 4 810 0.88709 Moderate gain (medium) 17.5
Class 5 443 0.91362 Moderate gain (high) 9.6
Generalized Linear Mixed Effects Models
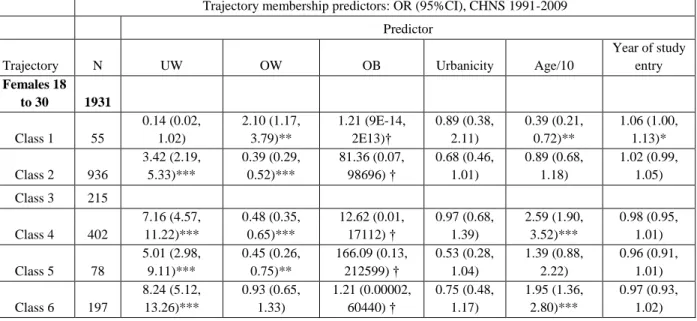
When considering results for each baseline age by gender subgroup analysis, as well as overall males and females, GLMM models showed that baseline urbanicity was not a significant predictor of trajectory membership after controlling for BMI category, baseline age, and baseline wave. However, exceptions were seen for young adult males and adult females overall, where baseline urbanicity was significant for trajectory membership. Young adult males living in rural areas at baseline have higher odds of weight gain than weight maintenance, whereas female adults overall in rural areas at baseline have higher odds of weight maintenance than slow weight gain. Additionally, these were borderline significant results with p-values near 0.04.
In general, baseline study year was not significantly associated with trajectory
membership. Notable exceptions include young males, where study year was significant for all trajectories except for the weight loss pattern. Young males had higher odds of following a weight maintenance pattern as opposed to weight loss pattern if they entered into the study prior to 2000. Adult males overall showed that baseline study year was also significant for all patterns except for one, with males having lower odds of weight maintenance as study year increases. Of note was that the GLMM results for young males could have been influenced by the use of a dichotomous baseline study year variable as opposed to a 6 category variable as used in the other subgroup analyses. Finally, baseline age was significantly associated with trajectory membership for most patterns for both males and females such that for each ten year increase in age the odds of weight maintenance are higher than their weight gain counterparts. One exception was for young adult females in the moderate gain (medium) and rapid gain (high) patterns, in which for each ten year increase in age, the odds of following these patterns are 2.4 and 1.9 times the odds of weight maintenance respectively.
Table 3: Odds Ratios and 95% Confidence Intervals for Predictors of Trajectory Membership Trajectory membership predictors: OR (95%CI), CHNS 1991-2009
Predictor
Trajectory N UW OW OB Urbanicity Age/10
Year of study entry Females 18
to 30 1931
Class 1 55
0.14 (0.02, 1.02) 2.10 (1.17, 3.79)** 1.21 (9E-14, 2E13)† 0.89 (0.38, 2.11) 0.39 (0.21, 0.72)** 1.06 (1.00, 1.13)* Class 2 936
3.42 (2.19, 5.33)*** 0.39 (0.29, 0.52)*** 81.36 (0.07, 98696) † 0.68 (0.46, 1.01) 0.89 (0.68, 1.18) 1.02 (0.99, 1.05)
Class 3 215
Class 4 402
7.16 (4.57, 11.22)*** 0.48 (0.35, 0.65)*** 12.62 (0.01, 17112) † 0.97 (0.68, 1.39) 2.59 (1.90, 3.52)*** 0.98 (0.95, 1.01) Class 5 78
5.01 (2.98, 9.11)*** 0.45 (0.26, 0.75)** 166.09 (0.13, 212599) † 0.53 (0.28, 1.04) 1.39 (0.88, 2.22) 0.96 (0.91, 1.01) Class 6 197
Class 7 48 12.06 (6.52, 22.30)*** 0.23 (0.08, 0.63)** 1.35 (2E-8, 7E7) † 0.49 (0.22, 1.10) 0.75 (0.40, 1.41) 1.05 (0.99, 1.11) Females 30
to 40 1784
Class 1 56
0.18(0.01, 2.45)*** 3.25(2.17, 4.87)*** 6.90(2.64, 18.05)*** 0.59(0.28, 1.28) 0.32(0.17, 0.59)** 1.04(0.99, 1.10) Class 2 234
Class 3 927
2.99(1.77, 5.03)*** 0.70(0.57, 0.86)** 0.38(0.20, 0.70)* 0.93(0.61, 1.43) 0.46(0.35, 0.61)*** 1.01(0.98, 1.05) Class 4 483
5.48(3.22, 9.32)*** 0.44*(0.34, 0.55)** 0.12(0.04, 0.33)*** 1.08(0.70, 1.67) 0.42(0.31, 0.57)*** 0.97(0.94, 1.00) Class 5 31
16.58(7.68, 35.82)*** 0.35(0.16, 0.78)** 0.006(6E-8, 671.80) † 1.28(0.41, 4.01) 0.20(0.09, 0.44)*** 1.03(0.97, 1.09) Class 6 53
7.72(3.90, 15.30)*** 0.86(0.55, 1.33) 0.010(1.6E-8, 59.62) † 1.59(0.76, 3.33) 0.16(0.09, 0.29)*** 0.87(0.80, 0.93)*** Females 40
to 66 1418
Class 1 66
0.38(0.08, 1.82) 4.07(2.86, 5.79)*** 6.51(3.15, 13.45)*** 0.57(0.29, 1.10) 1.38(0.82, 2.33) 1.01(0.93, 1.09) Class 2 602
1.32(0.95, 1.85)
0.42(0.35,
0.50)*** 0.63(0.39, 1.03)
0.91(0.61, 1.37) 0.86(0.57, 1.32) 0.98(0.91, 1.07) Class 3 599
Class 4 97
1.05(0.60, 1.83)
0.74(0.54,
1.00) 0.62(0.26, 1.47)
0.70(0.40, 1.22) 0.33(0.20, 0.55)*** 0.90(0.83, 0.97)** Class 5 26
0.94(0.35, 2.52) 1.93(1.20, 3.09)* 0.04(2E-5, 91.64) † 1.31(0.45, 3.78) 0.92(0.47, 1.82) 0.92(0.84, 1.00)* Class 6 28
5.43(2.53, 11.66)*** 0.31(0.17, 0.60)** 0.02(2E-5, 3.10) † 0.56(0.19, 1.60) 0.85(0.45, 1.63) 1.04(0.96, 1.13) Overall
Females 5133
Class 1 173
0.07(0.01, 0.42)* 3.05(2.46, 3.78)*** 5.55(3.28, 9.38)*** 0.65(0.41, 1.04) 0.64(0.57, 0.72)*** 1.07(1.03, 1.10)*** Class 2 952
Class 3 2694
2.13(1.76, 2.58)*** 0.51(0.46, 0.57)*** 0.56(0.41, 0.77)** 0.81(0.65, 1.00)* 0.80(0.76, 0.84)*** 1.02(1.01, 1.04)* Class 4 1024
2.94(2.40, 3.61)*** 0.48(0.42. 0.54)*** 0.20(0.11, 0.35)*** 1.01(0.75, 1.37) 0.74(0.70, 0.78)*** 0.98(0.96, 1.01) Class 5 290
5.21(4.07, 6.67)***
0.75(0.61,
0.92)* 0.51(0.22, 1.15)
0.88(0.61, 1.27) 0.49(0.44, 0.53)*** 1.00(0.97, 1.03) Males 18
to 30 1626 OW/OB
<2000 vs. >2000 Class 1 61
4.6E-5(9E-27,
2E17) † 3.92(2.20, 6.98)***
0.59(0.12, 2.87) 0.26(0.15, 0.43)*** 1.18 (0.59, 2.37) Class 2 87
1.15(0.75,
1.75) 0.45(0.24, 0.84)*
4.04(1.13, 14.42)* 1.29(0.89, 1.88) 14.54 (4.91, 43.04)*** Class 3 637
Class 4 367
1.48(1.13,
1.94)* 0.54(0.39, 0.77)**
0.68(0.42, 1.12) 0.73(0.57, 0.93)* 1.74(1.24, 2.46)* Class 5 414
1.91(1.49,
2.46)*** 0.75(0.54, 1.04)
Class 6 60
9.93(6.11,
16.15)*** 0.35(0.16, 0.77)*
1.40(2.03, 1.40) 1.00(0.62, 1.63) 2.55(1.16, 5.63)* Males 30
to 40 1566
Class 1 63
0.13(0.01, 1.15) 3.10(2.00, 4.83)*** 30.62(5.39, 173.94)*** 0.99(0.45, 2.19) 1.01(0.52, 1.97) 1.08(0.96, 1.22) Class 2 769
2.27(1.42, 3.62)** 1.36(1.01, 1.83)* 5.19(1.10, 24.55)* 1.03(0.68, 1.56) 1.27(0.93, 1.75) 1.05(0.96, 1.16) Class 3 213
Class 4 345
2.87(1.78, 4.69)***
0.55(0.38,
0.80)* 1.14(0.19, 6.80)
1.02(0.66, 1.60) 0.44(0.31, 0.62)*** 1.01(0.89, 1.16) Class 5 145
4.49(2.64, 7.63)*** 0.51(0.32, 0.80)* 0.12(0.003, 5.02) 0.96(0.58, 1.60) 0.32(0.20, 0.49)*** 1.03(0.90, 1.18) Class 6 31
4.35(1.68, 11.24)* 0.14(0.04, 0.54)* 0.08(3E-8, 2E5) † 1.70(0.50, 5.50) 0.08(0.03, 0.21)*** 1.18(1.04, 1.32)* Males 40
to 66 1425
Class 1 63
0.11(0.01, 2.26) 11.05(7.35, 16.61)*** 18.50(8.42, 40.65)*** 1.05(0.51, 2.19) 0.92(0.58, 1.46) 1.04(0.99, 1.10) Class 2 627
Class 3 546
1.20(0.86, 1.67)
0.66(0.54,
0.81)*** 0.92(0.53, 1.60)
0.93(0.60, 1.42) 0.59(0.48, 0.72)*** 1.02(1.00, 1.04)* Class 4 158
1.87(1.19, 2.93)* 0.35(0.25, 0.48)*** 0.03(0.004, 0.28)* 0.87(0.52, 1.44) 0.65(0.48, 0.88)* 0.99(0.95, 1.03) Class 5 31
3.64(1.58, 8.36)*
0.08(0.02,
0.26)*** 0.65(0.14, 3.02)
0.56(0.20, 1.58) 0.28(0.15, 0.53)*** 1.13(1.06, 1.21)** Overall
Males 4617
Class 1 168
0.11(0.02, 0.46)* 4.23(3.35, 5.35)*** 10.36(5.93, 18.08)*** 0.89(0.53, 1.49) 0.71(0.63, 0.80)*** 1.06(1.03, 1.10)** Class 2 2262
1.82(1.49, 2.22)***
0.64(0.56,
0.73)*** 1.09(0.71, 1.67)
0.85(0.67, 1.09) 0.75(0.72, 0.79)*** 1.04(1.03, 1.06)*** Class 3 844
Class 4 810
1.69(1.34, 2.12)*** 0.45(0.38, 0.53)*** 0.32(0.16, 0.64)* 0.87(0.64, 1.18) 0.65(0.62, 0.69)*** 1.00(0.98, 1.02) Class 5 443
3.43(2.69, 4.38)***
0.32(0.26,
0.41)*** 0.35(0.15, 0.85)
0.83(0.56, 1.21) 0.44(0.41, 0.47)*** 1.04(1.01, 1.07)* Class 6 90
6.85(4.63, 10.13)***
0.12(0.06,
0.23)*** 1.81(0.65, 5.06)
1.17(0.63, 2.16) 0.28(0.24, 0.33)*** 1.18(1.13, 1.23)***
All predictors are baseline values of designated variable
Age is scaled by a factor of 10 such that OR's represent change in odds with each decade increase in age * p<0.05
** p<0.001 *** p<0.0001
† Inadequate Sample Size
In this paper we calculate weight change trajectories for Chinese adults participating in the CHNS during the 18 year period from 1991 to 2009. Through use of latent class trajectory analysis, we produced trajectories corresponding to patterns of weight change across the life cycle and explore factors associated with these patterns. Similar weight change trajectories were derived for each age by gender analysis subgroup, as well as for males and females overall, however, some unique patterns were identified in age-group analyses that were lost in overall analyses. This paper contributes to research supporting the importance of age-group specific analyses when deriving latent class trajectories for weight change. Females 40 to 66 experienced a pattern of weight gain, loss, and regain that was not seen in either of the younger age groups. When analyzing females overall, this pattern is lost. Additionally, a pattern of initial weight maintenance followed by rapid gain was detected in male youth, 18 to 30, which again was not identified when conducting overall analyses for males.
Membership percentage in a ‘weight loss’ pattern was highest for the oldest age group as compared to younger age groups for both males and females. Analyses show that the majority of adults in the 40 to 66 age group follow either a ‘maintenance’ or ‘slow gain (low)’ pattern of weight change.
Across all age and gender groups, the most highly significant predictor of trajectory membership was baseline weight status. In general, those overweight or obese at baseline have higher odds of following a ‘weight loss’ pattern compared to the maintenance referent.
Contrastingly, those who were underweight at baseline have higher odds of following a ‘weight gain’ pattern, regardless of initial gain and following rate of gain, as compared to the
maintenance referent. An exception to this finding is discovered in the oldest group of female subjects, where underweight at baseline is only significantly predictive of membership in the rapid gain (very high) pattern such that those underweight at baseline have higher odds of rapid gain as compared to normal weight counterparts.
Contrary to our hypothesis, analyses show that those overweight at baseline had higher odds of following a weight loss pattern and lower odds of membership in weight gain patterns. However, similar conclusions cannot be made for those obese at baseline. Our sample has a small proportion of obese individuals, which contributed to wide confidence intervals for odds ratios corresponding to this predictor. Future analyses will seek to repeat the mixed model analyses with inclusion of a three category BMI variable which collapses the overweight and obese categories into a single OW/OB category in an attempt to obtain more meaningful and narrow confidence intervals.
The obesity epidemic, which was once thought to be primarily a concern only for
developed countries such as the United States and European countries, has now been shown to be an emerging problem in developing countries.1,20 Developing countries whose problems were
may be higher in developed countries, the increased population density in developing countries translates into larger numbers of individuals being affected by obesity.1 Dietary composition is changing in low income countries such that individuals in these developing populations have access to diets of increasing energy density.20 An increase in BMI and obesity-related diseases such as diabetes has been detected in other developing countries such as India.21,22
Latent class analysis is a statistical method which serves to categorize individuals from a heterogeneous population into homogenous subgroups which exhibit meaningful differences with respect to a particular variable of interest, weight change in this case.14,23 Additional research can then determine other characteristics these groups have in common in order to inform possible public health interventions and recommendations for future weight control programs for these populations. While latent class trajectory models have been used extensively in the mental health and drug abuse literature,24,25 behavioral and developmental psychology,11,12 and recently to characterize dietary patterns,26,27 it has been less frequently used to characterize changes in weight across the life course, but these models have the potential to be quite useful in this setting.
Research that has utilized latent class trajectory modeling for identification of changes in weight and BMI over time have focused on overall analyses for a large age range and many have computed such analyses using self-reported height and weight data.14,15,16,17 Furthermore, some these studies provide cohort sequential data and may only provide repeated data for a random sample of the initial analysis population over time.16,17 The data from the China Health and Nutrition Survey used in this paper provided 18 years of longitudinal data for which
anthropometrics were obtained by trained health professionals, and additionally collected for the same household members over time.3,18
References:
1. Kelly, T., Yang, W., Chen, C.S., Reynolds, K., He, J. [2008]. Global burden of obesity in 2005 and projections to 2030. International Journal of Obesity. Vol. 32: 1431-1437.
2. Popkin BM. [2001]. Nutrition in transition: the changing global nutrition challenge. Asia Pac J Clin Nutr. Vol. 10 Suppl:S13-8.
3. Popkin, B. [1995]. Body Weight Patterns among the Chinese: Results from the 1989 and 1991 China Health and Nutrition Surveys. American Journal of Public Health, Vol. 85(5): 690-694.
4. Muthén, B., Brown, C.H., Masyn, K., Jo, B., Khoo, S.T., et. al. [2002]. General growth mixture modeling for randomized preventive interventions. Biostatistics. Vol. 3: 459-475.
5. Nagin, D.S., Odgers, C.L. [2010]. Group-based trajectory modeling in clinical research. The Annual Review of Clinical Psychology. Vol. 6:109-138.
6. Andruff, H., Carraro, N., Thompson, A., Gaudreau, P., Louvet, B. [2009]. Latent Class Growth Modelling: A Tutorial. Tutorials in Quantitative Methods for Psychology. Vol. 5(1): 11‐24.
7. Jones, B.L., Nagin, D.S. [2007]. Advances in group-based trajectory modeling and an SAS procedure for estimating them. Sociological Methods and Research. Vol. 35(4): 542-571.
8. Nagin DS. [1999]. Analyzing developmental trajectories: A semiparametric, group-based approach. Psychological Methods. Vol. 4(2): 139.
9. Nagin, D.S., Tremblay, R.E. [1999]. Trajectories of boys’ physical aggression,
opposition, and hyperactivity on the path to physically violent and nonviolent juvenile -delinquency. Child Development. Vol. 70: 1181-1196.
11. Croudace, T.J., Jarvelin MR, Wadsworth ME, Jones PB. [2003]. Developmental typology of trajectories to nighttime bladder control: epidemiologic application of longitudinal latent class analysis. American Journal of Epidemiology. Vol. 157(9): 834-42.
12. Tremblay, R.E., Nagin, D.S., Seguin, J.R., [2005]. Physical aggression during early childhood: trajectories and predictors. The Canadian Child and Adolescent
Psychiatric Review. Vol. 14: 3-9.
13. Li., C., Goran, M.I., Kaur, H., Nollen, N., Ahluwalia, J.S., [2007]. Developmental trajectories of overweight during childhood: role of early life factors. Obesity. Vol. 15: 760-771.
14. Ostbye, T., Malhotra, R., Landerman, L.R. [2011]. Body mass trajectories through adulthood: results from the National Longitudinal Survey of Youth 1979 Cohort (1981-2006). International Journal of Epidemiology. Vol. 40: 240-250.
15. Clarke, P., O’Malley, P.M., Johnston, L.D., Schulenberg, J.E. [2009]. Social
disparities in BMI trajectories across adulthood by gender, race/ethnicity and lifetime socio-economic position: 1986-2004. International Journal of Epidemiology. Vol. 38:499-509.
16. Clarke, P.J., O’Malley, P.M., Schulenberg, J.E., Johnston, L.D. [2010]. Midlife health and socioeconomic consequences of persistent overweight across early adulthood: findings from a national survey of American adults (1986-2008). American Journal of Epidemiology. Vol. 172:540-548.
17. Jun, H-J., Corliss, H.L., Nichols, L.P., Pazaris, M.J., Spiegelman, D., Austin, B. [2012]. Adult body mass index trajectories and sexual orientation. American Journal of Preventive Medicine. Vol. 42(4): 348-354.
18. Popkin, B.M., Du, S., Zhai, F., Zhang, B. [2010]. Cohort Profile: The China Health and Nutrition Survey – monitoring and understanding socio-economic and health change in China, 1989-2011. International Journal of Epidemiology. Vol. 19(4): 853-860.
20. Prentice, A.M. [2006]. The emerging epidemic of obesity in developing countries. International Journal of Epidemiology. Vol. 35: 93-99.
21. Ramachandran, A., Mary, S., Yamuna, A., Murugesan, N., Snehalatha, C. [2008]. High prevalence of diabetes and cardiovascular risk factors association with urbanization in India. Diabetes Care. Vol. 31: 893-898.
22. Yadav, K., Krishnan, A. [2008]. Changing patterns of diet, physical activity and obesity among urban, rural and slum populations in north India. Obesity Reviews. Vol. 9:400-408.
23. Jung, T., Wickrama, KAS. [2008]. An introduction to latent class growth analysis and growth mixture modeling. Social and Personality Psychology Compass. Vol. 2: 302-317.
24. Hamil-Luker, J., Land, K.C., Blau, J. [2004]. Diverse trajectories of cocaine use through early adulthood among rebellious and socially conforming youth. Social Science Research Vol. 33(2): 300-21.
25. Hunter, A, M., Muthén, B.O., Cook, I.A. & Leuchter, A. F. [2010]. Antidepressant response trajectories and quantitative electroencephalography (QEEG) biomarkers in major depressive disorder. Journal of Psychiatric Research. Vol. 44(2): 90-98.
26. Padmadas, S.S., Dias, J.G., Willekens, F.J. [2005]. Disentangling women’s responses on complex dietary intake patterns from an Indian cross-sectional survey: a latent class analysis.
27. Sotres-Alvarez, D., Herring, A.H., Siega-Riz, A-M. [2013]. Latent Transition Models to Study Women's Changing of Dietary Patterns From Pregnancy to 1 Year
Postpartum. American Journal of Epidemiology. Vol. 177(8): 852-861.
28. Chan, K.W., Hu, Y. [2003]. Urbanization in China in the 1990s: New Definition, Different Series, and Revised Trends. The China Review. Vol. 3(2): 49-71.