1
Acknowledgement
This database software has been developed with the cooperation of the UN system. The product has been adapted from UNICEF ChildInfo technology.
Contents
INTRODUCTION
... 6
OVERVIEW ... 6
What’s new in DA 6.0?... 6
Main Features of DA 6.0 ... 7
Guide summary ... 7
User Interface overview ... 9
CHAPTER 1
... 11
GETTING STARTED ... 11
System Requirements... 11
Installing the DA 6.0 application ... 11
CHAPTER 2
... 13
TEMPLATE ... 13
New ... 15
Open ... 29
Update Registry ... 30
Edit GIDs ... 31
Merge Template ... 33
Compliance to Registry ... 37
CHAPTER 3
... 41
DATA ENTRY ... 41
New ... 42
Open ... 52
User Profiles ... 54
CHAPTER 4
... 57
TOOLS ... 57
Import ... 58
Recommended Sources ... 73
Validate from Registry... 75
Spell Check ... 78
CHAPTER 5
... 80
REPORTS ... 80
Summary Report ... 80
Comparison Report ... 83
Range Check Report ... 86
CHAPTER 6
... 89
METADATA ... 89
Indicator, Area and Source ... 90
Database ... 94
CHAPTER 7
... 97
Mapping ... 97
Administrative Boundaries ... 98
Features ... 104
Groups ... 105
Clear... 107
CHAPTER 8
... 109
LANGUAGE ... 109
New ... 110
Open ... 114
CHAPTER 9
... 115
CUSTOMIZE ... 115
New ... 116
Open ... 131
CHAPTER 10
... 132
GALLERY ... 132
CHAPTER 11
... 139
DATA EXCHANGE... 139
Converting data from other applications or standard reports into DevInfo ... 140
Converting a DevInfo 5.0 database into a DevInfo 6.0 database and vice-versa ... 144
Managing DevInfo database comments ... 150
Uploading a thematic DevInfo Data Entry Spreadsheet to create a DevInfo database (for example, UNDAF) ... 155
Updating map files from the DevInfo Digital Map Registry ... 159
CHAPTER 12
... 163
EMERGENCYINFO... 163
CHAPTER 13
... 164
STANDARDS ... 164
DX DES to SDMX-ML ... 165
DX SDMX Export ... 167
DX SDMX Import ... 171
DX SDMX-ML to DES ... 174
CHAPTER 14
... 178
INTERFACE MENU BAR ... 178
File ... 179
Edit ... 183
The DevInfo 6.0 Database Administration (DA) application allows you to create DevInfo 6.0 databases which can be accessed using the DevInfo 6.0 User application. DevInfo is a database system for monitoring human development. It is a powerful tool for organizing, storing and presenting data in a uniform way, allowing data to be easily and quickly shared across government departments, UN agencies and other development organizations. DevInfo is endorsed by the United Nations to monitor progress achieved toward the Millennium Development Goals. With DevInfo, you are literally just a few clicks away from getting facts needed to make evidence-based decisions.
DA 6.0 contains many new advanced features which provide more flexibility to the user and streamline the database creation process.
Overview
What’s new in DA 6.0? See what’s new in this version.
Main features of DA 6.0 Discover the main features of DA 6.0.
Guide summary Get a quick overview of the contents of each chapter.
User interface overview Learn your way around the DA 6.0 user interface.
What’s new in DA 6.0?
In this release, you will find the following new features:
• Subgroups expanded from 4 to n dimensions • Streamlined template creation process • Enhanced mapping management
INTRODUCTION
• Live Update feature
Main Features of DA 6.0
DA 6.0 contains 12 modules which allow users to handle different aspects of database development and management. The main application features include the following:
• User-friendly common interface for all modules
• Multi-tasking capabilities to allow multiple modules to run simultaneously • Access to remote online databases
• Online data entry and editing • Digital map handling capabilities • Utility to create online web galleries
• Data exchange utilities to facilitate data sharing across different applications
• Metadata utilities t o s tore i nformation c ompliant with i nternational s tandards i n X ML format
• Online registry for global indicators
• Streamlined data entry using spreadsheets and grids
• Enhanced integration of Unicode for multiple language support • State-of-the-art .NET technology for application development
Guide summary
This guide contains fourteen chapters, each of which provides step-by-step explanations for the various modules, utilities and options.
Chapter 1, “Getting Started,” outlines the system requirements and installation procedure.
Chapter 2, “Template,” explains the process of creating and editing a DevInfo 6.0 database template.
Chapter 3, “Data Entry,” explains the process of entering time periods, sources and data values against the database elements defined in the template. You can also learn how to use the advanced features of the Data Entry module such as importing data from spreadsheets and adding footnotes.
Chapter 4, “Tools,” outlines advanced data management options such as Import, Export, Split and Extract. You can also learn how to mark recommended sources, validate databases and check
Chapter 5, “Reports,” explains the use of diagnostic reports such as the Summary Report, Comparison Report, and Range Check Report.
Chapter 6, “Metadata,” guides you through the process of creating and editing metadata information for database elements such as indicators, digital maps and data sources.
Chapter 7, “Mapping,” outlines the steps for advanced map editing. You can learn how to associate digital map files to area names, split a composite map into individual shapefiles and associate features such as roads and rivers to areas.
Chapter 8, “Language,” takes you through the steps involved in translating the strings of the user interface, template and database into other languages.
Chapter 9, “Customize,” outlines the steps for customizing the skin of the DevInfo 6.0 User interface. You can learn how to change the application name, logo, color scheme and images.
Chapter 10, “Gallery,” guides you through the process of publishing the presentation outputs (tables, graphs and maps) to your own web gallery.
Chapter 11, “Data Exchange,” outlines the steps involved in importing data from other software applications into DevInfo 6.0.
Chapter 12, “EmergencyInfo,” discusses the main features of the EmergencyInfo application utilities used for disaster management.
Chapter 13, “Standards,” takes you through the steps of generating and using SDMX-compatible file formats for data exchange.
Chapter 14, “Interface Menu Bar,” explains the various options on the interface menu bar, including the DA “Live Update” feature.
User Interface overview
The DA 6.0 application opens with a common work area (Fig. 1).
Fig. 1 DevInfo 6.0 home page
The left panel displays the modules that you choose to install during DA 6.0 installation. Click the module name or the arrow to expand or collapse the various modules. For example, clicking Template expands the Template module, displaying further options (Fig. 2).
Fig. 2 Expanded Template module
Each module in DA 6.0 is a wizard which guides you step-by-step through the process of completing the task.
Menu bar
Click the module name or the arrow to expand or collapse
Click the grey bar to hide or display the left panel
The Menu Bar at the top of the window contains three menu items: File, Edit and Help. The Status Bar at the bottom of the window indicates the progress of the action being processed. It also displays the system date and time.
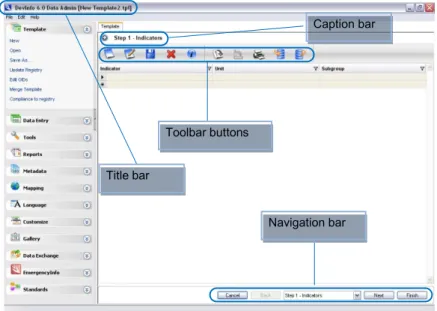
Fig. 3 Standard DA 6.0 user interface
The standard DA 6.0 user interface contains the following items (Fig.3):
• The title bar displays the name of the application and the working file.
•
The caption bar displays the current wizard step for the module being used.•
The toolbar contains buttons used for common functions.•
The navigation bar helps you navigate between the steps of the module. It contains the following buttons: Cancel, Back, Next and Finish, as well as a wizard step box with a drop-down list.o Click Cancel to ignore any action and exit the module without saving any changes.
o Click Back to return to the previous step.
o The wizard step box displays the current module step and allows you to navigate between steps. C lick the step box to display a list of all the module steps, and move to any step by clicking the desired step from the list.
o Click Next to proceed to the next step.
Caption bar
Title bar
Toolbar buttons
Getting Started
System Requirements
The recommended minimum hardware requirements to install and run the DevInfo 6.0 application are as follows:
• Pentium IV • 512 MB of RAM
• 1 GB of free hard disk space • Display resolution 1024 x 768 • Microsoft Windows XP or above • Microsoft Internet Explorer
• Microsoft Office XP is recommended but not required
Installing the DA 6.0 application
To install the DA 6.0 application on your computer, follow these steps:
• Insert the DevInfo 6.0 Database Administration CD into the CD-ROM drive. • Wait for Auto-run to open the Setup screen.
• Follow the instructions that appear on the screen to complete setup.
• Double-click t he DevInfo 6.0 Data Admin icon on t he des ktop t o s tart the application.
If the setup program does not load automatically, then do the following: • Go to Start and click Run.
• Type d:\setup (where “d” is the location of your CD-ROM drive) and press ENTER. • Follow the instructions that appear on your screen to complete setup.
• Double-click t he DevInfo 6.0 Data Admin icon on t he desktop to s tart the application.
Note: Installing DA 6.0 modules
By default, the installation process installs all the DA 6.0 modules. To choose not to install a particular module, clear the check box next to the module.
Template
The Template module allows you to create or modify a DevInfo database template. The database template provides the structural model for building a DevInfo database. It specifies the elements against which data can be entered into a DevInfo database. While creating a template, you can do the following:
• Define indicators
• Define units of measurement
• Define subgroups, such as sex, location, age group and others • Link indicators, units and subgroups to form I-U-S combinations
• Categorize I -U-S c ombinations un der v arious i ndicator c lassifications, s uch as Sector, Goal, Framework, Theme, Institution and Convention
• Define geographic areas • Link geographic areas to maps
A template can contain both global and local (user-defined) elements. Global elements, which are displayed in a different color, are imported from the DevInfo Registry and cannot be modified by the user. However, local (user-defined) elements can be created and modified in the Template module.
The Template module contains the following options (Fig 2.1):
Fig. 2.1 Template module options
New Allows you to create a new template
Open Allows you to open an existing template, including a template from
an existing database file
Save As… Saves the working file under a different file name or in a different
location
Update Registry Updates your local DevInfo Registry from the online DevInfo Global
Registry
Edit GIDs Allows you to manage the global identification numbers assigned to
DevInfo database elements
Merge Template Allows you to merge two or more templates
Compliance to registry Checks the consistency of your template elements against the
DevInfo Registry
New
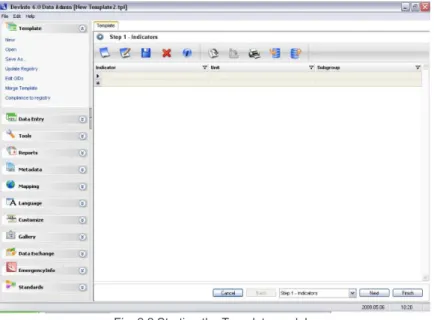
The New option allows you to create a new template. When you click New, the window displays Step 1 of creating a template (Fig. 2.2).
Fig. 2.2 Starting the Template module
Step 1 - Indicators
Click the empty cell under Indicator to enter the indicator name(s) in the template (Fig. 2.3). The indicator name can contain letters, numbers and/or other characters.
Fig. 2.3 Entering the indicator name
To enter and manage all the indicator names in a single window, click the arrow to the right of the Indicator cell and select Indicators from the drop-down list to open the Indicator window (Fig 2.4).
Fig. 2.4 Entering indicator names in the Indicator window
Click here to enter theindicator name
The following buttons are available in the Indicator window:
Submit Submits and saves the newly-entered indicator
New … Clears the box to allow you to enter a new indicator
Edit Allows you to edit the current indicator in the box
Delete Deletes the selected indicator from the list
Import Opens the Import window to allow you to import indicators either from the
DevInfo Registry or from an existing DevInfo database or template
When you are finished entering indicator names, click OK to save and close.
Units
Click the empty cell under Unit to enter the unit name. To enter and manage all the unit names in a single window, click the arrow to the right of the Unit cell and select Units from the drop-down list to open the Unit window. Note that this contains the same buttons as the Indicator window (Fig. 2.5).
Fig. 2.5 Entering unit names in the Unit window
Enter the desired unit names or import them from the DevInfo Registry or from other existing DevInfo databases or templates. When you are finished entering unit names, click to save and close.
Subgroups
DevInfo 6.0 allows for N-dimension subgroups. A subgroup is a subset within a sample or population identified by some common dimension such as sex (male/female) or location (urban/rural).
Subgroups allow for the disaggregation of the data for any given indicator.
Click the empty cell under Subgroup to enter subgroup data. The application prompts you to select one of the following from the list:
• Subgroups
• Subgroups Dimension values • Subgroup Dimension
First define the desired subgroup dimensions (such as sex, location, age, religion, or mother tongue) by selecting Subgroup Dimension from the list. This opens the Subgroup Dimension window, in which you can enter and manage all the subgroup dimensions. Note that this contains the same buttons as the Indicator window (Fig. 2.6).
Fig. 2.6 Entering subgroup dimensions in the Subgroup Dimension window
Enter the desired subgroup dimensions or import them from the DevInfo Registry or from other existing DevInfo databases or templates. When you are finished, click OK to save and close.
After defining the subgroup dimensions (for example, “Sex”) you can then define the subgroup dimension values (for example, “Male” and “Female”). Select Subgroup Dimension values from the
Fig. 2.7 Entering subgroup dimension values
Select the subgroup dimension for which you wish to enter values from the list in the Subgroup Dimension box. Then enter the desired values for the selected dimension in the Subgroup Dimension values box or import them from the DevInfo Registry or from other existing DevInfo databases or templates. When you are finished, click OK to save and close.
After defining the subgroup dimensions and the subgroup dimension values, you can define subgroups by selecting Subgroup from the list in the empty cell under Subgroup to open the Subgroup window. In this window you can define and manage all subgroups. Note that this contains the same buttons as the other windows (Fig. 2.8).
Select the check box next to the desired subgroup dimension value(s) to create a subgroup. To create combined subgroups (such as “Female 15-24 yr” and “Male 15-24 yr”), select multiple check boxes (for example, “Female,” “Male” and “15-24 yr”). Click Add to add the selected subgroup(s) to your template. Click Clear to clear all the subgroup check boxes. To add or edit dimension values, click Dimensions values to open the Subgroup Dimension values window.
Indicator – Unit – Subgroups
After defining the indicators, units and subgroups individually, you can now link them to create indicator - unit - subgroup (I-U-S) combinations. Select IUS from the drop-down list in any cell under Indicator to open the I-U-S window (Fig 2.9).
Fig. 2.9 Creating I-U-S combinations
In this window you can create and manage all the I-U-S combinations. Note that this window contains three panes:
• The Indicator pane at top contains indicators • The Unit pane at lower left contains units
• The Subgroup pane at lower right contains subgroups
Note the following two tools available above the Indicator pane:
When you are finished creating I-U-S combinations, click OK to save and close.
Toolbar
The DA toolbar contains the following tools which can help you define indicators:
Add Allows you to add a new indicator by creating a new row
Edit Allows you to edit the text of a highlighted indicator
Save Saves the template to the default location (C:\DevInfo\DevInfo 6.0\DevInfo 6.0\Data)
Delete Deletes the highlighted I-U-S row (click the row header to highlight
the row)
Information Displays information (metadata) for the highlighted inicator
Print Prints the list of indicators, units and subgroups entered in the template to a .pdf file and opens the document in the PDF viewer
Import Allows you to import indicators, units, subgroups, subgroup
dimensions and subgroup dimension values into the current template
Export Allows you to export the list of indicators, units and subgroups in the
Importing Indicators, Units, Subgroups
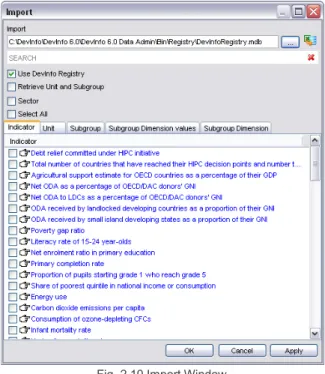
The Import tool allows you to import indicators, units and subgroups into the new template. Click Import to open the Import window (Fig. 2.10).
Fig. 2.10 Import Window
By default, the Use DevInfo Registry check box is selected to display elements from the DevInfo Registry, which is the repository of the global database elements as defined by the Global System Administrator. Note that there are five tabs in the Import window (Fig. 2.11).
Fig. 2.11 Five tabs in the Import window
By default, the Indicator tab is selected to display all the indicators available in the DevInfo Registry. Select the desired indicator(s) from the list.
Click any of the other four tabs to view and select their respective elements. You can also search the DevInfo Registry by entering keywords in the search box to search the DevInfo Registry for matching
Select the Retrieve Unit and Subgroup check box to retrieve and import pre-linked units and subgroups along with the selected indicator(s).
Select the Sector check box to retrieve and import pre-associated sector classifications along with the selected indicator(s).
To import elements from other DevInfo templates and databases, click to browse for the location of the desired file. To import elements from DevInfo data entry spreadsheets, click DevInfo Data Entry Spreadsheet.
Click Apply to import the selected elements and continue importing additional elements. Click OK to import the selected elements and exit.
When you are finished entering indicators, click Next to go to Step 2 of the Template module.
Step 2 - Indicator Classifications
In Step 2, you can link I-U-S combinations to different indicator classifications. The following classifications are available in DevInfo:
• Sector
• Goal
• Framework
• Theme
• Institution
Sector
Note that in the Step 2 - Indicator Classification window, the default indicator classification is by Sector (Fig. 2.12).
Fig. 2.12 Linking I-U-S combinations to indicator classifications
Click Import to import sector classifications from the DevInfo Registry. Alternatively, click New to create a new sector. The application creates a new sector level under the sector tree with the default text, “New item.” Type the desired sector name to overwrite the default text and press Enter. To create sub-sectors, click the desired sector and then click New. The application creates a new sector level under the desired sector. Repeat the process to create any number of sub-levels under each sector.
To edit any sector classification, select the desired text and click Edit. To exit the New or Edit modes, press ESC.
After you have finished defining the sector tree, you can link the I-U-S combinations to the newly-created sector classifications. Note that you can only link an I-U-S combination to the lowest level of any sector branch. Highlight the lowest level of the sector branch to which you wish to link the I-U-S
Note: Creating a new sub-sector after linking I-U-S combinations
If you create a new sub-sector under a sector to which you have already linked I-U-S combinations, the links will be automatically transferred to the new lower level.
Goal
Under the Goal classification, you can import or enter goals (such as the Millennium Development Goals) and then link the I-U-S combinations to them. The procedure for importing, entering and linking goals is the same as that for sectors.
Framework
Under the Framework classification, you can create a pictorial diagram of a framework using
flowchart elements and then link the I-U-S combinations to them. A framework is a systematic, logical structure which denotes the order of change or the cause-and-effect relationship between various processes. Note that the Framework window has a vertical toolbar at left (Fig. 2.13).
Fig. 2.13 Indicator Classification - Framework
Framework toolbar Edit text here
The Framework toolbar contains the following shape tools to create flowchart elements:
Creates a rectangle
Creates a rectangle with rounded corners
Creates a circle
Creates a rectangle with a beveled edge
Creates a triangle
Creates a decision box (diamond)
Use these flowchart elements to create framework components. Select any shape tool from the toolbar and then use the mouse to draw the component in the framework grid area. To fill the component with color, click to open the color palette and select the desired color.
To change the default component text, type the desired text in the text box located above the
Framework toolbar. To change the default text color, click to open the color palette and select the desired color.
To link framework components with a line, click a component and drag the mouse to the target component.
When you are finished creating framework components, link the I-U-S combinations to them by selecting a component and then selecting the desired I-U-S check boxes in the right pane.
Theme
Under the Theme classification, you can create themes and then link the I-U-S combinations to them. A theme is a central idea or concept which provides a broad perspective to interpret development initiatives or processes. The procedure for creating and linking themes is the same as that for sectors.
Institution
Under the Institution classification, you can create institutions (organizations) and then link the I-U-S combinations to them. Examples of institutions include governments, UN agencies and donor
agencies. The procedure for creating and linking institutions is the same as that for sectors.
Convention
Under the Convention classification, you can create conventions and then link the I-U-S
combinations to them. A convention refers to formal multi-lateral treaties negotiated among a large number of states, such as the Child Rights Convention, the Convention on Bio-diversity or the Vienna Convention on Law of Treaties. The procedure for creating and linking conventions is the same as that for sectors.
Step 3- Areas
In Step 3, you can add geographical areas and their digital maps to the template. Each geographical area has a unique Area ID which links the area to a digital map file.
Note that the Area window contains three panes (Fig. 2.14).
Fig. 2.14 Area window
Click Import to import the area names, Area IDs and digital maps from the DevInfo Registry or from other existing DevInfo databases or templates (Fig. 2.15).
Fig. 2.15 Importing areas, Area IDs and digital maps
Select the Map check box to import digital maps along with the area names. Select the desired area level from the Level box.
Click Apply to import the selected areas and continue importing other areas. Click OK to import the selected areas and exit.
To define a new area, select the desired node from the area tree under which you wish to create the new area and click New. Enter the area name and Area ID in the center pane and click Add. Note that you can add any number of geographic area levels to the area tree.
Note: Area IDs
Area IDs contain alphanumeric characters of varied length. They link area names with digital map files. The Area ID of the area name must match the Area ID of its associated digital map file.
To edit a created area, select the desired area from the left pane and click Edit. Enter the desired area name and Area ID in the center pane and click Update.
When you are finished adding areas, click Finish to save your template. The application will prompt you to select a file name before saving the template in the default location.
Open
To open and edit an existing template, click Open from the Template module. You will now be able to view the available templates in the default location (Fig. 2.16).
Fig. 2.16 Opening an existing template
Select a template from the available list and click Open. You can also browse for a template in another location.
Follow the same procedure explained earlier under New to edit the template elements.
Update Registry
The Update Registry option in the Template module allows you to update your local copy of the DevInfo Registry with the most recent changes made to the DevInfo Global Registry.
The DevInfo Registry (global.zip) contains the global template elements as defined by the Global System Administrator. A read-only copy of the registry is installed on your local computer at the time of installing the application.
Updating the registry is a one-step process. Note that you must be connected to the Internet to update the registry (Fig. 2.17).
Fig. 2.17 Updating the registry
To connect to the DevInfo Global Registry, you need to provide the following information:
Directory The folder location on the server
Click Finish to begin updating the registry. Note that this process may take some time, depending on the network connection and your hardware configuration.
Edit GIDs
The Edit GIDs option from the Template module allows you to edit the global identification numbers (GIDs) associated with DevInfo data elements.
Every data element created in DevInfo is assigned an auto-generated unique identification number, called a GID. These GIDs are used in various database administration processes. Because GIDs are auto-generated, they appear as complex strings (for example,
8B1C7469-D8EF-43AF-BD31-1824B6B1F7CB). If you wish, you can edit these GIDs and replace them with other strings.
Editing GIDs is a two-step process.
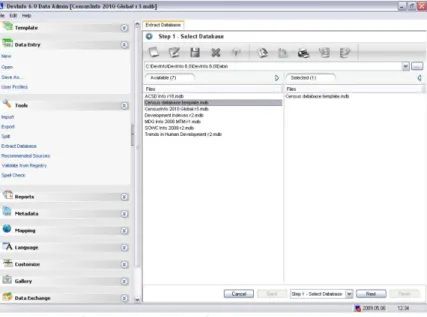
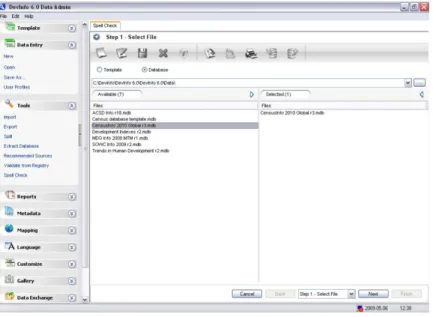
Step 1 – Select File
In Step 1, select the file in which you wish to edit the GIDs. Indicate whether you wish to edit the GIDs in a template or a database by selecting the desired file type below the toolbar (Fig. 2.18).
Click to browse for the file in another location. Select a file by double-clicking it to transfer it from the Available pane to the Selected pane.
Click Next to go to Step 2.
Step 2 – Edit GIDs
In Step 2, you can view and edit the GIDs in the selected file (Fig 2.19).
Fig. 2.19 Editing GIDs
Highlight any element category (such as “Indicator” or “Sector”) in the left pane to view and edit the GIDs for the category elements in the right pane.
Merge Template
The Merge Template option in the Template module allows you to merge two or more templates. Merging templates is a ten-step process.
Step 1 - Select Source Template
In Step 1, select the source template(s) to be merged. The templates available from the default location are displayed in the Available pane (Fig. 2.20).
Fig. 2.20 Selecting source templates
Click to browse for the file in another location. Select a file by double-clicking it to transfer it from the Available paneto the Selected pane.
Note that you can select multiple files to merge.
Step 2 - Select Target File
In Step 2, select the target file with which you wish to merge the source template(s). Indicate whether you wish to merge the source template(s) with a template or a database by selecting the desired file type from below the toolbar (Fig. 2.21).
Fig. 2.21 Selecting the target file
Click to browse for the file in another location. Select a file by double-clicking it to transfer it from the Available pane to the Selected pane.
Step 3 - Indicators
Steps 3 to 9 involve matching the different elements of the source file(s) with those of the target file. In each step, you can view the unmatched elements.
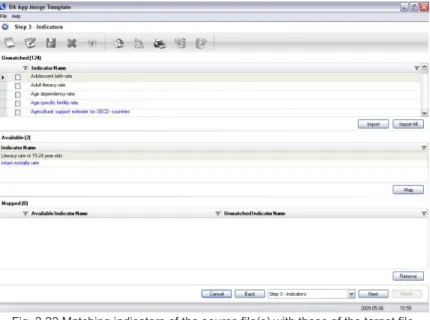
In Step 3, you need to either import unmatched indicators from the source file(s) into the target file or match them with those of the target file. The window displays the lists of unmatched and available indicators (Fig. 2.22).
Fig. 2.22 Matching indicators of the source file(s) with those of the target file
To import indicators from the source file(s) into the target file, select the desired indicator(s) and click Import in the Unmatched pane.
To match indicators, follow these steps:
• Select an unmatched indicator in the Unmatched pane.
• Highlight the indicator in the Available pane with which you wish to match the selected indicator.
• Click Map in t he Available pane. T he i ndicators will n ow be m atched i n t he Mapped pane.
Step 4 - Units
In Step 4, you need to either import unmatched units from the source file(s) into the target file or match them with those of the target file. The window displays the lists of unmatched and available units (Fig. 2.23).
Fig. 2.23 Matching units of the source file(s) with those of the target file
The process of importing and matching units is the same as that for indicators.
Steps 5, 6 and 7 - Subgroups
In Steps 5, 6 and 7 you need to either import unmatched subgroup dimensions, subgroup dimension values and subgroups from the source file(s) into the target file or match them with those of the target file. The process of importing and matching subgroup dimensions, subgroup dimension values and subgroups is the same as that for indicators.
Step 8 - Indicators Classifications
In Step 8, you need to either import unmatched indicator classifications from the source file(s) into the target file or match them with those of the target file. The process of importing and matching indicator classifications is the same as that for indicators.
Step 9 - Areas
In Step 9, you need to either import unmatched areas from the source file(s) into the target file or match them with those of the target file. The process of importing and matching areas is the same as that for indicators.
Step 10 - Process
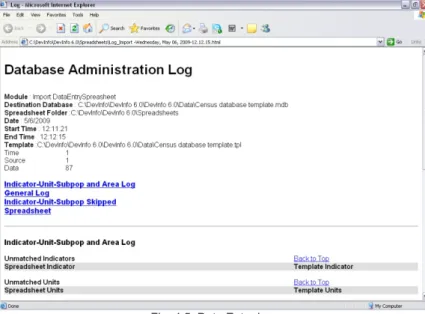
Click Finish to complete the process and merge the elements of the source file(s) with those of the target file. The application generates a DA App Merge Templatelog file, displaying details of the merge template process in the following location: C:\DevInfo\DevInfo 6.0\Spreadsheets (Fig 2.24).
Fig. 2.24 Merge Template log file
Compliance to Registry
The Compliance to Registry option in the Template module allows you to make your template or database compliant with the DevInfo Registry – that is, to ensure that your template or database contains all the elements found in the DevInfo Registry. This is useful, for example, if you wish to create a database containing all the global database elements (such as an MDG database).
This option instructs the application to check the GIDs of your template or database against those of the DevInfo Registry. If the GIDs match but the names (strings) are different, the application will
Making your template or database compliant with the DevInfo Registry is a nine-step process.
Step 1 - Select Target File
In Step 1, select the target file which you wish to make compliant with the DevInfo Registry. Indicate whether you wish to use a template or database by selecting the desired file type below the toolbar (Fig. 2.25).
Fig. 2.25 Selecting the target file
The files available from the default location are displayed in the Available pane. Click to browse for the file in a different location. Select a file by double-clicking it to transfer it from the Available pane to the Selected pane.
Click Next to go to Step 2.
Step 2 - Indicators
Steps 2 to 8 involve checking, importing, and/or matching the different elements of the DevInfo Registry against those of the target file. In each step, you can view the unmatched elements.
Fig. 2.26 Importing and matching indicators
To import unmatched indicators from the DevInfo Registry into the target file, select the desired indicator(s) and click Import or Import All in the Unmatched pane.
To match indicators, follow these steps:
• Select an unmatched indicator in the Unmatched pane.
• Highlight the indicator in the Available pane with which you wish to match the selected indicator.
• Click Map in t he Available pane. T he i ndicators will no w be m atched i n t he Mapped pane.
Step 3 - Units
In Step 3, you can either import or match the unmatched units from the DevInfo Registry with those available in the target file. The process of importing/matching units is same as that for indicators.
Steps 4, 5 and 6 - Subgroups
In Steps 4, 5 and 6, you can import or match the unmatched subgroup dimensions, subgroup
dimension values and subgroups from the DevInfo Registry with those available in the target file. The process of importing/matching subgroup dimensions, subgroup dimension values and subgroups is
Step 7 - Indicator Classifications
In Step 7, you can import or match the unmatched indicator classifications from the DevInfo Registry with those available in the target file. The process of importing/matching indicator classifications is same as that for indicators.
Step 8 - Areas
In Step 8, you can import or match the unmatched areas from the DevInfo Registry with those available in the target file. The process of importing/matching areas is same as that for indicators.
Step 9 - Process
In Step 9, the application processes the Compliance to Registry option. Click Finish to complete the process. The application generates a log file displaying details of the compliance to registry process in the following location: C:\DevInfo\DevInfo 6.0\Spreadsheets (Fig. 2.27).
Data Entry
The Data Entry module allows you to enter data to create a DevInfo 6.0 database. You can enter data against a template or directly into an existing database. Note that data can be entered only for those elements already defined in the template or database.
The Data Entry module contains the following four options (Fig. 3.1):
Fig. 3.1 Data window
New Allows you to enter data and create a new database
Open Allows you to enter or edit data in an existing database
Save As… Saves the working file under a different file name or in a different location
User Profiles Allows you to create and manage user accounts for online data entry
Each of these options will be explained below.
CHAPTER 3
New
The New option allows you to enter data and create a new database.
Creating a new database is a six-step process.
Step 1 - Select Template
In Step1, select the template against which you wish to enter data (Fig. 3.2).
Fig. 3.2 Selecting a template
The files available from the default location are displayed in the Available pane. Click to browse for the file in a different location. Select a file by double-clicking it to transfer it from the Available pane to the Selected pane.
Click Next to go to Step 2.
Step 2 - Select Indicator
In Step 2, select the indicator(s) for which you wish to enter data. Note that the Select Indicator window contains three panes: the indicator classification tree in the left pane, the Available pane and
Fig. 3.3 Selecting indicators
The left pane displays the indicator classification tree arranged by the default classification, Sector. Click any tree branch to view the indicators classified under that branch as well as available sub-branches. To view and select indicators by a different classification (such as Goal or Theme), select the desired classification from the menu below the toolbar.
Indicators are selected only when they appear in the Selected pane. The process of selecting an indicator involves transferring it from the Available pane to the Selected pane. To do this, you can do any of the following:
• Double-click the indicator
• Drag the indicator to the Selected pane
• Highlight the indicator and click Select Highlighted on the Available pane header
You can select multiple indicators by clicking one indicator and holding down the SHIFT key while using the arrow keys or the mouse to highlight a range of indicators.
To select all indicators in the Available pane, click Select All on the Available pane header.
Click here to select a different indicator classification
To remove one or more indicators from the Selected pane, you can do any of the following:
• Double-click the indicator(s)
• Highlight the indicator(s) and click Remove Highlighted on the Selected pane header
• Highlight the indicator(s) and press the DELETE key
To remove all the items from the Selected pane, click Remove All on the Selected pane header.
Click Show Units and Subgroups to toggle between viewing only indicators and viewing the entire I-U-S combinations.
When you are finished selecting the indicator(s) for which you wish to enter data, click Next.
Step 3 - Select Time
In Step 3, define and select the time period(s) for data entry. Note that there are two panes in the Select Time window, Available and Selected (Fig. 3.4).
To enter a new time period, click New on the toolbar to open the Time window (Fig. 3.5).
Fig. 3.5 Entering a new time period
Select the desired time format from the list in the Format box and enter the desired time period in the box below. Note that you can choose from the following time formats:
• yyyy • yyyy.mm • yyyy.mm.dd • yyyy-yyyy
• yyyy.mm – yyyy.mm • yyyy.mm.dd – yyyy.mm.dd
Click Apply to accept the time period entered and continue adding more time periods. When you are finished entering time periods, click OK.
To edit any of the time periods in the Available pane, highlight it and click Edit.
To sort the time periods in the Available pane in either ascending or descending order, click Time Period in the pane header. Click the small arrow next to Time Period in the pane header to toggle between ascending and descending order.
After defining the list of available time periods, select the desired time periods for data entry by transferring them from the Available pane to the Selected pane.
Step 4 - Select Areas
In Step 4, select the geographical area(s) for data entry. Note that the Select Area window contains three panes: the area tree in the left pane, the Available pane and the Selected pane (Fig. 3.6).
Fig. 3.6 Selecting areas
The left pane displays the area tree. Click any tree branch to view its sub-areas.
Select all desired area(s) for data entry by transferring them from the Available pane to the Selected pane.
To select all areas in the area tree for data entry, first specify the desired area level in the Area Level box in the pane header of the area tree pane. Then click Select All. Repeat the process to select all areas of a different area level.
Step 5 - Select Source
In Step 5, define and select the data source(s) of the data to be entered. Note that the Select Source window contains three panes: the source tree in the left pane, the Available pane and the Selected pane (Fig. 3.7).
Fig. 3.7 Selecting sources
To import sources from the DevInfo Registry or from other DevInfo templates or databases, click Import on the toolbar. The imported selections will appear in the Available pane.To enter a new source, click New on the toolbar to open the Source window (Fig. 3.8).
Fig. 3.8 Entering a new source
Enter the publisher, title and year of the source or select them from the drop-down list. Click Apply to accept the source that you entered and continue adding more sources. When you are finished adding sources, click OK.
Note that the source tree displays available sources organized by publisher. To edit any of the sources in the Available pane, highlight it and click Edit.
After defining the list of available sources, select the desired sources for data entry by transferring them from the Available pane to the Selected pane.
Tip: Defining publishers and titles for sources
The drop-down list in the Publisher box contains ISO codes for countries and standard
acronyms for international institutions. If the publisher is an international institution, enter the acronym of the institution (for example, UNDP or UNICEF). If the publisher is a government agency, enter the ISO code for the country.
For source titles, use abbreviations whenever possible - for example, “SOWC” in place of “State of the World’s Children.”
Step 6 - Data Entry
In Step 6, you can enter the data values for the various I-U-S combination(s), time period(s), area(s) and source(s) previously defined and selected to create a database.
If you selected multiple I-U-S combinations for data entry, then each I-U-S combination will be displayed in a separate node in the Data Entry window (Fig. 3.9).
Fig. 3.9 Entering data values
By default, groups are formed on the basis of indicators and units. To modify these groups, click the dotted line below the toolbar to display the grouping bar (Fig. 3.9). The grouping bar displays the sequence of elements by which the data view is grouped. To add a grouping element (for example, Source or Time), drag its column heading to the grouping bar. To remove a grouping element, drag it from the grouping bar back to its original location. To modify the grouping sequence, drag the elements to their desired places within the grouping bar.
Enter a data value for each row by clicking the corresponding cell in the Data column. Use the following right-click menu options to facilitate the data entry process:
Copy Copies the cell contents to the clipboard
Paste Pastes the copied contents from the clipboard to the desired cell(s)
Sort Sorts the data entry view according to the specified data elements
Drag any column heading to the grouping bar
Click here to display the grouping bar Grouping bar
Footnotes Opens the Footnotes window to allow you to add footnotes for data values (Fig. 3.10).
Fig. 3.10 Footnotes window
To create a new footnote, enter the footnote text in the box and click Submit to save it. You can also click Import to import footnotes. All available footnotes, whether created or imported, will appear in the Footnotes box.
To apply a footnote to a particular data value, click its cell in the data entry view and then click Footnotes from the right-click menu. Select the desired footnote and click OK.
Count Displays the count of the total number of records in the indicator grouping
Decimals Allows you to select the desired number of decimal places for the data
values
Denominator Inserts a new column in the data entry view to allow you to enter
Use the following tools from the toolbar to facilitate the data entry process:
Sort Sorts the data entry view according to the specified data elements
Export Exports the data entry view into various file formats such as .xls to allow for
data entry outside of the DevInfo application
When you are finished entering data values for all the rows in the data entry view, click Save to save all changes. Note that the application saves the database file with an .mdb extension. You can now return to Step 2 to specify the data entry parameters for other indicators. Data values
subsequently entered will be appended to the same database file at the time of saving.
Open
Click Open in the Data Entry module to enter and edit data in an existing database. Entering and editing data in an existing database is a six-step process.
Step 1 - Select Database
In Step 1, select the database in which you wish to enter and edit data. Note that the Select Database window contains two tabs: Online and Offline (Fig. 3.11).
Fig. 3.11 Selecting an offline database
The Offline tab is displayed by default. To enter and edit data in an offline database, select one of the databases available in the default location by double-clicking it to transfer it from the Available to the Selected pane or click to browse for the file in another location.
To enter and edit data in an online database hosted on a remote server, click the Online tab (Fig. 3.12).
Fig. 3.12 Selecting an online database
Click the online database box to view and select any previously-saved online database connections. Select the desired database and enter your user name and password at the bottom of the window to connect to the database. Once you are connected, you can enter or edit data.
To connect to an online database not listed, click New Connection to open the New Connection dialog box (Fig. 3.13).
Provide the requested information and click Test to authenticate the user name and password on the specified server. The system will return a “Connection successful” message after authentication. Click Save to save the connection for future use.
Steps 2 to 6 - Select Indicator, Time, Area and Source and Data Entry
These steps are the same as the steps involved in creating a new database. See New earlier in this chapter for more details.
User Profiles
The User Profiles option in the Data Entry module allows you to create and manage user accounts for online data entry – that is, entering data into a DevInfo 6.0 database located on a remote server. Using this option, you can add new users as well as set online database access rights.
Creating and managing user profiles is a two-step process.
Step 1 - Select database
In Step 1, select the server connection and access the remote database to manage the user profiles (Fig. 3.14).
Click the online database box to view and select any previously-saved online database connections. Select the desired database and enter your user name and password at the bottom of the window to connect to the database.
To connect to an online database not listed, click New Connection to open the New
Connection dialog box. Provide the requested information and click Test to authenticate the user name and password on the specified server. The system will return a “Connection successful” message after authentication. Click Save to save the connection for future use.
Click Next to go to Step 2.
Step 2 - Users
In Step 2, you can create new user accounts, modify existing user accounts and track access history.
Note that the Users window displays a list of existing users and their access rights (Fig. 3.15).
Click New to open the Users dialog box to create a new user account, or click Edit to edit an existing user account (Fig. 3.16).
Fig. 3.16 Creating and editing user accounts
In the Users dialog box, specify the desired user name and password in the respective boxes.
Specify the desired user access rights under Access To as follows:
All Grants the user source, time period, and administrator access rights
Source Grants the user source access rights. Note that granting source rights
automatically grants the user time period rights as well.
Time Period Grants the user time period access rights.
Administrator Grants the user administrator access rights, which allows the user to create and manage user accounts
Click OK to apply the changes, which will be reflected in the Users window.
Tools
The Tools module contains various tools to help database administrators perform important data management functions, including moving data between databases, splitting and extracting data from large databases, marking recommended sources, and checking databases for spelling mistakes and other inconsistencies.
The Tools module contains the following options (Fig. 4.1):
Fig. 4.1 Tools module options
Import Allows you to import data from spreadsheets and databases into a
DevInfo template or database
Export Allows you to export data from DevInfo templates or databases to
spreadsheets
Split Allows you to split large databases into smaller ones
Extract Database Allows you to extract or pull out a data set from a database based on
multiple selection criteria
CHAPTER 4
Validate from Registry Validates a template or database against the DevInfo Registry to check for inconsistencies and errors
Spell Check Checks a DevInfo template or database for spelling errors
Each of these options will be explained below.
Import
The Import option allows you to import data from DevInfo Data Entry spreadsheets and DevInfo databases into a DevInfo template or database. You can also use Import to merge databases.
Importing data is an eight-step process.
Step 1 - Select File
In Step 1, select the source file(s) to be imported. Indicate whether you wish to import a DevInfo Data Entry Spreadsheet or a database by selecting the desired file type below the toolbar (Fig. 4.2).
Note that you can select multiple files to import data from multiple sources.
Note: Selecting source data files to import
DevInfo allows you to import two types of data files. The first type is a DevInfo Data Entry Spreadsheet, which is created by exporting a DevInfo template to .xls format to allow for more convenient data entry. The second type is a DevInfo database.
Data from either of these file types can be imported against a reference template or into a database. If the data is imported against a reference template, a new database is created. If the data is imported into an existing database, the new data is simply appended to the existing database. Note that if a database source file is imported against a reference template, the database gets filtered based on the template before a new database is created.
Click Next to go to Step 2.
Step 2 - Select Database
In Step 2, select the reference file against which you wish to import the data. The data will be imported based on the indicators, units, subgroups and areas defined in the reference file.
Note: Selecting the reference file
If you select a template as the reference file, a new database will be created. If you select a database as the reference file, the source data will be appended to the reference database.
Indicate whether you wish to import the data against a template or into a database by selecting the desired file type below the toolbar (Fig. 4.3).
Fig. 4.3 Selecting the reference file
The files available from the default location are displayed in the Available pane. Click to browse for files in another location. Select a file by double-clicking it to transfer it from the Available pane to the Selected pane.
Step 3 - Indicator Matching
Steps 3 to 7 involve matching the different elements of the source file(s) with those of the reference file. In each step, you can view the unmatched element.
In Step 3, you can match the unmatched indicators of the source file(s) with those of the reference file (Fig. 4.4).
Fig. 4.4 Matching indicators
To match indicators, first select an unmatched indicator from the drop-down list in the Unmatched Indicators box. Then highlight the desired indicator in the Map To pane with which you wish to match it and click Apply. The matched indicators are displayed in the Mapped pane.
Continue this process until all desired unmatched indicators are matched.
Note: Matching indicators
Note that data for unmatched indicators will not be imported against the reference template or database.
Step 4 - Unit Matching
In Step 4, you can match the unmatched units of the source file(s) with those of the reference file. The process of matching units is same as that for matching indicators.
Step 6 - I-U-S Matching
In Step 6, you can match the unmatched I-U-S combinations of the source file(s) with those of the reference file. The process of matching I-U-S combinations is same as that for matching indicators.
Step 7 - Area Matching
In Step 7, you can match the unmatched areas of the source file(s) with those of the reference file. The process of matching areas is same as that for matching indicators.
Step 8 - Process
In Step 8, the application imports the data from the source file(s) against the selected reference template or into the selected database. Click Finish to complete the process. A log file is generated displaying details of the import process in the following location: C:\DevInfo\DevInfo 6.0\Spreadsheets (Fig. 4.5).
Fig. 4.5 Data Entry Log
Tip: Saving the database under a new file name
Export
The Export option allows you to export data from a DevInfo template or database to one or more DevInfo Data Entry spreadsheets, for data verification or data entry purposes.
Exporting data is a five-step process.
Step 1 - Selection
In Step 1, select the file which you wish to export. Indicate whether you wish to export a template or a database by selecting the desired file type below the toolbar (Fig 4.6).
Fig. 4.6 Selecting the file you wish to export
The files available from the default location are displayed in the Available pane. Click to browse for a file in another location. Select a file by double-clicking it to transfer it from the Available pane to the Selected pane.
Step 2 - Options
In Step 2, you can select various options related to how you wish to export data (Fig. 4.7).
Fig. 4.7 Selecting various export options
In the Location box just below the toolbar, the default location for saving the DevInfo Data Entry spreadsheets is displayed. Click to browse for and specify another location.
Below the Location box, select one of three options for exporting data into DevInfo Data Entry Spreadsheets:
Data Exports only data (where it exists)
Missing Data Exports both data (where it exists) and blank cells (where data does
not exist)
Blank Spreadsheets Generates one or more empty spreadsheets with blank cells for data
values
Select the Single Workbook check box to export the data to a single MS-Excel workbook. If this option is cleared, the application will generate separate workbooks for each indicator-unit combination.
Select the check boxes next to Indicator, Area, and the various indicator classification categories to create their respective lists as separate workbooks.
Step 3 - Data
In Step 3, select the desired data elements for which you wish to export data. Note the six tabs below the toolbar representing six categories of data elements to be selected: Indicator, Unit, Subgroup, Time, Area and Source (Fig. 4.8).
Fig. 4.8 Selecting data criteria
Click each of these six tabs and select the desired data elements for which you wish to export data by transferring them from the Available pane to the Selected pane.
Note: Selecting data elements
If you are exporting a database file, then data elements in each of the six tabs -
Indicator, Unit, Subgroup, Time, Area and Source - must be selected in order to
generate DevInfo Data Entry Spreadsheets. However, if you are exporting a template
Click each of these tabs to select the various elements for which you wish to export data
Step 4 - Sort
In Step 4, specify the desired sort order for the database elements in the Data Entry Spreadsheets (Fig. 4.9).
Fig. 4.9 Specifying the sort order
Select the desired sort elements by double-clicking them to transfer them from the Available pane to the Selected pane. You can choose any or all of the elements for sorting.
To modify the sort priority order of an element, highlight it and use the arrows in the Selected pane header to move it up or down the sort priority list.
To change the default sort order for any element from ascending to descending, click in front of the desired sort element.
Step 5 - Process
In Step 5, the application exports the data from the selected file to one or more DevInfo Data Entry Spreadsheets. The list of files to be exported is displayed in the window. Click Finish to complete the process. The application generates a log file displaying details of the export process.
Note: Naming DevInfo Data Entry Spreadsheets
DevInfo Data Entry Spreadsheet file names always start with “Data_”, so they can be easily distinguished from other MS-Excel spreadsheets.
Split
The Split option allows you to split a large database into one or more smaller databases based upon user-defined criteria.
Splitting a database is a four-step process.
Step 1 - Selection
In Step 1, select the database which you wish to split (Fig 4.10).
Fig. 4.10 Selecting the database which you wish to split
The files available from the default location are displayed in the Available pane. Click to browse for a file in another location. Select a file by double-clicking it to transfer it from the Available pane to
Click Next to go to Step 2.
Step 2 - Options
In Step 2, you can select various options for how you wish to split the selected database (Fig. 4.11).
Fig. 4.11 Selecting various split options
In the Location box just below the toolbar, the default location for saving the created database(s) is displayed. Click to browse and specify a different location.
By default, the Separate Database check box is selected to instruct the application to create
separate, multiple databases based upon the criteria to be defined. For example, if you select the two indicators “Population size” and “Annual number of births” as your criteria, the application would generate two separate databases, each containing data for one of the selected indicators.
To generate a single database containing all data based upon the criteria to be defined, clear the Separate Database check box. In the example above, the application would generate a single database containing data for both of the selected indicators.
Step 3 - Data
In Step 3, select the desired criteria for splitting the database from the list in the Split by box. You can select criteria from only one of the following six categories of data elements: Indicator, Unit, Subgroup, Time Period, Area or Indicator Classification (Fig. 4.12).
Fig. 4.12 Selecting the desired split criteria
Selecting Indicator, Area, or Indicator Classification causes the respective element tree to be displayed in the left pane. Selecting Unit, Subgroup, or Time Period causes the respective data elements to be displayed in the left pane. Select the desired elements by transferring them from the Available pane to the Selected pane.
Note: Selecting the desired split criteria
You can split the database into one or more smaller databases by specifying criteria from only one data element category at a time. For example, you can split the database into smaller databases by indicator, area, or time period.
However, you can select multiple data elements within a category for splitting. For example, you can select multiple indicators or multiple areas to split the database into one or more smaller databases containing data for your selections.
Step 4 - Process
In Step 4, the application splits the selected database into one or more smaller databases based upon the specified criteria. The list of new databases created is displayed in the window. Click Finish to complete the process. The application generates a log file displaying details of the split process.
Extract Database
The ExtractDatabase option allows you to extract or pull out a data set from a database based on multiple selection criteria.
Extracting a data set is a two-step process.
Note: Differences between Split and Extract Database options
When using the Split option, you can specify criteria from only one data element
category. When using the Extract Database option, you can specify criteria from
multiple data element categories.
When using Split,the result can be one or more databases. When using Extract Database, the
Step 1 - Selection
In Step 1, select the database from which you wish to extract data (Fig 4.13).
Fig. 4.13 Selecting the database from which you wish to extract data
The files available from the default location are displayed in the Available pane. Click to browse for the file in another location. Select a file by double-clicking it to transfer it from the Available pane to the Selected pane
Step 2 - Data
In Step 2, select the desired criteria for extracting the data from the database. Note the six tabs below the toolbar representing six categories of data elements from which you can select criteria: Indicator, Unit, Subgroup, Time, Area and Source (Fig. 4.14).
Fig. 4.14 Selecting criteria for the data to be extracted
Click any or all of these six tabs to view their respective data elements in the left pane. Select the criteria for which you wish to extract data by transferring the desired elements from the Available pane to the Selected pane.
Note that you can select criteria from multiple data element categories. For example, you can select a combination of indicator(s), area(s) and time period(s) to extract data based on your selections.
When you are finished selecting criteria, click Finish. Enter the desired filename in the window and click Save to extract the data from the database based upon your selected criteria. The application generates a log file displaying details of the extract process.
Recommended Sources
The Recommended Sources option allows you to mark one or more sources as a recommended or
preferred source.
Recommending sources is a two-step process.
Step 1 - Select Database
In Step 1, select the database in which you wish to mark recommended sources (Fig 4.15).
Fig. 4.15 Selecting a database
The files available from the default location are displayed in the Available pane. Click to browse for a file in another location. Select a file by double-clicking it to transfer it from the Available pane to the Selected pane.
Click Next to go to Step 2.
Step 2 - Change Recommendations
In Step 2, you can mark a particular source as recommended for each unique indicator-unit-subgroup (I-U-S) combination and assign it a rank as well as a label.