Publication Report
Estimating the National and Local Prevalence of
Problem Drug Use in Scotland 2012/13
1
Contents
1
Introduction ... 2
Acknowledgements ... 3
Key Points ... 4
Results and Commentary ... 6
Estimated Number of Problem Drug Users across Scotland ... 6
Scotland ... 6
Council Areas ... 8
Alcohol and Drug Partnerships ... 13
NHS Boards ... 16
Police Force Areas ... 19
A closer look at Shetland Islands ... 22
Individuals Known to Services for Problem Drug Use ... 22
Comparisons ... 23
Future Work ... 24
Injecting Drug Users ... 25
Alternative Data Sources ... 25
Glossary ... 26
List of Tables ... 28
List of Charts ... 29
Contact ... 30
Further Information... 30
Appendix ... 31
A1 – Background Information ... 31
Data Collection... 31
Methods ... 33
A2 – Advisory Group Membership ... 35
Social Work Rosemary White (Renfrewshire Council) ... 35
A3 – Publication Metadata (including revisions details) ... 36
Introduction
This report provides estimates of the national and local prevalence of problem drug use for those aged 15 to 64 in Scotland between April 2012 and March 2013. For this purpose, problem drug use is defined as the problematic use of opiates (including illicit and prescribed methadone use) and/or the illicit use of benzodiazepines and implies routine and prolonged use as opposed to recreational and occasional drug use.
These estimates provide an update to the previous estimates which were published by ISD in November 2011 covering problem drug use for those aged 15 to 64 in Scotland between April 2009 and March 2010. We are again reporting our estimates on the basis of financial year in order to align with the reporting of problem drug use estimates across other UK administrations.
Estimates for calendar years 2000, 2003 and 2006 were previously produced by
researchers at the University of Glasgow; however, the methods have remained consistent. The technique, commonly known as capture-recapture, estimates the size of the hidden population of problem drug users. This form of analysis uses multiple data sources, which in some way identify individuals with problem drug use, to identify how often people appear in more than one data source. Further analysis can then be used to estimate the hidden (unknown) population who appear in none of the data sources, which, combined with the known population, generates a prevalence estimate.
As much of the problem drug using population is hidden, prevalence figures can only ever be estimates, combining data about the known population (for example, those in contact with treatment services) and an estimate of the unknown population.
The earlier studies, those prior to 2006, estimated prevalence across a narrower age range of those aged 15 to 54. Otherwise, the definitions used for these latest estimates are
consistent with the definitions used in all the previous studies and rely on data from the following sources.
• clients registering with specialist drug treatment services • drug-related hospital admissions
• police reports to the Procurator Fiscal under the Misuse of Drugs Act (opiates and/or benzodiazepines)
• Criminal Justice Social Work reports mentioning opiates and/or benzodiazepines Estimates of the hidden population were obtained for each council area using capture-recapture statistical models, which were then added to the known population of problem drug users in each area. The overall Council estimates were then used as ‘building blocks’ for estimates at other geographical levels (e.g. Health Board and Police Force Area), with the cumulative total across all areas constituting a Scottish national estimate.
3
Acknowledgements
ISD Scotland acknowledges the contributions made by the following:
• The Scottish Government’s Drugs Policy Unit and Justice Analytical Services Division.
• Social Work Departments who made available the Criminal Justice Social Work Reports.
• Alcohol and Drug Partnerships who assisted in the collection of data from treatment services.
• Police Scotland who provided arrest data.
• ISD Scotland data management specialists who extracted the relevant information on problem drug use from Criminal Justice Social Work Reports.
• ISD Scotland information analysts who extracted the required dataset from the Scottish Drug Misuse Database and Scottish Morbidity Records.
• The Drug Prevalence Project Advisory Group who provided invaluable advice and assistance.
• Gordon Hay, Sharon Hutchinson, and Matthew Hickman who provided valuable technical input and expertise.
Key Points
The prevalence figures presented here are estimates. 95% confidence intervals are shown alongside the estimates as a measure of the reliability of the estimate1.
§ The estimated number of individuals with problem drug use in Scotland during 2012/13, aged 15 to 64 years old, was 59,500 (95% CI = 57,500 - 61,600). The equivalent
estimate for 2009/10, was 59,600 (95% CI = 58,300 - 61,000). Expressed as a
percentage of the population, the rate of problem drug use in 2012/13 was 1.68% (95% CI = 1.63% – 1.74%). This compares to an estimate of 1.71% (95% CI 1.67% - 1.75%) in 2009/10.
§ Taking into account confidence intervals, the evidence suggests that there has been no significant change in the number or rate of problem drug use since 2009/10.
§ As in previous years, the majority of individuals with problem drug use in Scotland during 2012/13 were male (71%). The estimated prevalence rate of problem drug use was 2.43% of all males aged 15 to 64 years, and 0.96% of all females aged 15 to 64 years, resident in Scotland during 2012/13.
§ The rate of problem drug use amongst all males in Scotland during 2012/13 was highest in the 25 to 34 years age-group. For males aged 15 to 24 and those aged 25 to 34, the rates are slightly lower than those previously published for 2009/10, however the rate has increased for those aged 35 to 64. The proportion of all male problem drug users that are aged 35 to 64 has increased from 43% in 2009/10 to 51% in 2012/13.
• Prevalence rates of problem drug use tend to be higher in non-rural areas; the four major cities of Aberdeen, Dundee, Edinburgh and Glasgow are all above the Scottish cumulative rate. Similarly, Inverclyde, North Ayrshire, Renfrewshire and West
Dunbartonshire are also higher than the Scottish rate. These Council Areas serve some of the most deprived communities in Scotland according to the Scottish Index of Multiple Deprivation 2012.
§ The Alcohol and Drug Partnerships with the highest prevalence rates of problem drug use are Inverclyde, Dundee City, and Glasgow City. The lowest estimates were observed in Orkney, East Dunbartonshire and Moray.
§ The estimates suggest that prevalence rates of problem drug use have increased between 2009/10 and 2012/13 across the Falkirk and Renfrewshire council areas and decreased across Angus, East Ayrshire and Glasgow City.
§ The estimates suggest that prevalence rates of problem drug use have increased between 2009/10 and 2012/13 across NHS Lothian and NHS Forth Valley and have decreased across NHS Ayrshire & Arran and NHS Greater Glasgow & Clyde.
1 . Confidence intervals indicate the range within which the true prevalence figure would be expected to lie. For example, a prevalence of ’59,500 (95% CI = 57,500 - 61,600)’ indicates that the estimate is 59,500 and we are 95% certain that the actual prevalence lies between 57,500 and 61,600.
5
§ The highest prevalence rate of problem drug use was in the former Strathclyde Police Force area.
§ The estimates suggest that prevalence rates of problem drug use have increased between 2009/10 and 2012/13 across the former Lothian & Borders and Central Scotland Police Force areas. There is no evidence of a reduction in the prevalence of problem drug use in any of Scotland’s former Police Force areas.
Results and Commentary
Presented here are the latest national and local estimates of the number of problem drug users (prevalent cases) in Scotland between April 2012 and March 2013. The overall national estimate for Scotland is presented alongside estimates for each Council Area, Alcohol and Drug Partnership, NHS Board and former Police Force area.
We have rounded the number of prevalent cases to the nearest hundred, or nearest ten for smaller geographical areas. We do not report figures to single cases which could give readers the impression of greater accuracy than is truly the case. .
Where prevalence is expressed as a percentage of the population, the denominator is taken from mid-year population estimates published by National Records for Scotland. Throughout the report comparisons are made between the estimates of prevalence for 2012/13 and those previously published by ISD for 2009/10. Comparisons are not made to prevalence estimates prior to 2006 as these were based on Scotland’s population aged 15 to 54 years old, rather than 15 to 64 years. As the estimates have a range within which the true number of problem drug users is expected to lie, significant increases or decreases are identified as being those where the confidence intervals for the years being compared do not overlap.
Estimated Number of Problem Drug Users across Scotland
This section reports on the estimated prevalence of problem drug use across Scotland. The information is described at Scotland level and has been further broken down by Council Area, Alcohol and Drug Partnership, NHS Board and former Police Force areas.
Scotland
§ Table A1.1 shows that the estimated number of individuals with problem drug use in Scotland during 2012/13, aged 15 to 64 years old, was 59,500 (95% CI = 57,500 - 61,600). The equivalent estimate for 2009/10, was 59,600 (95% CI = 58,300 - 61,000).
§ Table A1.2 shows the estimated number of individuals with problem drug use in Scotland during 2012/13, aged 15 to 64 years old, expressed as a percentage of the population was 1.68% (95% CI = 1.63% – 1.74%). This compares to an estimate of 1.71% (95% CI 1.67% - 1.75%) in 2009/10 and 1.62% (95% CI 1.59% - 1.67%) in 2006.
§ Taking into account confidence intervals, the evidence suggests that there has been no significant change in the number or rate of problem drug use since 2009/10.
§ Table A1.3 shows that 71% of individuals with problem drug use in Scotland during 2012/13 were male. This compares to 70% during 2009/10.
§ Table A1.3 and Figure A2.1 show that the estimated prevalence rate of problem drug use was 2.43% of all males and 0.96% of all females resident in Scotland during 2012/13. This compares to 2.49% of males and 1.00% of females during 2009/10.
7 Figure A2.1: Estimated prevalence rate of problem drug use by gender, ages 15 to 64 years old; 2012/13
The data relating to Figure A2.1 can be found here
Notes:
Confidence intervals not shown, but estimates will be subject to a margin of error.
§ Table A1.4 shows that 51% of males with problem drug use during 2012/13 were aged between 35 and 64 years. This compares to 43% during 2009/10. 34% of males with problem drug use during 2012/13 were aged 25 to 34 years and 16% were aged 15 to 24 years. It is not possible to provide a breakdown by age for females with problem drug use due to the smaller numbers involved.
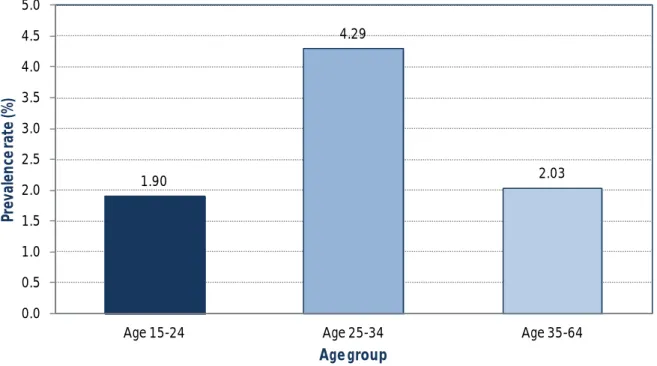
§ Table A1.4 and Figure A2.2 show that the rate of problem drug use amongst males in Scotland during 2012/13 was highest in the 25 to 34 years age-group (4.29%). This represents a slight decrease from the equivalent estimate for 2009/10 (4.99%). For those aged 25 to 34, the rates are also slightly lower than those previously published for 2009/10, however the rate has increased for those aged 35 to 64.
2.43
0.96
0.0 0.5 1.0 1.5 2.0 2.5 3.0
Male Female
Pr
ev
al
en
ce r
at
e
(%
)
Figure A2.2: Estimated prevalence rate of problem drug use by age group (males only), ages 15 to 64 years old; 2012/13
The data relating to Figure A2.2 can be found here
Notes:
This estimate does not have error bars attached to it, but is subject to error.
Council Areas
Table A1.1 shows the estimated number of individuals with problem drug use and the
corresponding prevalence rates for 2012/13 across all thirty two council areas in Scotland. • The council areas with the highest prevalence rates of problem drug use were
Inverclyde (3.20%, 95%CI = 2.85 - 3.59), Dundee City (2.80%, 95% CI = 2.52% - 3.13%), and Glasgow City (2.76%, 95% CI = 2.46% - 3.10%).
• The council areas with the lowest prevalence rates were Orkney (0.22%, 95% = 0.12% - 0.83%), East Dunbartonshire (0.58%, 95% = 0.44% - 0.79%), and Moray (0.59%, 95% CI = 0.44% - 0.86%)
§ When taking account of the margin of error (95% confidence intervals), prevalence rates of problem drug use have increased between 2009/10 and 2012/13 in two council
areas. Table A1.2 shows that in Falkirk, the rate has increased from 1.00% (95% CI = 0.91% - 1.11%) during 2009/10 to 1.63% (95% CI = 1.36% - 2.01%) during 2012/13. In Renfrewshire, the rate has increased from 1.86% (95% CI = 1.68% - 2.07%) during 2009/10 to 2.41% (95% CI = 2.15% - 2.73%) during 2012/13.
§ When taking account of the margin of error (95% confidence intervals), prevalence rates of problem drug use have decreased between 2009/10 and 2012/13 in three council areas. Table A1.2 shows that in Angus, the rate has fallen from 1.38% (95% CI = 1.24% - 1.55%) during 2009/10 to 0.96% (95% CI = 0.81% - 1.17%) during 2012/13. In East Ayrshire the rate has fallen from 3.11% (95% CI = 2.81% - 3.36%) during 2009/10 to
1.90 4.29 2.03 0.0 0.5 1.0 1.5 2.0 2.5 3.0 3.5 4.0 4.5 5.0
Age 15-24 Age 25-34 Age 35-64
Pr ev al en ce r at e (% ) Age group
9 1.94% (95% CI = 1.74% - 2.18%) during 2012/13. In Glasgow City the rate has fallen from 3.41% (95% CI = 3.28% - 3.57%) during 2009/10 to 2.76% (95% CI = 2.46% - 3.10%) during 2012/13.
§ Although males accounted for 71% of all individuals with problem drug use during 2012/13 in Scotland, Table A1.3 shows that this varied from 58% in Argyll and Bute to 82% in Shetland.
§ Table A1.4 shows that Glasgow City and Western Isles are the only council areas in Scotland where the highest prevalence rate of problem drug use for males is not within the age range of 25 to 34 years. In Glasgow, the prevalence rate for males aged 35 to 64 years was higher than for those aged 25 to 34 years (4.76% compared to 3.93%). In Western Isles, the prevalence rate for males aged 15 to 24 years was higher than those aged 25 to 34 year (2.64% compared to 1.81%).
§ Table A1.4 shows that the highest prevalence rates for males aged 15 to 24 years were observed in Inverclyde (4.09%), Clackmannanshire (3.45%) and Renfrewshire (2.75%). The highest prevalence rates for males aged 25 to 34 years were observed in
Midlothian (7.14%), Inverclyde (6.83%) and Shetland Islands (6.83%). The highest prevalence rates for males aged 35 to 64 years were observed in Glasgow City (4.76%), Inverclyde (3.82%) and Shetland Islands (3.15%).
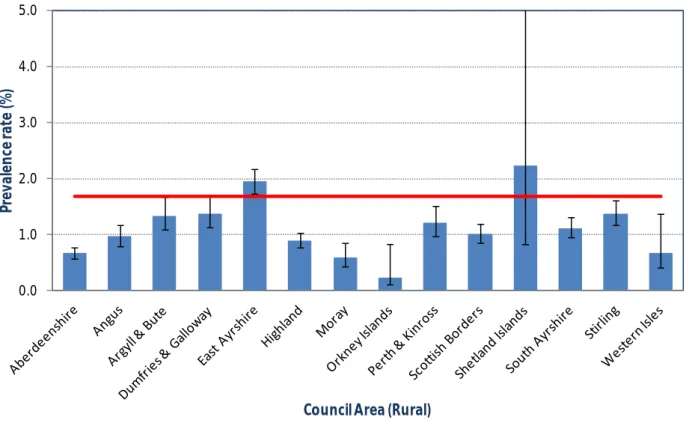
§ Figure A2.3 shows that prevalence rates of problem drug use were generally lower in rural Council areas. East Ayrshire, with an estimated prevalence rate of 1.94% (95% CI = 1.74% - 2.18%), is relatively high in comparison to other rural areas. Shetland Islands
also shows a relatively high prevalence rate of 2.22% (95% CI = 0.83% - 8.77%), but the very wide confidence interval indicates a greater degree of uncertainty in that estimate.
Figure A2.3: Estimated prevalence rate of problem drug use by Council Area (rural), ages 15 to 64 years old; 2012/13
The data relating to Figure A2.3 can be found here
Notes:
1. The error bars represent 95% confidence intervals.
2 The upper confidence interval limit for Shetland Islands is very high (8.77%) and has been truncated. This very wide confidence interval means that the prevalence estimate for Shetland is not as reliable as the estimates for the other council areas.
3. The red line represents Scotland overall.
• In contrast, Figure A2.4 shows that prevalence rates of problem drug use tends to be higher in non-rural areas. In particular, the council areas representing Scotland’s four major cities of Aberdeen (1.91%), Dundee (2.80%), Edinburgh (1.93%) and Glasgow (2.76%), all have prevalence rates of problem drug use higher than the Scottish cumulative rate.
• The prevalence rates of problem drug use in Inverclyde, North Ayrshire, Renfrewshire and West Dunbartonshire are also higher than the Scottish cumulative rate. These Council Areas serve some of the most deprived communities in Scotland according to the Scottish Index of Multiple Deprivation 2012.
0.0 1.0 2.0 3.0 4.0 5.0
Pr
ev
al
en
ce r
at
e
(%
)
11 Figure A2.4: Estimated prevalence rate of problem drug use by Council Area (non-rural), ages 15 to 64 years old; 2012/13
The data relating to Figure A2.4 can be found here
Notes:
1. The error bars represent 95% confidence intervals. 2. The red line represents Scotland overall.
0.0 1.0 2.0 3.0 4.0 5.0
Pr
ev
al
en
ce r
at
e
(%
)
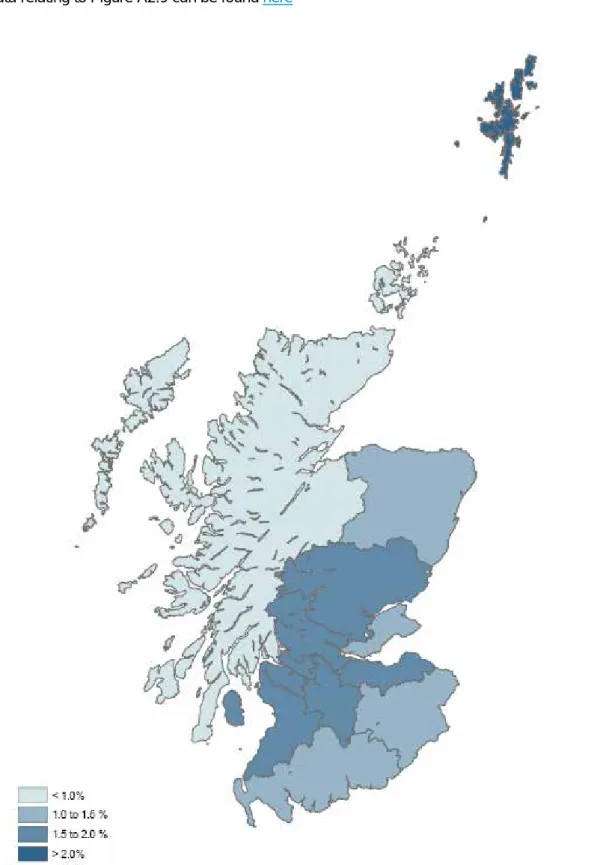
Figure A2.5: Estimated prevalence rate of problem drug use by Council Area, ages 15 to 64 years old; 2012/13
13
Alcohol and Drug Partnerships
Table A1.5 shows the estimated number of individuals with problem drug use and the corresponding prevalence rates for 2012/13 across all thirty Alcohol and Drug Partnership (ADP) areas in Scotland. Accountable to local Community Planning Partnerships, these are the focal point for local action on drug misuse.
Generally ADP’s are organised according to Council area boundaries and therefore the majority of results reported in this section are the same as those reported in the previous section on Council Areas. There are two exceptions; Midlothian and East Lothian council areas combine into a single ADP as do the council areas of North and South Lanarkshire.
§ Mid and East Lothian ADP had a prevalence rate of 1.50% (95% CI = 1.14% - 2.00%). The prevalence rate in 2009/10 was 1.20% (95% CI = 1.04% - 1.39%); there is
insufficient evidence to suggest an increasing trend. Table A1.1 shows that the
prevalence rates for the constituent council areas of East Lothian and Midlothian during 2012/13 was 1.35% and 1.68% respectively.
§ North and South Lanarkshire ADP had a prevalence rate of 1.59% (95% CI = 1.47% - 1.71%). The prevalence rate in 2009/10 was 1.46% (95% CI = 1.33% - 1.59%); there is insufficient evidence to suggest a decreasing trend. Table A1.1 shows that the
prevalence rates for the constituent council areas of North Lanarkshire and South Lanarkshire during 2012/13 was 1.64% and 1.52% respectively.
§ As with Council Areas, the ADP’s with the highest prevalence rates of problem drug use were Inverclyde (3.20%, 95%CI = 2.85% - 3.59%), Dundee City (2.80%, 95% CI = 2.52% - 3.13%), and Glasgow City (2.76%, 95% CI = 2.46% - 3.10%).
§ The ADP’s with the lowest prevalence rates were Orkney (0.22%, 95% = 0.12% - 0.83%), East Dunbartonshire (0.58%, 95% = 0.44% - 0.79%), and Moray (0.59%, 95% CI = 0.44% - 0.86%)
Figure A2.6: Estimated prevalence rate of problem drug use by Alcohol and Drug Partnership area, ages 15 to 64 years old; 2012/13
The data relating to Figure A2.6 can be found here
Notes:
1. The error bars represent 95% confidence intervals.
2 The upper confidence intervallimit for Shetland Islands is very high (8.77%) and has been truncated. This very wide confidence interval means that the prevalence estimate for Shetland is not as reliable as the estimates for the other Alcohol and Drug Partnerships.
3. The red line represents Scotland overall. 0.0
1.0 2.0 3.0 4.0 5.0
Pr
ev
al
en
ce r
at
e
(%
)
15 Figure A2.7: Estimated prevalence rate of problem drug use by Alcohol and Drug Partnership area, ages 15 to 64 years old; 2012/13
NHS Boards
Table A1.7 shows the estimated number of individuals with problem drug use and the corresponding prevalence rates for 2012/13 across all fourteen NHS Board areas in
Scotland. Regional NHS Boards are responsible for the protection and the improvement of their population’s health and for the delivery of frontline healthcare services.
• The NHS Board areas with the highest prevalence rates of problem drug use were Shetland (2.22%, 95% CI = 0.83% - 8.77%)2, Greater Glasgow & Clyde (1.92%, 95% CI = 1.78% - 2.08%), and Tayside (1.73%, 95% CI = 1.62% - 1.86%).
• The NHS Board areas with the lowest prevalence rates of problem drug use were Orkney (0.22%, 95% CI = 0.12% - 0.83%), Western Isles (0.67%, 95% CI = 0.42% - 1.38%), and Highland (1.00%, 95% CI = 0.89% - 1.13%).
§ When taking account of the margin of error (95% confidence intervals), prevalence rates of problem drug use have increased between 2009/10 and 2012/13 in two NHS Board areas. Table A1.8 shows that in Forth Valley, the rate has increased from 1.15% (95% CI = 1.07% - 1.25%) during 2009/10 to 1.59% (95% CI = 1.42% - 1.79%) during
2012/13. In Lothian, the rate has increased from 1.43% (95% CI = 1.34% - 1.53%) during 2009/10 to 1.70% (95% CI = 1.54% - 1.88%) during 2012/13.
§ When taking account of the margin of error (95% confidence intervals), prevalence rates of problem drug use have decreased between 2009/10 and 2012/13 in two NHS Board areas. Table A1.8 shows that in Ayrshire & Arran, the rate has fallen from 2.10% (95% CI = 2.00% - 2.22%) during 2009/10 to 1.73% (95% CI = 1.59% - 1.88%) during
2012/13. In Greater Glasgow & Clyde the rate has fallen from 2.59% (95% CI = 2.53% - 2.72%) during 2009/10 to 1.92% (95% CI = 1.78% - 2.08%) during 2012/13.
2
The very wide confidence interval for Shetland Islands means that the prevalence estimate here is not as reliable as the estimates for the other NHS health boards.
17 Figure A2.8: Estimated prevalence rate of problem drug use by NHS Board, ages 15 to 64 years old; 2012/13
The data relating to Figure A2.8 can be found here
Notes:
1. The error bars represent 95% confidence intervals.
2 The upper confidence interval limit for Shetland Islands is very high (8.77%) and has been truncated. This very wide confidence interval means that the prevalence estimate for Shetland is not as reliable as the estimates for the other health board areas.
3. The red line represents Scotland overall. 0.0
1.0 2.0 3.0 4.0
Pr
ev
al
en
ce r
at
e
(%
)
Figure A2.9: Estimated prevalence rate of problem drug use by NHS Board, ages 15 to 64 years old; 2012/13
19
Police Force Areas
Table A1.9 shows the estimated number of individuals with problem drug use and the corresponding prevalence rates for 2012/13 across all eight former Police Force areas in Scotland. The latest reporting period pre-dates the formation of Police Scotland which was formally established on 1 April 2013, taking over responsibility for policing across all of Scotland. Police Scotland’s purpose is to improve the safety and wellbeing of people, places and communities in Scotland.
§ The highest prevalence rate of problem drug use was in the former Strathclyde Police Force area with 2.04% (95%CI = 1.93% - 2.15%) while the lowest rate was in former Northern Constabulary area with a prevalence rate of 0.92% (95%CI = 0.77% - 1.31%)
§ When taking account of the margin of error (95% confidence intervals), prevalence rates of problem drug use have increased between 2009/10 and 2012/13 in two of Scotland’s former Police Force areas. Table A1.10 shows that in Lothian and Borders, the rate has increased from 1.36% (95% CI = 1.27% - 1.45%) during 2009/10 to 1.62% (95% CI = 1.55% - 1.86%) during 2012/13. In Central Scotland, the rate has increased from 1.15% (95% CI = 1.07% - 1.25%) during 2009/10 to 1.59% (95% CI = 1.42% - 1.79%) during 2012/13.
§ There is no evidence of a reduction in the prevalence of problem drug use in any of Scotland’s former Police Force areas.
Figure A2.10: Estimated prevalence rate of problem drug use by Police Force area, ages 15 to 64 years old; 2012/13
The data relating to Figure A2.10 can be found here
Notes:
1. The error bars represent 95% confidence intervals. 2. The red line represents Scotland overall.
0.0 1.0 2.0 3.0
Pr
ev
al
en
ce r
at
e
(%
)
21 Figure A2.11: Estimated prevalence rate of problem drug use by former Police Force area, ages 15 to 64 years old; 2012/13
A Closer Look at Shetland Islands
The estimate with the greatest degree of uncertainty, as reflected by 95% Confidence Intervals, related to Shetland Islands (2.22%, 95% CI = 0.83% – 8.77%). Also, the 2012/13 prevalence estimate seems rather high compared to the previous estimates and the current estimates for Highland and the other Island communities of northern Scotland.
According to the specified rules, a model for the total population that fits well is preferred over stratified models that also fit well. This was the case for Shetland. The estimate of the prevalence rate obtained by stratifying the known poulation, also had a wide interval, but seems to fit better within the context of previous estimates and estimates for ‘surrounding’ Council areas. However, to maintain a consistent approach across all areas, we are presenting the result as it stands in
compiance with our fixed criteria.
ISD advise users to interpret the result for Shetland, and all areas within the context of the degree of uncertainty reflected by the confidence intervals. Further information is contained in a technical
report which is available on request.
Individuals Known to Services for Problem Drug Use
Table A1.12 shows the number of known individuals with problem drug use identified in each of the data sources used to produce these estimates. A total of 23,255 known individuals (aged 15 to 64 years old) were identified in the data sources reviewed for this work. Individuals were identified from multiple records by matching initials, date of birth, gender and Council area of residence. It is possible therefore possible that there has been some under or over counting of individuals if these details were the same for different individuals or if an individual had records in more than one Council area. As in previous studies, the largest number of records came from the treatment data source (Scottish Drug Misuse Database and treatment records provided by services). However, there will be many more people getting help for their drug problem through information, advice or peer support from GPs, social workers or open access services.
To determine the unknown population of individuals with problem drug use, statistical models based on how many individuals are known to overlap multiple data sources are used. The table below describes how the overlaps in the known population for 2012/13 are distributed across the four source datasets.
Treatment data
Present Absent
Police data Police data
Present Absent Present Absent
SER data Present Hospital data Present 43 127 25 110
Absent 251 933 274 2153
Absent Hospital data Present 117 947 149 2645
23
Comparisons
Drug-related Deaths
Apart from the treatment data in the SDMD database published by ISD, there is information about drug-related deaths in Scotland published by the NRS. This section compares those NRS figures with the results found in the prevalence study.
Around 71% of individuals with problem drug use in Scotland in 2012/13 were male (42,300 males; and 17,200 females in table A1.3). Figures of drugs-related deaths in 2012 in
Scotland showed that 72% of the deceased were male.
Relatively high prevalence rates of problem drug use were seen in NHS Ayrshire & Arran 1.73% (95%CI = 1.59% - 1.88%), NHS Greater Glasgow & Clyde 1.92% (95%CI = 1.78% - 2.08%) and NHS Tayside (1.73% 95%CI = 1.62% - 1.86%)(Table A1.7)3. Figures of drugs-related deaths in 2012 in Scotland showed that NHS Greater Glasgow & Clyde, NHS Ayrshire & Arran and NHS Tayside have the highest figures compared to the other NHS Health boards.
The prevalence of problem drug use has not declined since 2006 (Table A1.11) and has not changed between 2009/10 and 2012/13. Figures of drug-related deaths show about the same trend. The year 2006 saw 12 drug related deaths per 100,000 (age 15-64) in
Scotland, while 2009 saw a higher number (16) and 2012 saw the same number (also 16). The main conclusion of our study is corroborated by the NRS figures.
Looking at the differences between 2012/13 and the previous estimates by age group there are apparent decreases in the estimated prevalence rate in both the 15 to 24 and 25 to 34 year old age groups (from 1.75% in 2006 to 1.63% in 2009/10 and 1.48% in 2012/13 for 15 to 24 year olds and from 3.90% in 2006 to 3.60% in 2009/10 and 3.06% in 20012/13 for 25 to 34 year olds. In contrast, for the 35 to 64 years old age group the estimated prevalence rate appears to have increased from 0.89% in 2006 to 1.18% in 2009/10 and 1.32% (A1.11). This pattern seems to be reflected in data sources such as Scottish Drug Misuse Database (SDMD), hospital discharges and drug related deaths which have seen increases in older age groups and decreases in younger age groups. Since 2006/07, an increasing proportion of individuals from older age groups have been assessed for specialist drug treatment each year. In 2006/07, half (51%) of individuals were aged 30 and over,
compared with two-thirds (66%) in 2012/13. Likewise, the percentage of individuals aged 40 and over increased from 15% in 2006/07 to 26% in 2012/13 (Scottish Drugs Misuse Database (SDMD) NHS Board Overview of Initial Assessments for Specialist Drug Treatment 2012/13, Publication date – 24 June 2014.
East Ayrshire 3.11% (95% CI = 2.81% - 3.36%) in 2009/10 and 1.94% (95%CI = 1.74% - 2.18%) in 2012/13 and Glasgow City 3.41% (95%CI = 3.28% - 3.57%) in 2009/10 and 2.76% (95%CI = 2.46% - 3.10%) in 2012/13 show an apparent decrease in the prevalence rate of problem drug use between 2009/10 and 2012/13. The decrease in Glasgow city is corroborated by the rate of drugs-related deaths which fell from 33 per 100,00 in 2009 to 29 per 100,00 in 2012 (a decrease of 13%) Other areas showing a fall in prevalence were not showing a clear decrease due to an overlap in confidence intervals. This means that in these areas we cannot conclude that prevalence has actually decreased (Table A1.2).
3
NHS Shetland Islands had the highest prevalence rate among the NHS boards (2.22%), but with a very wide confidence interval (95% CI = 0.83% - 8.77%), indicating unreliability of the estimate.
International
Public Health England annually publishes estimates of the prevalence of opiate use and/or crack cocaine use. The most recent figures are from 2011/12.
This data cannot be directly compared to Scotland due to differences in the definitions and source datasets (opiate and/or crack cocaine use in England versus opiate and/or
benzodiazepine use in Scotland). The statistical method of estimation is however the same capture-recapture technique adopted in this work for Scotland.
European estimates of problem drug use (high risk drug use) are published by The
European Monitoring Centre for Drugs and Drug Addiction (EMCDDA) – an agency of the European Union. Worldwide estimates of the use of opioids (this includes heroin, opium and non-medical use of opiates) are published in the World Drug Report 2014 by the United Nations Office on Drugs and Crime.
Future Work
When ISD previously published local prevalence estimates of problem drug use in Scotland for 2009/10, there was some debate regarding the most appropriate statistical methodology to apply. The project continues to favour the maximum likelihood-based capture-recapture approach via log linear modelling that has been utilised in the previous four sets of
calculations. Capture-recapture is one of the most generally accepted methods for prevalence estimation in drug use epidemiology (EMCDDA, 2000, Hook & Regal, 2000). However, in recent years the use of Bayesian statistical techniques has been advocated by certain experts as being more appropriate. Such a view is not universally shared – the maximum likelihood approach is still acknowledged by the UK’s prevalence lead at the Focal Point on Drugs and the European Monitoring Centre on Drugs and Drug Addiction (EMCDDA, 1999). The methods adopted for this latest report are the same as those used to ascertain estimates for Scotland in previous years. Fundamental to that approach is the selection, according to fixed criteria, of the best models. Although the Bayesian approach involves similar modelling techniques, the unknown population is determined by a weighted average of all models.
When statistical methods are changed from one approach to another, it is not clear whether any observed differences reflect true changes or are simply an artefact of the analytical methods. Therefore, prior to initiating the analytical phase for the production of estimates of problem drug use for 2012/13, ISD undertook to review the 2009/10 data and test the effect of a Bayesian approach against the more ‘traditional’ methods. Three Bayesian approaches were used to estimate local prevalence estimates:
1. Analysis of the known population in each of four strata (males 15-24, males 24-35, males 34-64 and females) in each council
2. Analysis with the strata as a covariate; a factor with four categories (males 15-24, males 24-35, males 34-64 and females) in each council.
3. Analysis of the total known population in each council
The results showed that Bayesian analysis of the stratified known population in each council (1) was close to the maximum likelihood estimates, but diverged in 13 of the 32
25 councils. The Bayesian analysis of the known population with the strata expressed as a covariate (2) and the Bayesian analysis of the total known population in each council (3) resulted in different estimates compared to the maximum likelihood estimates.
Where the Bayesian analyses produced estimates for all thirty-two Council areas, the cumulative estimate for Scotland in 2009/10 was significantly different to that published by ISD. The estimates for Glasgow City, the council with the highest number of known drug users, were very different across all three methods. We concluded therefore, that changing methods of estimating the prevalence of problem drug users from a maximum-likelihood approach to a Bayesian approach could result in different estimates of the prevalence, without reflecting true changes in prevalence. These findings were presented to the project
Advisory Group on 21 November 2013, who recommended the continuation of the non-Bayesian approach for 2012/13.
The Advisory Group, however, endorsed proposals to initiate a more detailed programme of methodological review in advance of any future publication. It is anticipated that the review will re-visit the Bayesian question, and further work will also investigate the potential to adopt alternative data sources. Estimates of injecting drug use across Scotland will be a priority deliverable on any future work.
Injecting Drug Users
Estimates of injecting drug use have not been produced for 2012/13. In 2011 ISD did produce injecting estimates for 2009/10, which were not published, using the traditional capture-recapture approach adopted for the main estimates of general problem drug use. There was significant opposition to the application of this approach for this particular cohort with the more complex Bayesian techniques being proffered as a better approach.
Researchers at St. Andrew’s University have since published injecting estimates for 2009/10, using the data supplied by ISD. Their estimates do not cover NHS Board areas and used Bayesian methods. (Ref: King R, Bird SM, Overstall1 A, Hay G, SJ Hutchinson. Injecting drug users in Scotland, 2006: Listing, number, demography, and opiate-related death-rates. Addiction Research and Theory, June 2013; 21(3): 235–246)
Alternative Data Sources
In future there may be scope to expand on the four data sources that are currently used to determine overlaps in the known population of problem drug users. In particular, data collection systems already exist for the central submission of needle exchange data and community prescribing. The needle exchange data centrally submitted to ISD is currently submitted in aggregate format and therefore does not have the detail needed for capture-recapture methods. The systems being put in place, however, have been designed to collect more detailed information at service-user level in future.
Individual-level information is currently available on 70% of prescriptions for the relevant drugs and this should increase over time. Given that individuals are likely to have several prescriptions over a year, it is likely that higher capture overall would be achieved at patient-level. It may be more appropriate to utilise prescribing data to augment treatment data, rather than using it as a separate data source.
Glossary
Benzodiazepine The most commonly prescribed minor tranquilisers, known as anxiolytics (for daytime anxiety relief) and hypnotics (to promote sleep). Includes diazepam (Valium), lorazepam, librium,
nitrazepam, temazepam.
Capture-recapture This form of analysis uses data sources which in some way identify individuals with problem drug use to identify the overlap between the data sources. Further analysis can then be used to estimate the hidden (unknown) population who appear in none of the data sources, which, combined with the known
population, generates a prevalence estimate.
Confidence interval Provides an estimated range of values within which the true value is likely to lie. The width of the confidence interval gives an indication of the reliability of the value (ie. the smaller the range the more reliable the value).
Error Bars Error bars are used on graphs to indicate the error, or
uncertainty in a reported measurement. They give a general idea of how accurate a measurement is, or conversely, how far from the reported value the true (error free) value might be. The error bars in the charts in this publication are based on the confidence intervals shown in the tables.
Hidden population The individuals with problem drug misuse who are not captured in any of the datasets used for the study.
Known population The individuals identified with problem drug use in the datasets used for the study.
Multiplier Method Produces estimates by applying the known to unknown ratio in a larger region to the known population in a smaller area. This is sometimes used where an area had too small a number of known users to produce estimates using capture-recapture.
Opiate A drug containing opium or its derivatives, used in medicine for inducing sleep and relieving pain. Includes heroin
(diamorphine), morphine, methadone, opium, codeine, pethidine, dihydrocodeine (DF118).
Prevalence In epidemiology, the prevalence of a health-related state (typically disease, but also other things like drug use) in a statistical population is defined as the total number of cases of the risk factor in the population at a given time. It is used as an estimate of how common a disease is within a population over a certain period of time. The prevalence rate is the number of individuals shown as a proportion of the overall population.
27 Problem drug use The problematic use of opiates (including illicit and prescribed
methadone use) and/or the illicit use of benzodiazepines and implies routine and prolonged use as opposed to recreational and occasional drug use.
Rural A council area has been classified as rural if its population density is below one person per hectare (Scottish Executive, 2000). A council area has been classified as non-rural if its population density is more than one person per hectare (Scottish Executive, 2000).
List of Tables
Table No. Name Time period File & size
A1
Drug_Prevalence_Tables_2012-13_FINAL.xlsx
1 April 2009 – 31 March 2010
(2009/10) 1 April 2012 – 31 March 2013
(2012/13)
Excel [58kb]
A1.1 Estimated number of individuals with
problem drug use by Council area (ages 15 to 64); 2012/13
2012/13
A1.2 Estimated percentage of individuals with problem drug use by Council area (ages 15 to 64); 2009/10 and 2012/13
2009/10 2012/13 A1.3 Estimated number of individuals with
problem drug use by Council area and gender (ages 15 to 64); 2012/13
2012/13
A1.4 Estimated number of individuals with problem drug use by Council area and age group (ages 15 to 64); 2012/13
2012/13
A1.5 Estimated number of individuals with problem drug use by Alcohol & Drug Partnership (ages 15 to 64); 2012/13
2012/13
A1.6 Estimated percentage of individuals with problem drug use by Alcohol & Drug Partnership (ages 15 to 64); 2009/10 and 2012/13
2009/10 2012/13
A1.7 Estimated number of individuals with problem drug use by NHS Health Board (ages 15 to 64); 2012/13
2012/13
A1.8 Estimated percentage of individuals with problem drug use by NHS Health Board (ages 15 to 64); 2009/10 and 2012/13
2009/10 2012/13 A1.9 Estimated number of individuals with
problem drug use by Police Force area (ages 15 to 64); 2012/13
2012/13
A1.10 Estimated percentage of individuals with problem drug use by Police Force area (ages 15 to 64); 2009/10 and 2012/13
2009/10 2012/13 A1.11 Estimated prevalence of problem drug use
by age group (ages 15 to 64); 2006 and 2012/13
2006 2009/10 2012/13 A1.12 Summary of data on problem drug use by
Council area (ages 15 to 64); 2012/13
29
List of Charts
Table No. Name Time period File & size
A2
Drug_Prevalence_Charts_2012-13_FINAL.xlsx
1 April 2009 – 31 March 2010
(2009/10) 1 April 2012 – 31 March 2013
(2012/13)
Excel [2,533kb]
A2.1 Estimated prevalence rate of problem drug use by gender, ages 15 to 64 years old; 2012/13
2012/13
A2.2 Estimated prevalence rate of problem drug use by age group (males only), ages 15 to 64 years old; 2012/13
2012/13
A2.3 Estimated prevalence rate of problem drug use by Council area (rural), ages 15 to 64 years old; 2012/13
2012/13
A2.4 Estimated prevalence rate of problem drug use by Council area (non-rural), ages 15 to 64 years old; 2012/13
2012/13
A2.5 Estimated prevalence rate of problem drug use by Council Area, ages 15 to 64 years old; 2012/13
2012/13
A2.6 Estimated prevalence rate of problem drug use by Alcohol and Drug Partnership area, ages 15 to 64 years old; 2012/13
2012/13
A2.7 Estimated prevalence rate of problem drug use by Alcohol and Drug Partnership area, ages 15 to 64 years old; 2012/13
2012/13
A2.8 Estimated prevalence rate of problem drug use by NHS Board, ages 15 to 64 years old; 2012/13
2012/13
A2.9 Estimated prevalence rate of problem drug use by NHS Board, ages 15 to 64 years old; 2012/13
2012/13
A2.10 Estimated prevalence rate of problem drug use by Police Force area, ages 15 to 64 years old; 2012/13
2012/13
A2.11 Estimated prevalence rate of problem drug use by Police Force area, ages 15 to 64 years old; 2012/13
Contact
Richard Dobbie
Project Lead
richard.dobbie@nhs.net
0131 275 7732
Jan Kerssens
Principal Information Analyst
j.kerssens@nhs.net
0131 275 6842
Further Information
31
Appendix
A1 – Background Information
Data Collection
The study collected information from several data sources on illicit use of opiate or benzodiazepines and additionally on prescribed use of methadone or other opiate substitutes.
Data was collected from:
• Scottish Drug Misuse Database (SDMD) and treatment agencies
• Hospital discharges (SMR01 and SMR04)
• Criminal Justice Social Work Reports (CJSWR)
• Police
The variables collected from each data source were:
• Forename initial
• Surname initial
• Gender
• Date of Birth
• Postcode district
• Drug of Misuse
Information on the known individuals with problem drug use is presented in Table A1.12.
Across all data sources data were aggregated by initials, date of birth, gender and Council area of residence in order to identify unique individuals. Data from multiple records were combined to ensure that information on drug use was not lost during this process.
Where possible, postcode district was used to identify Council area of residence. If postcode district was not available but information on the town the individual lived in was provided then this was used to allocate the individual to a Council area. If neither postcode district nor town of residence details were provided and the data could be identified as being provided by a single Council area then it was assumed that the individual was resident in that Council area. Where data sources covered an area larger than a Council (eg. Strathclyde Police Force) and both the postcode district and town were not available it was not possible to allocate the individual to a Council area therefore these cases were not able to be included in the final datasets.
If any of the identifying information was missing (eg. initials, date of birth, gender, Council area) these records were excluded from the final dataset.
Scottish Drug Misuse Database and treatment agencies
Information was extracted from the Scottish Drug Misuse Database (SDMD) on clients who had an initial assessment or follow-up assessment for drug treatment during 2012/13 and who were recorded as using opiates and/or benzodiazepines. In addition, treatment agencies were asked to provide information about clients in treatment during 2012/13. The SDMD and treatment agency data were combined to create a single source.
Information was extracted from general hospital (SMR01) and psychiatric hospital (SMR04) discharge records for any patients with a discharge relating to opioid use during 2012/13. This did not have to be the primary diagnosis but was included as long as it was recorded as a diagnosis in the discharge record. Opioid use was identified using the World Health Organisation’s International Classification of Diseases 10th Revision (ICD10) codes F11 (opioid use) and F19 (multiple
psychoactive drugs).
Criminal Justice Social Work Reports
Criminal Justice Social Work Reports (CJSWRs) are compiled by Social Work departments for use by courts in sentencing. The CJSWR will contain information on the individual’s background and personal circumstances, if considered relevant to the offence and sentencing. Drug use may or may not be noted in the report based on the Social Worker’s view. Additionally, where drug use is noted, this may not necessarily identify the specific drugs involved. CJSWRs from 2012/13 were reviewed by ISD data collectors who collected information where opiate and/or benzodiazepine drug use was recorded or where opiate substitute prescribing was recorded.
Police
Police Scotland provided information on individuals who had been detained under the Misuse of Drugs Act for opiate and/or benzodiazepine related offences (charged or cautioned), for each of the former force areas.
33
Methods
Capture-recapture is one of the most generally accepted methods for prevalence estimation in drug use epidemiology (EMCDDA, 2000, Hook & Regal, 2000). This form of analysis requires two or more data sources which in some way identify individuals with problem drug use (e.g. initials, date of birth and sex) and can identify the overlap between the data sources that is the number of people that occur in two or more data sources. Log linear analysis can then be used to estimate the hidden (unknown) population who appear in none of the data sources, which, combined with the known population, generates the prevalence estimates (Hickman et al. Online Report 36/04 2004).
Unit of analysis
The main unit of analysis in this research has been the Council area. In accordance with the
methods outlined in the previous Scottish prevalence study, it was necessary to undertake separate analyses of the available data for each Council area (Hay et al. 2009). Arriving at a national
estimate involved summing all of those local estimates. On the basis of these Council area
estimates, it has been possible to produce estimates for the differently configured Alcohol and Drug Partnership (ADP) areas, NHS Health Board areas and the former Police Force areas in Scotland. The Council areas are the building blocks of the other areas (All Health board boundaries were aligned with local authority areas in April 2014 to facilitate integration of health and social care).
Model selection
With four data sources, there are 113 possible log linear models and one of the challenges of the capture-recapture analysis is to find the simplest model that still fits the data. A very simple model is a model with main effects only, indicating that the presence in one data source does not affect the probability of being in another source. This is rather unlikely where one data source is Police arrests and another is Criminal Justice Social Work Reports (CJSWRs) because the latter are usually only made after a person has been arrested. This will lead to interaction terms in the model between this pair of data sources. A model that assumes two interaction terms is simpler than a model with three interaction terms. Usually, more complex models lead to higher prevalence estimates. This is
illustrated in prevalence estimates of the number of drug users in Glasgow with four data sources. A model with 2 interactions (between pairs of data sources) yielded an estimate of 8,055, while a model with 2 interactions (between pairs of data sources) and 1 interaction term between 3 data sources resulted in an estimate of 8,494 (Frischer 1997).
The first stage of model selection involved testing how well a very simple model, that assumed all data sources were independent of each other, matched the observed overlap in the data sources. Then other models, representing dependencies between single pairs of data sources, and two pairs of data sources were tested. In total this amounts to 22 models, which we will label “simple” models. The model that best matched the overlap was chosen using objective statistical criteria; more complex models were only chosen if they provided a better match (on comparing AIC values) than simpler models (Hook & Regal 1997).
The search into more complex models can go via several methods. Starting with a simple model and adding more and more interaction terms until the fit is acceptable (forward selection), or starting with the most complex model and eliminate interaction terms that do not result in a significant loss of fit (backward elimination). In this report we choose to fit all the possible models, starting from a model with main effects only up to and including models with two two-way effects- this gave 22 possible models. This approach makes it possible to calculate a (weighted) average estimate of the hidden populations of all the models and compare estimates of specific models with that average (see below).
1. The initial models used for evaluation were the 22 models including main effects and only 1 or 2 two-way interactions between pairs of data sources effects when evaluating log linear models of capture-recapture using four data sources for each of the 32 local authorities; 2. If the estimate of the total population was more than 5 times the known population (from all
4 data sources) the estimate was deemed to be unsatisfactory. These models were excluded from further analysis;
3. The weighted average of the (remaining of the) 22 models was calculated using the SIC (Schwarz Information Criterion) to give greater weight to better models;
4. Models were deemed to be a satisfactory fit if the AIC value was less than zero and the estimated population differed by less than 10% from the weighted estimate;
5. At first instance, an un-stratified model was fitted and if this was satisfactory the estimate was accepted;
6. If the model with the lowest AIC differed more than 10% from the weighted estimate, the model with the next lowest AIC (<0) which agreed with the weighted estimate was chosen; 7. In absence of a satisfactory un-stratified model was, separate models were fitted to male
and female strata.
8. For men - if no models fitted satisfactorily to the male stratum but a model for the female stratum fitted, separate models were fitted to female strata and age specific male strata (males 15-24, males 25-34, males 35-64);.
9. If all models with female strata and age specific male failed, age strata were fitted (age 15-24, age 25-34, age 35-64);
10. If still no satisfactory model was found, models with AIC (<5) were accepted;
11. If all of the above failed, more complex models where fitted in two steps (1) 64 models without three-way interactions and (2) models with three-way interactions.
35
A2 – Advisory Group Membership
Project Sponsor
Fiona Fraser (Scottish Government)
Delivery Team
Fiona Russell, Head of Service & Chair (ISD Scotland) Richard Dobbie, Project Lead (ISD Scotland)
Laura Wood, Project Manager (ISD Scotland)
Jan Kerssens, Principal Information Analyst (ISD Scotland)
Problem Drug Use Experts
Dr Gordon Hay (Liverpool John Moores University) Professor Matthew Hickman (University of Bristol)
Dr. Sharon Hutchinson (Health Protection Scotland and Strathclyde University)
Alcohol and Drug Partnerships
David Williams (Edinburgh Alcohol and Drug Partnership)
Public Health
Andrew McAuley (Health Scotland) Josie Smith (Public Health Wales)
Social Work
Rosemary White (Renfrewshire Council)
Police
A3 – Publication Metadata (including revisions details)
Metadata Indicator Description
Publication title Estimating the National and Local
Prevalence of Problem Drug Use in Scotland 2012/13
Description The report contains estimates of the
prevalence of problem drug use (opiates and benzodiazepines) in 2012/13 for council, Alcohol and Drug Partnership (ADP), health board (HB), and former Police Force areas in Scotland.
Theme Health and Social Care
Topic
Format PDF report with Excel tables
Data source(s) Scottish Drug Misuse Database, SMR01
and SMR04, Social Enquiry Reports, Police data
Date that data is acquired October 2013 to April 2014
Release date 28th October 2014
Frequency As commissioned
Timeframe of data and timeliness The timeframe for this publication is April 2012 to March 2013.
Continuity of data Data and methods are considered
comparable with the previous report produced by ISD for 2009/10 and the University of Glasgow for 2006.
Revisions Statement Revisions are not planned for this data. Revisions relevant to this publication None.
Concepts and definitions See main report
Relevance and key uses of the statistics Relevant to understanding extent of problem drug use in Scotland. Statistics will be used for policy making and service planning.
Accuracy Produced in consultation with an
independent Advisory Group.
Technical Report has been peer reviewed.
Completeness Data collected from all areas of Scotland in
line with previous studies.
Comparability Data is considered comparable with
previous studies produced by University of Glasgow. Data is not directly comparable outwith Scotland.
Accessibility It is the policy of ISD Scotland to make its web sites and products accessible according to published guidelines. See attached link for further details:
http://www.isdscotland.org/About-ISD/Accessibility/
Coherence and clarity The report is available as a PDF file with tables clearly linked for ease of use.
37 Value type and unit of measure Estimated number and percentage of
individuals with problem drug use
Disclosure There is considered to be a low risk of
disclosure. Official Statistics designation Official Statistics
Official Statistics Not yet undergoing assessment
Last published November 2011
Next published To be confirmed.
Date of first publication September 2001
Help email richard.dobbie@nhs.net
A4 – Early Access details (including Pre-Release Access)
Pre-Release Access
Under terms of the "Pre-Release Access to Official Statistics (Scotland) Order 2008", ISD are obliged to publish information on those receiving Pre-Release Access ("Pre-Release Access" refers to statistics in their final form prior to publication). The standard maximum Pre-Release Access is five working days. Shown below are details of those receiving standard Pre-Release Access and, separately, those receiving extended Pre-Release Access.
Standard Pre-Release Access:
Scottish Government Justice Department NHS Board Chief Executives
NHS Board Communication leads
Alcohol and Drug Partnerships (varied access up to maximum of 5 days)
Extended Pre-Release Access
Extended Pre-Release Access of 8 working days is given to a small number of named individuals in the Scottish Government Health Department (Analytical Services Division). This Pre-Release Access is for the sole purpose of enabling that department to gain an understanding of the statistics prior to briefing others in Scottish Government (during the period of standard Pre-Release Access).
Scottish Government Justice Department (Analytical Services Division)
These statistics will also have been made available to those who needed access to help quality assure the publication:
Scottish Government Justice Department Advisory Group Members
Peer Reviewers from: • Scottish Government • University of Stirling • University of Glasgow
• Glasgow Centre for Population Health • NHS Health Scotland