Foreword
CIMA identifies strongly with the challenges faced by management teams and finance professionals in today’s fast moving environment, and has a strong focus on supporting its members and other professional accountants in the effective delivery of health care.
CIMA’s NHS group identified the issues associated with in-year financial forecasting as key to effective financial management of NHS organisations. To address this, a survey of current forecasting practice in the NHS was undertaken to gain more understanding. Members of CIMA’s NHS group considered and analysed the forecasting information generated by the survey responses and devised recommendations (section 5) to encourage good practice in financial forecasting.
This document is for general guidance and is intended to be adapted to the individual circumstances of an organisation for consideration by finance professionals in the NHS. It builds on a previous report Raising the Standard of Performance Reporting in the NHS, published jointly with the HFMA.
Please note that CIMA and members of CIMA’s NHS group do not accept any responsibility or liability to any individual or organisation that relies on the recommendations set out in this document.
Further copies of the report are available from CIMA’s website:www.cimaglobal.com/NHSforecasting Steven Bliss
Acknowledgements
The report was compiled by CIMA’s NHS group.
Members of CIMA’s NHS group are as follows:
Steven Bliss(Chair) NHS South Central
Simon Wombwell(Deputy Chair) Oxford Radcliffe Hospitals NHS Trust
Kieran Lappin Bexley Care Trust
Joseph McElligott University College London Hospitals NHS Trust Anne Marie Millar Department of Health
Loretta Outhwaite Jersey Health and Social Services Mat Rawsthorne Association of Greater Manchester PCT Adrian Snarr North Yorkshire and York PCT
Executive summary
Why forecasting?
Forecasting (predicting, estimating or calculating something future) is an integral component of the management control cycle. Although numerous bodies have noted the problems associated with inaccurate forecasting in the NHS (see section 2a), guidance on how to produce accurate forecasts has been lacking.
Objective
It is difficult to produce a standard guide for how forecasts should be prepared. NHS organisations, and
management structures and styles, are simply too diverse. The objective of the report is to help the NHS finance function to improve the accuracy of forecasting. It is aimed primarily at finance directors and their staff, but should also be of value to general management and non-executives.
Good practice
As is touched upon in the first section of this report, good forecasting requires honesty from all concerned.
If your local Strategic Health Authority (SHA) only wants to see breakeven in the forecast, it removes any
incentive to forecast accurately. Who would forecast a deficit if they risk being fired or a surplus if they risk having it removed and given to a failing organisation? It is much easier to forecast breakeven until late in the year, but this is simply not good practice.
As, we hope, the NHS moves away from the deficits of recent years, it needs to change its culture to permit more honesty in forecasting.
Contents
Why is forecasting so important?. . . 6
Existing guidance for forecasting in the NHS. . . 8
Practice and theory beyond the NHS. . . 10
Survey of current forecasting practice in the NHS. . . 12
Survey findings. . . 13
4.1 What do you forecast, and when? . . . 13
4.2 How do you forecast income and expenditure? . . . 14
4.3 Style of reporting . . . 15
4.4 How do you reconcile plan and forecast? . . . 15
4.5 Risks and opportunities . . . 16
4.6 Do you report the same forecasts to your board as to your SHA or Monitor? . . . 17
4.7 At what level do you forecast?. . . 18
4.8 How do you treat any general reserve? . . . 19
4.9 How do you show non-recurrent items? . . . 20
4.10 Are income assumptions consistent between providers and commissioners?. . . 21
4.11 Do you flex budgets in-year? . . . 22
4.12 Accuracy of forecasting . . . 23
4.13 Future approaches to forecasting in the NHS . . . 24
1
2a
2b
3
4
Recommendations. . . 25
5.1 What to cover . . . 25
5.2 Who to involve in producing the forecast . . . 25
5.3 How to profile the forecast . . . 25
5.4 Reconcile the forecast to the plan and to previous forecasts . . . 25
5.5 Reconcile the forecast to actual results to date . . . 26
5.6 Check your income assumptions . . . 26
5.7 How to handle risks in your forecast. . . 26
5.8 Distinguish between recurrent and non-recurrent issues. . . 26
5.9 How to handle reserves . . . 26
5.10 A framework to ensure good practice – learning from the private sector . . . 26
References. . . 28
Further reading and information. . . 29
Appendix 1 NHS Forecasting Survey. . . 30
1 Why is forecasting so important?
When the Health Service Journal(2006) titles its main editorial‘Hopes for surplus pinned on turnaround in forecasting’, it shows how important the accurate forecasting of NHS finances has become. That editorial was written because the NHS now publishes, quarterly, every organisation’s forecast results (although
interestingly the NHS does not publish the actual results to date). It is not hard to see why improvements in forecasting are so important.
•
There was very high-level political commitment to getting the NHS back into financial balance during 2006/7.•
In 2005/6 the final results at individual organisations sometimes varied widely from forecasts, and the overall NHS result was worse than forecast.•
Greater transparency in reporting, and a ban on brokerage for failing organisations, means that financial failure is now more obvious.•
Past deficits have led to shortages of cash – if organisations cannot forecast accurately now, they may suddenly find that they can’t pay their bills.At this stage, however, we should open up some wider implications. Inaccurate forecasting is not necessarily incompetent. It may be tactical. For instance:
Self-preservation
Chief executives and finance directors who suddenly publish a bad financial forecast may lose their jobs. Understandably, they may delay bad news for as long as possible, ignoring the worsening overspends to date and hoping for miracles. At the very least that keeps them in their jobs for a few months longer. They may also find that, when they eventually publish a bad forecast, several other organisations do the same, giving safety in numbers. It is worth adding that one way to spot an optimistic forecast is to compare it to the actual results to date; this is why it would be useful if the NHS did publish in-year actual results at national level.
Keeping a sense of urgency
Conversely, it can make good sense to err on the side of pessimism. If you want everyone in your
organisation to drive through the savings needed, it is tactically better to present the position as worse than it is, so that no one relaxes. This tendency largely explains why, in the past (although not in 2005/6), NHS results tended to show a sudden improvement near year end.
Politics
Finally, NHS organisations have to manage what the historian Eric Hobsbawm calls the ‘democratic predicament’ of the late 20th century and after:
‘The democratic predicament was more acute now, both because public opinion, monitored by polls, magnified by the omnipresent media, was now constantly inescapable, and because public authorities had to take far more decisions to which public opinion was no sort of guide’.
If all your forecasts are made public, you may tend to smooth issues out and delay the public discussion of difficult problems until it is clear that they are almost insoluble.
The NHS is not alone, of course, in having to consider tactics, commercial organisations also aim to give the right impression to their investors. It would be naïve to think that finance staff can simply produce the most accurate forecast possible and everyone will then use it. However, the inability to publish accurate forecasts, for whatever reason, is a continuing problem; recently Dr Christine Daws told finance directors in Wales that:
‘I still sense there are games played around forecasting. The Finance function needs to address this. We need a level of honesty and transparency between us and between you and your boards about what the true position is.’ (Quoted in Healthcare Finance, November 2006, page 4)
Whatever tactics organisations adopt about what they publish, any organisation which cannot even produce an accurate forecast for internal use will soon hit problems. This report is about how to produce more accurate forecasts.
2a Existing guidance for forecasting in the NHS
Reports by the Audit Commission and other bodies include recommendations on what NHS boards should see in forecasts, and many criticisms of actual practice in the NHS. Some key messages from these reports are as follows (often the same key messages appear in more than one report):
Raising the Standard of Performance Reporting in the NHS
(CIMA and HFMA, 2004)
•
‘Trend analysis should be included (in board performance reports) and full year forecasts should be updated based on judgement and not just extrapolation.’•
‘The report should give an account of the emerging issues, the risks or opportunities presented and any actions that need to be considered as aconsequence.’
Financial Management in the NHS: NHS (England) summarised accounts 2003-04
(Audit Commission, June 2005)
•
‘The annual pattern both for individual bodies and the NHS as a whole is for a significant overspend to be forecast in the autumn and early new year but for break even to be achieved at the year end. The fact that NHS bodies are not always able to accurately forecast their financial position during the course of the year makes it difficult for them to take timely and appropriate action to achieve financial balance.’•
‘The Department (of Health) states that the pessimistic forecast of out turn is caused by NHS organisations factoring the full effect of risks into their forecasts, rather than the most likely effect of risks after mitigating action has been taken.’•
‘The appointed auditors reported that eight Strategic Health Authorities, 49 Primary Care Trusts, and 25 NHS Trusts did not report a realistic year-end position to the board when only two months from the year-end. Furthermore auditors reported that one Strategic Health Authority, 29 Primary Care Trusts and 18 NHS Trusts incurred ‘unexpected’ deficits at the year end.’The Intelligent Board (Dr Foster, February 2006)
•
‘Most NHS financial projections are poor and trusts should work to improve expertise in this area. The key issue is to be able to anticipate income and expenditure both at the end of the current year and for future years – and to avoid the common practice of recasting the budget at regular intervals throughout the year. This group stronglyrecommends that only one formal mid-year budget re-forecast exercise should be undertaken.’
•
‘Trusts need to monitor and evaluate policy, technology and other changes in the external environment, and provide the board with periodic assessments of their potential strategic risks and opportunities.’•
‘Reports (of income and expenditure) should also include a financial risk analysis.’The Role of the Finance Director in a Patient Led NHS (National NHS Finance Development Board, June 2006)
•
NHS organisations need to ‘improve financialforecasting, including budget setting and control’ and ‘be explicit around the use of non-recurring support.’
•
‘The finance director must continue to challenge assertions and assumptions... On the other hand, early reporting of the worst case scenario without a clear and transparent risk assessment may lead to inappropriate decisions.’Learning the Lessons from Financial Failure (Audit Commission, June 2006)
•
‘Strategic Health Authorities should routinely compare the income assumptions of NHS providers within their boundaries with the spendingassumptions of NHS commissioners.’
•
‘The robust style of management, favoured by some SHAs, may have encouraged some NHS bodies to conceal the reality of their financial problems until it is too late to avoid failure.’•
‘Because of the culture of year-end financial fixes... there can be an expectation of significant month 13 variances, and a consequent reluctance to treat in-year out turn forecasts as reliable.’•
‘Good financial forecasting requires the disciplines of year-end reporting to be replicated throughout the year. In particular, there is no reason why the production, and interpretation, of balance sheets and cash flow schedules should not form part of routine financial reporting at NHS Trust and PCT board level.’•
‘Although a failing organisation is typically aware in general terms that it is heading into financial difficulty... the specifics of failure are often not presented until they are undeniable and hence until it is too late to correct the trend.’Audit Commission review of the NHS financial management and accounting regime (Audit Commission, July 2006)
•
‘The NHS has been very adept at moving money between organisations in order to hide or fix financial problems through a system of brokerage... The Department has increasingly adopted a policy of greater transparency... but such greater transparency has not yet been matched by a clear failure regime.’•
‘There can be some disincentives to accurate reporting if it is clear that extra effort will be required in order to achieve collective financial balance... There is a tendency... to forecast small deficits in the clear knowledge and expectation that they will in fact break-even.’Auditors’ Local Evaluation 2005/06 (Audit Commission, October 2006)
•
‘Over a quarter of NHS bodies were judged as having inadequate arrangements in place for their medium-term financial strategy, budgets and capital programme and ensuring that they are soundly based...’Summarising all of the above, the key messages seem to be:
1 NHS financial forecasting is not generally good enough, although it may have improved in recent years.
2 The general tendency is to be over-pessimistic until close to year-end, although a few organisations with big problems do the opposite.
3 The NHS financial regime, and the way that SHAs and DH manage the NHS, don’t always encourage accurate forecasting.
4 The assumptions behind financial forecasts need to be made clearer, and they need to be challenged. 5 Forecasts should evaluate risks, to show possible
outcomes, but the overall forecast should take a realistic view of risks and of what can be done to manage them.
6 Balance sheets and cash are not given enough importance in forecasts.
2b Practice and theory beyond the NHS
‘I would not say that the future is necessarily less predictable than the past. I think the past was not predictable when it started.’
Donald Rumsfeld
ex-US Secretary of Defence
Forecasting is, quite simply, a prediction of the future. At the time a forecast is published it is, at best, an attempt to communicate what the future will look like. In practice, forecasts are used to influence, to set expectations, to support the wider planning process and so on. It is therefore important to remember that, whatever the confidence of the forecaster, however sophisticated the method, it is one opinion of what the future will look like and should be assessed with caution, particularly when forecasting into the distant future.
From a finance or business perspective a forecast allows us (and the recipients of the information) to assess whether our plans or ambitions are being delivered or deliverable; if this proves not to be the case, and we are satisfied the forecast is robust, corrective action is required.
But as Donald Rumsfeld also explained (US Defence Department Briefing, 12 February 2002):
‘... there are known knowns; there are things we know we know. We also know there are known unknowns; that is to say we know there are some things we do not know. But there are also unknown unknowns – the ones we don’t know we don’t know’.
In other words:
•
data is susceptible to being inaccurate and incomplete•
the past is not always a guide to the future•
qualitative data is often influenced by recent experience and peer pressure•
it is difficult to incorporate external factors e.g. Government policy, media-generated hysteria.But, despite the risks around accuracy, forecasting is essential. And for those individuals apparently able to predict the future – think of Warren Buffett and George Soros – the rewards are great.
Benefits:
•
supports the decision making process•
informs planning and resource allocation decisions•
if data is of high quality – can be accurate.Forecasting techniques fall into two basic types:
•
qualitative•
quantitative.Qualitative
The qualitative forecast is based on judgements, subjectivity and opinion. Essentially it is an ‘expert’ opinion – from an individual or individuals (panel) who have amassed a large amount of experience and judgement – which is then applied to predict the future. A prudent forecast would probably involve more than one view followed by a discussion to achieve consensus.
In circumstances where choice or opinion is involved, the experts could be replaced by a consumer or focus group. This group is asked for their view of the future, their preferences or opinion on various scenarios.
In these instances, the organisation must collate the views and data to form its own view of the future.
Quantitative
The quantitative approach is predominantly data based, often using statistical data to identify relationships and trends followed by extrapolation. However, the data will be influenced in some way by the experts preparing the forecast e.g. the mere choice of a particular dataset implies influence.
Examples:
•
quantitative analogies: using proxy data to predict, say, the demand in a new area or service•
expert systems: the use of experts to identify ‘rules’ to extrapolate historic data•
extrapolation models: extrapolation of historic data (where historic data is believed to be a good guide to the future) e.g. exponential smoothing, moving averages, linear regression•
causal or econometric models: in instances where past data is not a good predictor of the future, complex models involving research and regression analysis are developed to simulate future events in order to forecast an outcome.The techniques described above have limited relevance for basic in-year financial forecasting e.g. income and expenditure and cash flow forecasting. In practice, often due to cost and rapidly changing circumstances, the financial projections follow a qualitative path i.e. experts (probably finance staff with service managers) will review historic performance, consider the current position adjusting for non-recurrent actions, and predict how people and situations will behave in the future.
This is not without risk but, as the financial year progresses, the mitigating factors are that we are short-term forecasting and external factors are limited. Forecasters clearly have access to data and advice, but their predictions are not aided by formal forecasting methods – the process is therefore fast and
inexpensive when only a few forecasts are needed, and is safe where only small, predictable changes are expected. The process can also benefit from feedback about accuracy, where the date on which predictions are generated is noted, prior to subsequent analysis.
However, when forecasting into the medium to long term, more sophisticated qualitative and quantitative techniques will have a role. For example: to inform future patient flows (and income levels for a Trust) statistical models will be used to assess population growth, changes in the characteristics of populations; expert opinion will be required to understand future treatments and technologies, the skills required of a future workforce and so on.
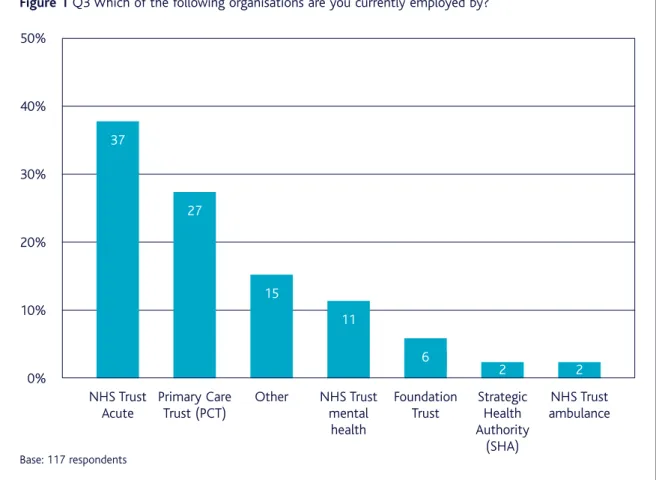
Figure 1Q3 Which of the following organisations are you currently employed by?
3 Survey of current forecasting practice in the NHS
Methodology
The survey was designed by CIMA’s NHS group and CIMA’s in-house team. It was carried out using an online questionnaire, with a link from an article in Healthcare Financein an attempt to encourage non-CIMA students and members to participate in the research. The survey was left open for four weeks in September 2006.
Response rate
In total 121 completed questionnaires were achieved (from 618 emails), equating to a 20% response rate. Four of these responses were excluded, as the respondents worked outside of the NHS. The following analysis is based on the 117 valid responses, all of which came from CIMA members or students. As expected, the majority of responses were from Acute Trusts (37%) and PCTs (27%).
The detail of responses is shown below.
50%
40%
30%
20%
10%
0%
NHS Trust Acute
Primary Care Trust (PCT)
Other NHS Trust mental
health
Foundation Trust
Strategic Health Authority
(SHA)
NHS Trust ambulance
Base: 117 respondents
37
27
15
11
6
4 Survey findings
4.1 What do you forecast, and when?
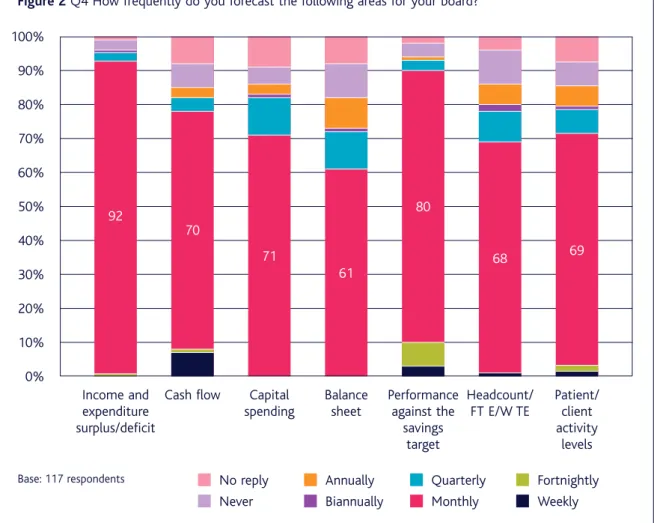
Figure 2 shows what items are forecast for boards, and how often. The key messages are as follows:
•
Almost everyone (92%) forecasts income and expenditure monthly. This is hardly surprising, as most of them have to provide forecasts to the Department of Health nearly every month.•
Similarly the vast majority forecast savings at leastmonthly, and often fortnightly. The many who forecast fortnightly are likely to be in formal turnaround, which requires fortnightly reporting.
•
Most people (over 70%) forecast cash flow at least monthly. But fewer (61%) report a forecast balance sheet at the same time. Both are good practice, although balance sheets are perhaps less significant for PCTs than they are for NHS Trusts.•
At least two thirds of respondents also forecast capital expenditure, staff headcount, and some key patient activity measures each month. However, about 10% never provide a forecast of staff numbers. That seems surprising, as savings plans are usually linked to changes in staffing.Figure 2Q4 How frequently do you forecast the following areas for your board? 100% 90% 80% 70% 60% 50% 40% 30% 20% 10% 0% Income and expenditure surplus/deficit
Cash flow Capital spending Balance sheet Performance against the savings target Headcount/ FT E/W TE
Patient/ client activity
levels
Base: 117 respondents
92 70 71 61 80 68 69 No reply Never Annually Biannually Quarterly Monthly Fortnightly Weekly
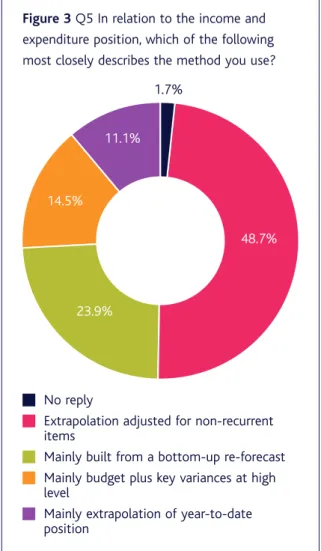
4.2 How do you forecast income and expenditure? Earlier in this paper we have described various
approaches to forecasting income and expenditure. The most common approach, as shown in Figure 3, is to base it mainly on an extrapolation of actual results, adjusted for non-recurrent items. About a quarter of organisations collected bottom-up forecasts.
Almost three-quarters (71%) of respondents take account of seasonality when forecasting, although it was hard to establish quite how they do this via a simple questionnaire. Historical trends was the main answer given (by 30% of respondents). A few respondents mentioned winter planning (6%) and energy costs (6%).
Some of the other comments included:
‘Use extrapolation in the main but made more sophisticated by using activity as the cost driver and using the latest planned activity levels to drive costs. Seems to work quite well.’
‘For expenditure which does not occur equally in all accounting periods we remove the expenditure to date before extrapolating, and then add back the full year’s estimated expenditure on such items.’
‘Workloads in some operational areas are seasonal with high peaks, resulting in need for additional temporary staff. In non-pay areas such as utilities, spend is seasonal. Plus other areas, such as national
communication exercises, have large seasonal costs.’
11.1% 1.7%
23.9% 14.5%
48.7% Figure 3Q5 In relation to the income and expenditure position, which of the following most closely describes the method you use?
No reply
Extrapolation adjusted for non-recurrent items
Mainly built from a bottom-up re-forecast Mainly budget plus key variances at high level
Mainly extrapolation of year-to-date position
4.3 Style of reporting
As shown in Figure 4, by far the most common approach (69% of respondents) was a narrative report supported by table(s). There seems to be surprisingly little use of charts.
4.4 How do you reconcile plan and forecast? 84% of respondents provide a reconciliation between the plan and the current forecast. 71% provide a reconciliation between the current and previous forecast. Both are good practice.
4.8% 2% 1% 0.8% 7.4% 15% 69% Figure 4Q8 What style is used to report the income and expenditure forecast in the board report?
Figure 5Q9 Do you provide a reconciliation between the plan and the current forecast? Q10 Do you provide a reconciliation between the current and previous forecast?
No reply Narrative only
Narrative supported by table(s) Narrative supported by chart(s) Other (please describe)
Single figure in a table summarising financial performance
Un-attributed rounding differences
100% 90% 80% 70% 60% 50% 40% 30% 20% 10% 0%
Do you provide a reconciliation between the plan
and the current forecast?
Do you provide a reconciliation between the current
and previous forecast?
Base: 117 respondents
84
71 15
1 1
28
4.5 Risks and opportunities
The vast majority (90%) of respondents include a description of the risks and opportunities in their forecast. Again this is good practice, as mentioned in section 2a (page 8).
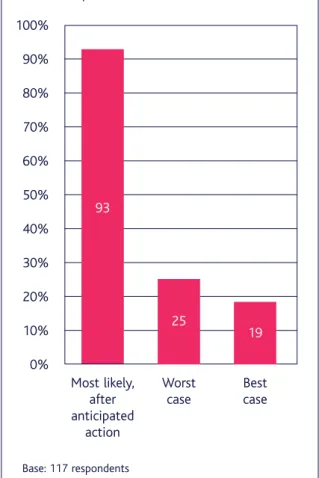
The forecast that most respondents (93%) report to the board is ‘the most likely after anticipated management action’. Some report other scenarios as well, although 74% of respondents said that they reported just one scenario (the most likely).
Figure 6Q12 Which phrase best describes the forecast reported to the board?
100%
90%
80%
70%
60%
50%
40%
30%
20%
10%
0%
Most likely, after anticipated
action
Worst case
Best case
Base: 117 respondents
93
25
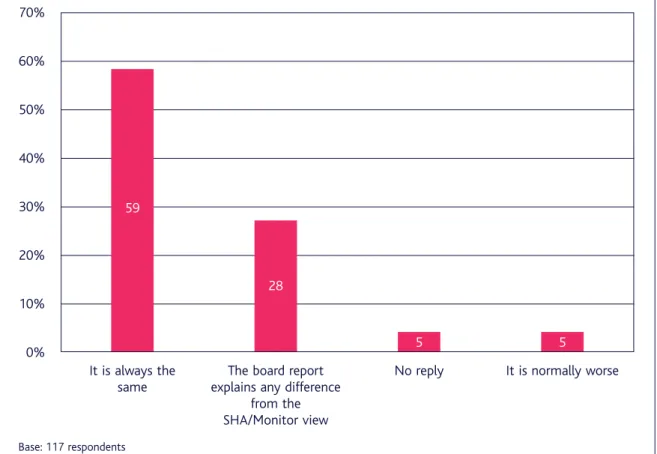
4.6 Do you report the same forecasts to your board as to your SHA or Monitor?
59% of respondents always quote the same figures to their board as to their SHA or Monitor. The worrying thing is that so many do not, although most then explain the differences. Good practice suggests having only one forecast, used consistently; but some of the comments earlier in this report, on managing the internal politics of the NHS, may explain why good practice sometimes seems too risky.
Figure 7Q13 How does the forecast income and expenditure position reported to your board compare to the position reported in the regular returns sent to the SHA or Monitor?
70%
60%
50%
40%
30%
20%
10%
0%
It is always the same
The board report explains any difference
from the SHA/Monitor view
No reply It is normally worse
Base: 117 respondents
59
28
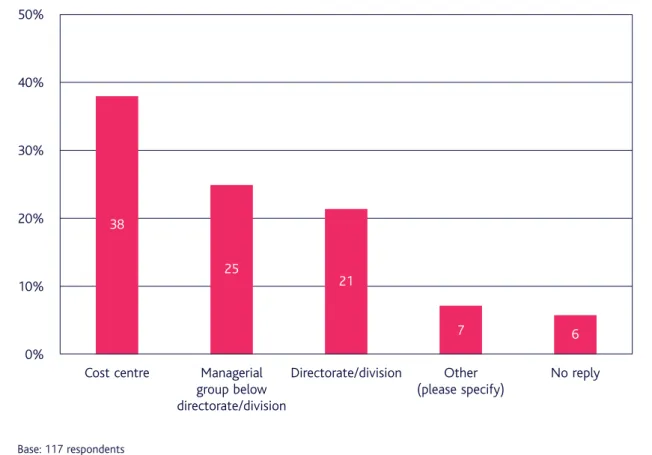
4.7 At what level do you forecast?
This varied widely; perhaps not surprising when responses came from a variety of organisations. 38% forecast at cost centre level, 25% to the managerial group below directorate/division, and 21% to the directorate/division. Just 4% of respondents stated that they normally re-forecast at total Trust level. One respondent forecast at specialty level. This may become more common, as Monitor wants Trusts to ‘improve their reporting of the earnings and profit margins of each service they provide’(Health Service Journal, 7 December 2006).
Figure 8Q14 What is the lowest level in the organisational hierarchy at which you normally re-forecast? 50%
40%
30%
20%
10%
0%
Cost centre Managerial group below directorate/division
Directorate/division Other (please specify)
No reply
Base: 117 respondents
38
25
21
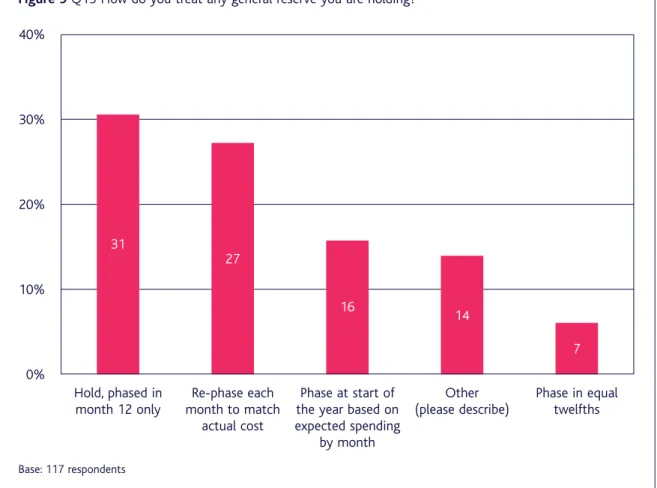
4.8 How do you treat any general reserve? The way reserves are treated does not affect the overall forecast, but it does affect how you report actual against plan and how you report management units within the overall forecast. There was no clear consensus amongst respondents on how they treat any general reserve they hold:
•
31% phase it in month 12 only•
27% re-phase each month to match actual cost•
16% phase the general reserve at the start of theyear based on expected spending by month
•
7% phase the general reserve they hold in equaltwelfths
•
a few respondents had other approaches.Behind this lies a deeper issue. Are reserves part of the arcane magic of the finance department, to be
manipulated to get the right final result? Or should the process be methodical and transparent? Views differ. What we can say for certain, however, is that the costs do not actually all hit in month 12: the fact that almost a third of respondents hold all the budget in month 12 is one reason why NHS financial results tend to run worse than plan during the year and improve against plan at year end.
Figure 9Q15 How do you treat any general reserve you are holding? 40%
30%
20%
10%
0%
Hold, phased in month 12 only
Re-phase each month to match
actual cost
Phase at start of the year based on expected spending
by month
Other (please describe)
Phase in equal twelfths 31
27
16
14
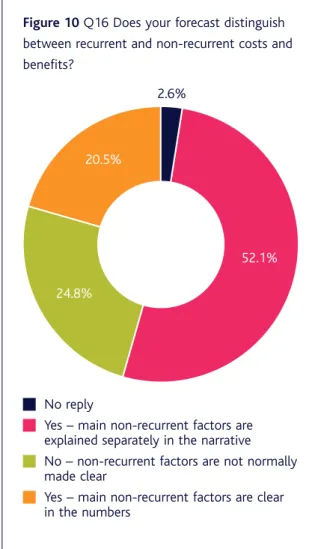
4.9 How do you show non-recurrent items? In total, almost three-quarters (73%) of respondents clearly distinguish between recurrent and non-recurrent costs and benefits in their forecasts, with 52% of respondents stating that the main non-recurrent factors are explained separately in the narrative and 21% stating that non-recurrent factors are clear in the numbers.
20.5%
2.6%
24.8%
52.1% Figure 10Q16 Does your forecast distinguish between recurrent and non-recurrent costs and benefits?
No reply
Yes – main non-recurrent factors are explained separately in the narrative No – non-recurrent factors are not normally made clear
Yes – main non-recurrent factors are clear in the numbers
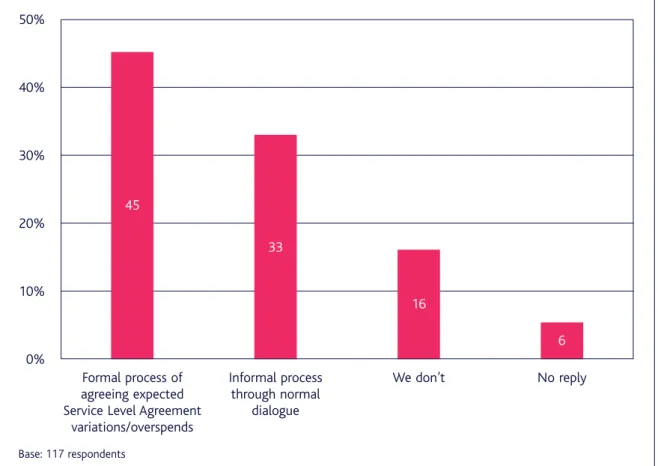
4.10 Are income assumptions consistent between providers and commissioners?
Around 45% of respondents ensure consistency with main providers and commissioners, by a formal process of agreeing expected Service Level Agreement
variations or overspends. A third of all respondents reported using an informal process through normal dialogue to ensure consistency, while 16% stated that they do not ensure consistency.
Figure 11Q17 How do you ensure consistency with host Primary Care Trust (PCT)/main provider? (i.e. so that the provider’s level of income from the host PCT is the same as the PCT assumes in expenditure)
50%
40%
30%
20%
10%
0%
Formal process of agreeing expected Service Level Agreement
variations/overspends
Informal process through normal
dialogue
We don’t No reply
Base: 117 respondents
45
33
16
4.11 Do you flex budgets in-year?
Almost two-thirds (63%) of respondents said that some budgets were ‘flexed’ to account for actual performance, whilst almost one-quarter (24%) of respondents stated that the original plan/budget is never amended. This is a difficult issue. Total Trust and PCT plans cannot be changed after the final plan submission to DH, but organisations may well want to flex the plans of individual divisions and (sometimes) adopt a revised total plan for internal use.
Figure 12Q18 Is the original plan/budget amended to account for the forecast position? 70%
60%
50%
40%
30%
20%
10%
0%
Some budgets are ‘flexed’ to account for
actual performance
Never – the plan remains the same
all year
Most budgets are ‘flexed’ to account for actual
performance
No reply
Base: 117 respondents
63
24
9
4.12 Accuracy of forecasting
When comparing the forecast in December 2005 to the income and expenditure reported in the 2005/06 accounts, exactly half of all respondents stated that the forecast was within £0.5m of the actual reported position.
Notably, 10% of respondents did not reply to this question (a greater non-response than to any other question). Perhaps they did not want to disclose the difference, or perhaps they had not undertaken a forecast in December 2005 and so could not make the comparison.
14.5% 10.3%
25.6%
49.6% Figure 13Q20 When comparing the forecast in December 2005 to the income and expenditure reported in the 2005/06 accounts, were they?
No reply
The forecast was within £0.5m of the actual reported position
The forecast was over £0.5m different to the actual reported position
Both the same
4.13 Future approaches to forecasting in the NHS 60% of respondents are either already exploring other approaches to forecasting or are looking to
change/review their approach to forecasting and would welcome new ideas. This is encouraging.
Figure 14Q21 Which phrase best describes your view of your current forecasting method? 40%
30%
20%
10%
0%
Current method will be used for the forseeable
future
We are exploring other approaches to
forecasting
We would like to change/review our method and would welcome new ideas
No reply
Base: 117 respondents
36
31
29
5 Recommendations
As outlined at the beginning of this paper, an overriding recommendation is the need for honesty and transparency in forecasting. The following ten key recommendations cover the practical issues in producing an honest, accurate and useful forecast.
5.1 What to cover
There should be a monthly financial report covering, at a minimum:
•
income and expenditure•
savings•
staff numbers and pay costs•
actual and forecast balance sheets•
forecast cash flow•
capital expenditure•
key activity and quality measures.It is crucial that the financial forecast takes account of the key non-financial issues, such as activity and manpower, as these will almost always affect finance. This information could be presented in a table, scorecard or ‘executive dashboard’.
5.2 Who to involve in producing the forecast
Forecasts should not be produced by the finance department in isolation but built up by discussions with the managers and clinicians who actually spend the money. It will differ between organisations how far down the management hierarchy finance need to go to get these insights.
5.3 How to profile the forecast
Good practice is to profile the forecast across the future months, at least for the key issues. In that way organisations have early warning when actual results deviate from forecast. In-year forecasts by month should take account of seasonality due to:
•
variations in types of demand, for example:–
more broken bones in winter–
more breathing problems in hot weather.•
variations in energy costs, higher in:–
winter (due to cold weather), or in–
summer (due to air-conditioning costs associated with very hot weather).Since factors such as these will not affect all NHS organisations to the same extent, each organisation has to decide what is significant.
As well as seasonality, certain months might be affected by ad hoc events such as major sporting or cultural events which result in predictable demands from competitors, audience or supporters.
5.4 Reconcile the forecast to the plan and to previous forecasts
Each forecast of the overall surplus or deficit should be reconciled to the plan and to the previous forecast, so that it is clear what has changed. It is also important to learn the lessons when forecasts change:
•
What did you miss?•
Why?•
How might you have improved?This will help to produce more accurate forecasts in the future.
5.5 Reconcile the forecast to actual results to date
Forecasts should always be reconciled to year to date actual results, as a test of credibility. As the year progresses, if you observe significant variances in either direction, or a pattern of increasing divergence from what you have forecast, you need to understand why and consider if the forecast needs revision.
5.6 Check your income assumptions
Be aware of differences in the assumptions of PCT and healthcare providers regarding activity and income levels, since different assumptions create a financial risk for somebody.
Ideally assumptions will be the same, although in reality they may be different for valid reasons. For instance, a PCT may need a demand management initiative to successfully balance its finances, but the local provider may not risk reducing capacity (thereby risking jeopardising patient care) until it sees some evidence that demand is reducing.
SHAs should (and usually do) monitor the consistency of assumptions and the degree of risk. A challenge for the NHS will be how it does this when most providers become Foundation Trusts with separate reporting lines.
5.7 How to handle risks in your forecast
Forecasts should take account of risk, but should be based on the most likely outcome after risk mitigation. Generally board papers should be clear on what the risks are, showing the size of financial risk, the probability, and mitigation plan, although sometimes confidentiality will prevent this in public sessions.
5.8 Distinguish between recurrent and non-recurrent issues
Forecasts (and actual results) should be clear on what is recurrent and what is one-off, so that a difficult recurrent position is not obscured by one-off benefits. Inevitably the greater volatility of income under Payment by Results means that the ‘recurrent’ position is less certain than it used to be.
5.9 How to handle reserves
Specific reserves should be phased to reflect the way that costs are expected to arise. NHS Trusts and PCTs should not need to hold a general reserve.
NHS organisations are encouraged to plan for surpluses where possible. This should have a beneficial impact on how organisations forecast, as breakeven is not the only acceptable answer. It also means that a planned surplus can provide some contingency, reducing the need to hold a general reserve as a ‘cushion’.
5.10 A framework to ensure good practice – learning from the private sector
Evidence suggests that in most cases it is not sufficient to rely on self motivation to generate good forecasting practice. Instead most of us require an external stimulus, which holds us responsible for delivery and accountable for the numbers produced. In the private sector this will be shareholders (often in the form of pension fund managers and analysts) or the banks – both requiring reassurance for the protection of their investments. Failure to deliver on earlier forecasts will lead to escalating responses from both these parties. The NHS could learn from this practice.
The key is robust challenge and accountability. SHAs (and the Department of Health or Monitor) should:
•
reconcile year to date and forecast out turn positions•
fully assess risks and opportunities•
compare risks and opportunities assessments with those of similar organisations (to identifyomissions/weaknesses in this analysis)
•
assess in-month run rates to establish whether forecast changes are realistic and deliverable (focus on comparing the previous three month trend to the forward three month forecast and current management actions to deliver plans)•
review relevant board papers to ensure consistency of focus.Where robust challenge reveals weaknesses, it will usually not be long before the SHA or Monitor intervenes in some way; for instance, by putting in extra management support or by replacing some of the existing management team. The stakes are high – which is why it is so crucial for NHS Trusts and PCTs to produce robust and transparent forecasts.
References
Audit Commission review of the NHS Financial management and accounting regime,July 2006 www.audit-commission.gov.uk
Auditors' Local Evaluation, Audit Commission, October 2006 www.audit-commission.gov.uk
Financial Management in the NHS: NHS (England) summarised accounts 2003-04
Audit Commission, June 2005 www.audit-commission.gov.uk Healthcare Finance,November 2006
Health Service Journal,17 August 2006
Hobsbawm, E. (1994) Age of Extremes: The Short Twentieth Century,(1914-91), Blackwell Publishing
Learning the Lessons from Financial Failure, Audit Commission, June 2006
www.audit-commission.gov.uk The Intelligent Board,
Dr Foster, February 2006 www.drfoster.co.uk
The role of the Finance Director in a Patient Led NHS, National NHS Finance Development Board, June 2006 www.audit-commission.gov.uk
Raising the Standard of Performance Reporting in the NHS,2004
Further resources and information
The following outputs which may be of interest to finance professionals in the NHS are among those available from CIMA’s website:www.cimaglobal.com Costs, care and rationing: A comparative study of intensive care in the UK and FinlandResearch report.
Cost variability in health careResearch report.
Decision-making in health care: Exploring cost variability CIMA Research Executive Summaries Series.
Target costing in the NHS – Reforming the NHS from withinDiscussion Paper by the CIMA NHS Working Group.
Targeting cost– An article by Simon Wombwell ACMA, Deputy Director of Finance and Procurement at Oxford Radcliffe Hospitals NHS Trust.
The CIMA Strategic Scorecard™ – Boards engaging in strategy.A unique tool for Trust boards to utilise and central to a key and on-going effective management and review process. See
www.cimaglobal.com/strategicscorecard The Resource Accounting and Budgeting guide.
Appendix 1
NHS Forecasting Survey
1 Are you a member of CIMA? Yes No
If No, route to Q.3
2 Please can you enter your CIMA contact ID below. Your CIMA contact ID was sent to you with this questionnaire.Obligatory if answered yes to Q1.
3 Which of the following organisations are you currently employed by? (please select ONEoption only)
Primary Care Trust (PCT) Foundation Trust
NHS Trust, Acute NHS Trust, mental health
NHS Trust, ambulance
Strategic Health Authority (SHA)
Other, please specify
4 How frequently do you forecast the following areas for your board? (please select ONEoption per area of financial performance)
Weekly Fortnightly Monthly Quarterly Bi-annually Annually Never
Income and expenditure surplus/(deficit) Cash flow Capital spending Balance sheet Performance against the savings target Headcount/FTE/WTE Patient/client activity levels
5 In relation to the income and expenditure position, which of the following most closely describes the method you use?(please select ONEoption only)
Mainly extrapolation of year-to-date position Extrapolation adjusted for non-recurrent items
Mainly budget plus key variances at high level Mainly built from a bottom-up re-forecast
6 Do you take account of seasonality? Yes No
If No, route to Question 9.
7 Please explain how you take account of seasonality.
8 What style is used to report the income and expenditure forecast in the board report? (please select ONEoption only)
Single figure in a table summarising financial performance Narrative only
Narrative supported by table(s) Narrative supported by chart(s)
Other (please describe)
9 Do you provide a reconciliation between the plan and the
current forecast? Yes No
(ie. analyse the reasons for variation from the plan)
10 Do you provide a reconciliation between the current and
previous forecast? Yes No
11 Does the forecast include a description of the risks
and opportunities? Yes No
(ie. areas which may worsen or improve the forecast)
12 Which phrase best describes the forecast reported to the board? (please select ALLthat apply) Worst case scenario
Best case scenario
Most likely, after anticipated management action
13 How does the forecast income and expenditure position reported to your board compare to the position reported in the regular returns sent to the SHA or Monitor?
(please select ONEoption only) It is always the same
It is normally better It is normally worse
The board report explains any difference from the SHA/Monitor view
14 What is the lowest level in the organisational hierarchy at which you normally re-forecast? (please select ONEoption only)
Total Trust
Directorate/division
Managerial group below directorate/division
Cost centre
Other (please specify)
15 How do you treat any general reserve you are holding?(please select ONEoption only) Phase in equal twelfths
Phase at start of the year based on expected spending by month Re-phase each month to match actual cost
Hold, phased in month 12 only Other (please describe)
16 Does your forecast distinguish clearly between recurrent and non-recurrent costs and benefits? (please select ONEoption only)
Yes – Main non-recurrent factors are clear in the numbers
Yes – Main non-recurrent factors are explained separately in the narrative
No – Non-recurrent factors are not normally made clear
17 How do you ensure consistency with host Primary Care Trust (PCT)/main provider? (ie. so that the provider’s level of income from the host PCT is the same as the PCT assumes in expenditure)
(please select ONEoption only) We don’t
Informal process through normal dialogue
Formal process of agreeing expected Service Level Agreement variations/overspends
18 Is the original plan/budget amended to account for the forecast position? (please select ONEoption only)
Never – the plan remains the same all year
Some budgets are ‘flexed’ to account for actual performance
Most budgets are ‘flexed’ to account for actual performance
19 When comparing the forecast in December 05 to the income and expenditure reported in the 05/06 accounts, were they both the same or was the forecast within £0.5m of the actual reported position, or was the forecast over £0.5m different to the actual reported position?
(please select ONEoption only) Both were the same
The forecast was within £0.5m of the actual reported position The forecast was over £0.5m different to the actual reported position
20 Which phrase best describes your view of your current forecasting method: (please select ONEoption only)
Current method will be used for the foreseeable future We are exploring other approaches to forecasting
August 2007
The Chartered Institute of Management Accountants
26 Chapter Street London SW1P 4NP United Kingdom