www.atmos-chem-phys.net/17/343/2017/ doi:10.5194/acp-17-343-2017
© Author(s) 2017. CC Attribution 3.0 License.
On the implications of aerosol liquid water and phase
separation for organic aerosol mass
Havala O. T. Pye1, Benjamin N. Murphy1, Lu Xu2, Nga L. Ng2,3, Annmarie G. Carlton4,a, Hongyu Guo3, Rodney Weber3, Petros Vasilakos2, K. Wyat Appel1, Sri Hapsari Budisulistiorini5, Jason D. Surratt5,
Athanasios Nenes2,3,6,7, Weiwei Hu8,9, Jose L. Jimenez8,9, Gabriel Isaacman-VanWertz10, Pawel K. Misztal10, and Allen H. Goldstein10,11
1National Exposure Research Laboratory, US Environmental Protection Agency, Research Triangle Park, NC, USA 2School of Chemical and Biomolecular Engineering, Georgia Institute of Technology, Atlanta, GA, USA
3School of Earth and Atmospheric Sciences, Georgia Institute of Technology, Atlanta, GA, USA 4Department of Environmental Sciences, Rutgers University, New Brunswick, NJ, USA
5Gillings School of Global Public Health, The University of North Carolina at Chapel Hill, Chapel Hill, NC, USA 6Institute of Environmental Research and Sustainable Development, National Observatory of Athens,
Palea Penteli, 15236, Greece
7Institute for Chemical Engineering Sciences, Foundation for Research and Technology Hellas, Patras, Greece 8Cooperative Institute for Research in Environmental Sciences, University of Colorado, Boulder, CO, USA 9Department of Chemistry and Biochemistry, University of Colorado, Boulder, CO, USA
10Department of Environmental Science, Policy, and Management, University of California, Berkeley, CA USA 11Department of Civil and Environmental Engineering, University of California, Berkeley, CA USA
anow at: Department of Chemistry, University of California, Irvine, CA, USA
Correspondence to:Havala O. T. Pye ([email protected])
Received: 10 August 2016 – Published in Atmos. Chem. Phys. Discuss.: 16 August 2016 Revised: 23 November 2016 – Accepted: 11 December 2016 – Published: 6 January 2017
Abstract. Organic compounds and liquid water are major aerosol constituents in the southeast United States (SE US). Water associated with inorganic constituents (inorganic wa-ter) can contribute to the partitioning medium for organic aerosol when relative humidities or organic matter to or-ganic carbon (OM/OC) ratios are high such that separa-tion relative humidities (SRH) are below the ambient rela-tive humidity (RH). As OM/OC ratios in the SE US are of-ten between 1.8 and 2.2, organic aerosol experiences both mixing with inorganic water and separation from it. Re-gional chemical transport model simulations including in-organic water (but excluding water uptake by in-organic com-pounds) in the partitioning medium for secondary organic aerosol (SOA) when RH>SRH led to increased SOA con-centrations, particularly at night. Water uptake to the or-ganic phase resulted in even greater SOA concentrations as a result of a positive feedback in which water uptake in-creased SOA, which further inin-creased aerosol water and
or-ganic aerosol. Aerosol properties, such as the OM/OC and hygroscopicity parameter (κorg), were captured well by the
1 Introduction
Water is a ubiquitous component of atmospheric aerosol (Nguyen et al., 2016), which can interact with organic com-pounds in a number of ways to influence particulate mat-ter (PM) mass and size, human health, and Earth’s radia-tive balance. While constituents such as sulfate and nitrate often drive aerosol water concentrations, inorganic and or-ganic compounds are internally mixed under humid condi-tions (You et al., 2013), and hydrophilic organic compounds promote the uptake of water (Saxena et al., 1995). Uptake of water into the organic phase increases particle size, making particles more effective at interacting with radiation (Chung and Seinfeld, 2002), obscuring visibility (Lowenthal and Ku-mar, 2016), and forming clouds (Novakov and Penner, 1993). Water can serve as a medium for partitioning of soluble (Carlton and Turpin, 2013; Pun et al., 2002) and semivolatile (Chang and Pankow, 2010; Pankow and Chang, 2008; Sein-feld et al., 2001) gases, thus contributing to particulate mat-ter concentrations. Once in the particle phase, organic com-pounds can participate in water-mediated reactions such as hydrolysis, driving isoprene epoxydiol uptake to the particle (Surratt et al., 2010; Pye et al., 2013) and loss of gas-phase organic nitrates (Fisher et al., 2016).
Organic–aerosol-water interactions have been examined in a number of laboratory and field studies, and results are mixed. The lack of a consistent relationship in laboratory work may be partially due to experimental conditions such as high mass loadings that minimize the effect of water for semivolatile systems (Pankow and Chang, 2008). Laboratory studies have observed no significant change in yield with in-creasing relative humidity (RH) (Edney et al., 2000; Boyd et al., 2015), enhanced yields under dry conditions (Zhang et al., 2011), and higher yields with increasing aerosol water (Wong et al., 2015) depending on the precursor, oxidant, and seed. Trends in ambient aerosol organic carbon are consis-tent with the trend in decreasing aerosol water in the south-east US (Nguyen et al., 2015b), and Hennigan et al. (2008) observed episodic correlations of water-soluble organic car-bon and water vapor. However, Hennigan et al. (2008) found no well-defined relationship over the entire summer in At-lanta, GA, and organic aerosol was not correlated with liquid water content in Pittsburgh, PA (Griffin et al., 2003). Sax-ena et al. (1995) found that the presence of organic com-pounds suppressed aerosol water in urban locations. In the atmosphere, the relative roles of different secondary organic aerosol (SOA) species change as a function of time and space, and each species may have a different sensitivity to aerosol water.
The interaction of primary organic aerosol (POA), SOA from low-volatility and semivolatile (Ci∗<3000 µgm−3) compounds, SOA from aqueous pathways, and the inorganic/water-rich phase is important for the concen-tration of organic aerosol (OA) as partitioning is a function of the availability of an absorptive medium. Current chemical
transport models, including the Community Multiscale Air Quality (CMAQ) model (Carlton et al., 2010), consider SOA to be exclusively or dominantly formed via condensation of organic compounds in the absence of water. Individual model studies have examined hydrophobic and hydrophilic SOA through semi-mechanistic algorithms and surrogate structure information. Pun et al. (2002) used a decoupled approach in which organic species partitioned only to their dominant phase (aqueous vs. organic). Griffin et al. (2003) allowed compounds to partition to both phases in varying amounts based on their properties. Jathar et al. (2016) examined the implications of water uptake to the organic phase and the effects on OA concentrations. Pun (2008) allowed organic compounds to interact with water and sepa-rate into two phases if thermodynamically favorable. None of these approaches considered mixing of the inorganic and organic phases and often required computationally intensive calculations of activity coefficients. These models accounting for aerosol-water–organic interactions are not in widespread use and have not been evaluated with recently available observations of aerosol water.
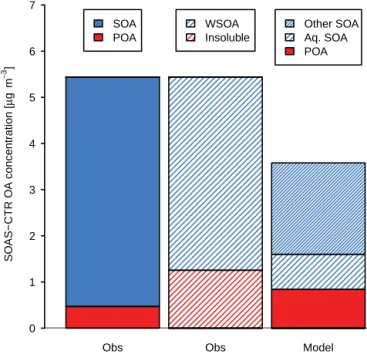
Figure 1 shows the contribution of POA and water-soluble OA (determined from water-soluble organic carbon, WSOC; Sullivan et al., 2004) to total OA as observed during the Southern Oxidant and Aerosol Study (SOAS) for June 2013 in Centreville, AL. Ambient measurements of WSOC are highly correlated with oxygenated organic aerosol (OOA) (Kondo et al., 2007), and water-soluble OA accounted for 90 % of total OA on average in the southeast US during sum-mer 2013 (Washenfelder et al., 2015). WSOC has also been proposed to contain SOA from aqueous pathways with evi-dence for reversible (El-Sayed et al., 2015) and irreversible (El-Sayed et al., 2016) formation. CMAQ tends to overpre-dict the concentration of POA by almost a factor of 2 dur-ing SOAS (Pye et al., 2015). CMAQ predicts a relatively mi-nor role for aqueous OA with the dominant source of OA in CMAQ being dry processes (other SOA in Fig. 1).
Through a series of sensitivity simulations (outlined in Sect. 2.1), this work aims to understand if interactions of aerosol water with semivolatile compounds can resolve model–measurement discrepancies and to what degree OA predicted by models should be classified as water soluble. Semiempirical SOA in the CMAQ model (Sect. 2.2) was con-nected to a consistent set of properties useful for predicting atmospherically relevant behavior such as interaction with aerosol water. In cases where a specific molecular species was not already used as a surrogate, aerosol properties were linked to volatility and parent hydrocarbon (Sect. 2.3). These quantities allowed molecular weights, organic matter to or-ganic carbon (OM/OC) ratios, Henry’s law coefficients, deposition properties, hygroscopicity (κi), phase separation
Obs Obs Model 0
1 2 3 4 5 6 7
S
O
A
S
−
C
T
R
O
A
c
o
n
c
e
n
tr
a
ti
o
n
[
g
m
]
µ
−
3
SOA POA
WSOA Insoluble
Other SOA Aq. SOA POA
Figure 1. Contribution of POA (observed biomass burning OA, BBOA; Xu et al., 2015a), SOA, water-soluble OA (estimated as 2.1×WSOC from the Particle-into-Liquid Sampler (PiLS); Sulli-van et al., 2004), and aqueous (aq.) SOA (model only) to total OA during June 2013 observed at CTR during SOAS and modeled by standard CMAQ. Insoluble OA is the difference between measured total OA and water-soluble OA. Modeled “other SOA” is formed via partitioning to a dry organic phase.
secondary organic aerosol was estimated for monitoring net-works (Sect. 2.9). The property updates will be available in CMAQ v5.2, and their effects on model predictions are illus-trated in Sect. 3.1. The implications of the updates for OA and particle-phase liquid water content (LWC) are examined in the context of routine monitoring networks and Southern Oxidant and Aerosol Study (SOAS) observations (Sect. 3.2).
2 Method 2.1 Simulations
CMAQ v5.1 (Appel et al., 2016) with additional updates was run over the eastern United States for June 2013 at 12 km by 12 km horizontal resolution using the same domain and mete-orological inputs as in the work of Pye et al. (2015). Anthro-pogenic emissions were based on the EPA National Emission Inventory (NEI) 2011 v1. Isoprene emissions were predicted with the Biogenic Emission Inventory System (BEIS) v3.6.1 (Bash et al., 2016). BEIS often predicts lower emissions than the Model of Emissions of Gases and Aerosols from Nature (MEGAN) (Carlton and Baker, 2011), and isoprene emis-sions were increased by 50 % in this work to better agree with observations of isoprene and OH at the SOAS Centre-ville, AL (CTR), site (Fig. S1i–h in the Supplement).
A baseline simulation including surrogate property up-dates detailed in Sect. 2.3 (molecular weight, Henry’s law coefficients, etc.) and three sensitivity simulations examin-ing the implications of aerosol liquid water for SOA were conducted (Fig. 2). In the baseline simulation, POA and tra-ditional SOA were designated hydrophobic and did not in-teract with aerosol water or SOA produced through aqueous pathways following common chemical transport model as-sumptions. Two sensitivity simulations examined the impli-cations of aerosol water on semivolatile partitioning via in-creases in the partitioning medium assuming ideal mixing. In one simulation (idealWi), POA, traditional SOA, aqueous
SOA, and water associated with inorganic constituents were assumed to form one ideal phase when RH was above the separation relative humidity (SRH) and to undergo liquid– liquid phase separation into organic-rich (POA and tradi-tional SOA) and water-rich (aqueous SOA and inorganic con-stituents) ideal phases otherwise. When one phase was pre-dicted to be present (SRH<RH), interactions of semivolatile organic compounds and inorganic water were assumed to be ideal. When phase separation occurred, semivolatile organic compounds did not interact with water. In the second sim-ulation, uptake of water to the organic phase (Wo>0) was
predicted based on its OM/OC andκ-Köhler theory (Pet-ters and Kreidenweis, 2007) (Sect. 2.5). Thus, idealWi and
Wo>0 simulations are meant to capture the effects of
in-organic and in-organic water under ideal conditions separately. The impacts of phase separation and water uptake to organic species along with deviations from ideality determined via an activity coefficient (γ) were simulated together in the third sensitivity simulation (γ 6=1).
2.2 CMAQ organic aerosol
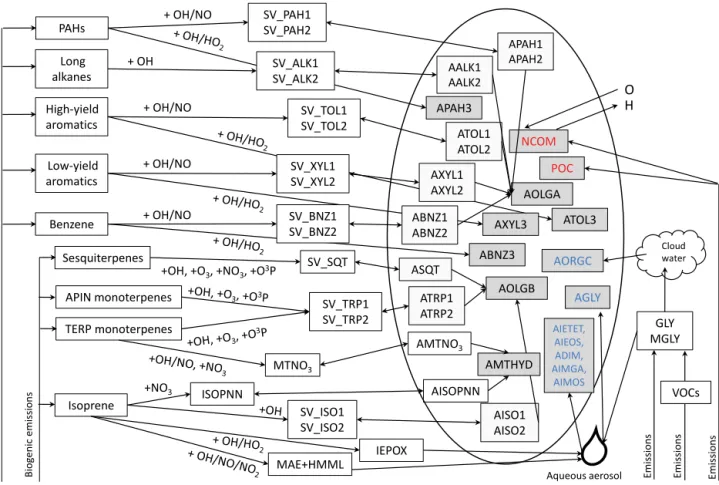
CMAQ v5.1 contains several types of SOA with differ-ent sensitivities to aerosol water: traditional semivolatile SOA from Odum two-product representations, nonvolatile SOA produced by volatile organic compound (VOC) re-action, heterogeneously produced SOA parameterized by an uptake coefficient, semivolatile organic nitrate SOA and its hydrolysis product, and other contributions from cloud processing and accretion/oligomerization reactions (Fig. 3, Table 1). The traditional SOA systems in CMAQ include SOA from isoprene, monoterpenes, sesquiterpenes, benzene, toluene, xylene, alkanes, and polycyclic aromatic hydrocar-bons (PAHs) (Carlton et al., 2010; Pye and Pouliot, 2012). The semivolatile SOA from these precursors is allowed to oligomerize to a nonvolatile form on a 29 h timescale (Carl-ton et al., 2010). Currently, low-NOx oxidation of
Aqueous SOA
POA
PvapSOA
Inorganic phase
Base Ideal Wi Wo > 0
Aqueous SOA
POA
PvapSOA
Inorganic phase
Aqueous SOA
Aqueous SOA
POA
PvapSOA
Inorganic phase
H2O H
2O
H2O H2O
RH>SRH
RH>SRH
H2O
Effect of water due to inorganics
Effect of water uptake, phase separation, and deviations in ideality
g ≠ 1
Aqueous SOA
POA
PvapSOA
Inorganic phase
H2O H2O
H2O
RH>SRH
RH>SRH
Effect of water due to organics
g≠1
g=1 g=1
Figure 2.Interactions of the inorganic phase (e.g., sulfate, nitrate, ammonium, aerosol water), aqueous SOA, vapor-pressure-driven SOA, and POA in the base and sensitivity simulations. Blue arrows depict water partitioning/uptake. Red arrows indicate semivolatile partitioning interactions via modified Raoult’s law. The white dashed arrows indicate aqueous SOA interaction with the inorganic phase (via liquid water, acidity, and particle size).
glyoxal uptake coefficient by the relative Henry’s law coef-ficient (resulting in an uptake coefcoef-ficient of 2.6×10⁻⁴) in this work. Isoprene epoxydiol (IEPOX) SOA is parameter-ized with an uptake coefficient calculated as a function of aerosol phase constituents, including sulfate and water as-suming an acid-catalyzed mechanism (Pye et al., 2013). In this work, the IEPOX organosulfate formation rate constant was updated to 8.83×10⁻³M−2s−1 using the ratio of 2-methyltetrol to organosulfate formation rate constants from Piletic et al. (2013) and a 2-methyltetrol rate constant of 9×10⁻⁴M−2s−1(Eddingsaas et al., 2010). This organosul-fate rate constant is more aggressive (overall and relative) than predicted by Riedel et al. (2016). Overestimates of the organosulfate in the model may compensate for miss-ing IEPOX-derived SOA species such as C5-alkene triols
(Surratt et al., 2010) or additional oligomers (Lopez-Hilfiker et al., 2016). In addition, the Henry’s law coefficient was up-dated to 3.0×10⁷M atm−1 (Nguyen et al., 2014a), which improved model predictions of 2-methyltetrols (Supplement) and total isoprene SOA. The diffusivity of IEPOX in the par-ticle (Da, cm2s−1) was predicted by fitting a line through the
data in the work of Song et al. (2015) resulting in
Da=10(7.18RH−12.7) (1)
for 0≤RH≤1. Semisolid organic aerosol (Da<
10−12cm2s−1) is not expected in the humid eastern US during summer (Pajunoja et al., 2016). SOA from later-generation high-NOx/high-NO2 SOA species (methacrylic
acid epoxide and hydroxymethyl-methyl-α-lactone) is rela-tively minor (Pye et al., 2013; Marais et al., 2016), consistent with observations from SOAS ground sites (Budisulistiorini et al., 2015). All SOA produced through heterogeneous up-take is assumed to be nonvolatile in CMAQ v5.1. SOA from isoprene and monoterpene organic nitrates is semivolatile, but the nitrate groups hydrolyze in the particle to produce
SOA, which is assumed to be nonvolatile, and nitric acid (Pye et al., 2015). SOA from cloud processing is predicted to result in less than 3 % of total organic aerosol in CMAQ. POA and volatility-based SOA is treated as hydrophobic by default, while aqueous and in-cloud SOA is assumed to be hydrophilic and resides in a water-rich phase (CMAQv5.1 aero6i assumptions; Table 1).
2.3 Updating properties of semivolatiles 2.3.1 Molecular properties
For SOA systems, the molecular weight and OM/OC by mass must be specified for mass-to-molecule number unit conversions within CMAQ and to allow for post-processing of organic carbon (OC) from total SOA for comparison to observations. The number of carbons per molecule (nC) is
also specified for the traditional semivolatile systems to allow for oligomerization to conserve carbon (Carlton et al., 2010). Historically, in CMAQ model formulations (v5.1 and prior), the nC, saturation concentration (Ci∗), and OM/OC were
set independently with the OM/OC obtained from cham-ber experiments and nC set to that of the parent
hydrocar-bon. The molecular weight was calculated to be consistent with the number of carbons and OM/OC. The OM/OC val-ues were not a function of volatility or peroxy radical (RO2)
Biogenic emissions
H
Isoprene Sesquiterpenes
APIN monoterpenes Benzene
Low-yield aromatics High-yield aromatics
Anthropogenic emissions
SV_ISO1 SV_ISO2
SV_SQT
SV_TRP1 SV_TRP2 SV_TOL1
SV_TOL2 ATOL1 ATOL2 AXYL1 AXYL2 ABNZ1 ABNZ2
ATRP1 ATRP2 ASQT
AISO1 AISO2
AORGC
AOLGA ATOL3 AXYL3
ABNZ3 AOLGB
POC
VOCs GLY MGLY
Cloud water
Emissions
Emissions
Emissions
NCOM
O
IEPOX
AIETET, AIEOS, ADIM, AIMGA,
AIMOS
Aqueous aerosol
MAE+HMML + OH/NO
+ OH/NO
+ OH/NO
+OH, +O3, +NO3, +O3P
TERP monoterpenes
AGLY
MTNO3
AMTNO3
ISOPNN AISOPNN
AMTHYD SV_BNZ1
SV_BNZ2 SV_XYL1 SV_XYL2
+NO3
Long
alkanes SV_ALK1 SV_ALK2 AALK1 AALK2
APAH1 APAH2 SV_PAH1
SV_PAH2 PAHs
APAH3 + OH/NO
+ OH
Figure 3.Schematic of SOA treatment in current CMAQ-aero6i. Species are described in Table 1. Species in grey boxes are nonvolatile. Species with names in red make up POA (i.e., POA=POC+NCOM, where POC stands for primary organic carbon and NCOM stands for non-carbon organic matter). Species with names in blue form in the model as a direct result of interactions with water.
constituents are expected to show that molecular weight is correlated with vapor pressure (Ci∗) with more ized species having a shallower slope than less functional-ized species (Shiraiwa et al., 2014). Systems examined by Shiraiwa et al. (2014) were found to reside between a line characteristic of O : C=0 (alkane, CnH2n+2) and O : C=1
(sugar, CnOnH2n−2). Sesquiterpene SOA in CMAQ v5.1
re-sides outside the molecular corridor bounds that correspond to O : C=0 (OM/OC=1.17) and O : C=1 (OM/OC=2.3 to 2.5). The CMAQv5.1 Odum two-product isoprene SOA components imply an O : C>1 (which is possible, but not observed by Shiraiwa et al., 2014, and infrequent in the work of Chen et al., 2015).
Structure–activity relationships or group contribution methods can be used to relate vapor pressure, molecular weight, and OM/OC (or molar O : C). Donahue et al. (2011) developed a relationship between the saturation concentra-tion of a pure species (Ci∗=C0∗,i), number of carbons per molecule, and number of oxygens per molecule (nO)
ignor-ing sulfate and nitrate for use with the 2-D volatility basis set (VBS):
log10C0∗,i=0.475(25−nC)−2.3nO+0.6nCnO/(nC+nO).
(2) Built into this relationship are assumptions about the func-tionality of semivolatile organic compounds (specifically equal alcohols and ketones with acid terminal groups), the volatility of a 25 carbon alkane (Ci∗=1 µg m−3), and how a given functional group affects volatility (from the SIM-POL model; Pankow and Asher, 2008). Note that consider-able variability in atmospheric aging exists in terms of the addition of functional groups as indicated on van Krevelen diagrams (Chen et al., 2015). The number of oxygen is re-lated to the molar O : C by
nO=nC(O:C). (3)
O : C can be related to the mass-based OM/OC (Simon and Bhave, 2012):
O:C=12
15
OM
OC
−14
15, (4)
(Cana-Table 1.SOA and semivolatile organic compound (SVOC) species in CMAQ v5.1-aero6i (Carlton et al., 2010; Pye and Pouliot, 2012; Pye et al., 2013, 2015). CMAQ model species names are generally preceded by the letter A to indicate aerosol. Semivolatile surrogates have a corresponding gas-phase species whose name is preceded by the letters SV.
Species Species or production pathway description Partitioning medium in CMAQ v5.1
ALK1 alkane+OH SOA/SVOC Dry organic aerosol
ALK2 alkane+OH SOA/SVOC Dry organic aerosol
BNZ1 benzene+OH high-NOxSOA/SVOC Dry organic aerosol
BNZ2 benzene+OH high-NOxSOA/SVOC Dry organic aerosol
BNZ3 benzene+OH low-NOxSOA Dry organic aerosol
DIM IEPOX-derived dimers Aqueous aerosol
GLY glyoxal+methylglyoxal SOA Aqueous aerosol
IEOS IEPOX-derived organosulfate Aqueous aerosol
IETET 2-methyltetrols Aqueous aerosol
IMGA 2-methylglyceric acid Aqueous aerosol
IMOS MPAN-derived organosulfate Aqueous aerosol
ISO1 isoprene+OH SOA/SVOC Dry organic aerosol
ISO2 isoprene+OH SOA/SVOC Dry organic aerosol
ISO3 acid-catalyzed isoprene SOA∗ Dry organic aerosol
ISOPNN isoprene dinitrate Dry organic aerosol
MTHYD organic nitrate hydrolysis product Aqueous aerosol (from dry organic aerosol parent)
MTNO3 monoterpene nitrate Dry organic aerosol
OLGA oligomers from anthropogenic SOA/SVOCs Dry organic aerosol
OLGB oligomers from biogenic SOA/SVOCs Dry organic aerosol
ORGC glyoxal+methylglyoxal SOA Cloud droplets
PAH1 naphthalene+OH high-NOxSOA/SVOC Dry organic aerosol
PAH2 naphthalene+OH high-NOxSOA/SVOC Dry organic aerosol
PAH3 naphthalene+OH low-NOxSOA Dry organic aerosol
SQT sesquiterpene+OH, O3, NO3, O3P SOA/SVOC Dry organic aerosol
TOL1 toluene+OH high-NOxSOA/SVOC Dry organic aerosol
TOL2 toluene+OH high-NOxSOA/SVOC Dry organic aerosol
TOL3 toluene+OH low-NOxSOA Dry organic aerosol
TRP1 monoterpene+OH, O3, O3P SOA/SVOC Dry organic aerosol
TRP2 monoterpene+OH, O3, O3P SOA/SVOC Dry organic aerosol
XYL1 xylene+OH high-NOxSOA/SVOC Dry organic aerosol
XYL2 xylene+OH high-NOxSOA/SVOC Dry organic aerosol
XYL3 xylene+OH low-NOxSOA Dry organic aerosol
∗AISO3 contains the sum of 2-methyltetrols and IEPOX-derived organosulfates in CMAQv5.1-aero6. It is not used in aero6i as those species are represented individually. Prior to v5.1, AISO3 was determined as an enhancement over AISO1+AISO2 based on [H+] (Carlton et al., 2010).
garatna et al., 2015). OM/OC was the focus of this work in-stead of O : C since OM/OC values are directly used to post-process model output for comparison to observation net-work measurements of OC. In addition, OM/OC ratios are a useful quantity in reconstructing the total mass of PM and could be available routinely from the Interagency Monitor-ing of Protected Visual Environments (IMPROVE) network in the future using Fourier transform infrared spectroscopy (FTIR) analysis (Ruthenburg et al., 2014). The molecular weight (Me) follows as
e
Mi=12nC
OM
OC
. (5)
Equations (2) to (5) provide four equations for six unknowns:
nC, nO, O : C, OM/OC, Ci∗, and Mei. C∗i was obtained
from the Odum two-product fits (Odum et al., 1996) derived
from laboratory data (Carlton et al., 2010; Pye and Pouliot, 2012) andnCwas set to that of the parent hydrocarbon. The
OM/OC and molecular weight were then calculated.nOand
● ● ● ● ● ● ● ● ● ● ● ● ● ● ● ● ● ● ● ● ● ● ● ● ● ● ● ● ● ● ● ● ● ● ● ● ● ● ● ● ● ● ● ● ● ● ● ● ● ● ● ● ● ● ● ● ● ● ● ● ● ● ● ● ● ● ● ● ● ● ● ● ● ● ● ● ● ● ● ● ● ● ● ● ● ● ● ● ● ● ●
Alkane O:C=0, OM/OC=1.17
● ● ● ● ● ● ● ● ● ● ● ● ● ● ● ● ● ● ● ● ● ● ● ● ● ● ● ● ● ● ● ● ● ● ● ● ● ● ● ● ● ● ● ● ● ● ● ● ● ● ● ● ● ● ● ● ● ● ● ● ● ● ● ● ● ● ● ● ● ● ● ● ● ● ● ● ● ● ● ● ● ● ● ● ● ● ● ● ● ● ● ● ● ● ● ● ● ● ● ● ● ● ● ● ● ● ● ● ● ● ● ● ● ● ● ● ● ● ● ● ● ● ● ● ● ● ● ALK1 ALK2 BNZ1 BNZ2 BNZ3 DIM GLY IEOS IETET IMGA IMOS ISO1 ISO2 ISO3 ISOPNN MTHYD MTNO3 OLGA OLGB ORGC PAH1 PAH2 PAH3 SQT TOL1 TOL2 TOL3 TRP1 TRP2 XYL1 XYL2 XYL3 O:C=1, OM/OC~2.3−2.5 Sugar
378 g mol
M o le c u la r w e ig h t [ g m o l ]
log10(C0 *
[µgm−3])
−2 −1 0 1 2 3
50 100 150 200 250 300 1.0 1.5 2.0 2.5 3.0 3.5 4.0 OM OC –1 –1
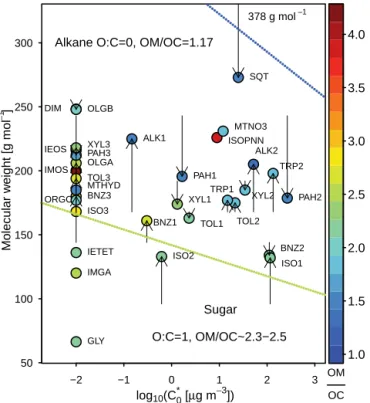
Figure 4.The volatility, molecular weight, and OM/OC of SOA species in CMAQ. Nonvolatile species are arbitrarily plotted at a saturation concentration of 0.01 µg m−3. The arrows start at the old molecular weights assumed in CMAQ v5.1. The arrows end at the new (CMAQ v5.2) molecular weights in Table 2. Lines indicate the properties of alkanes and sugars. The molecular weight of sesquiter-pene SOA in CMAQ v5.1 is off the scale at 378 g mol−1.
2.3.2 Deposition properties
The deposition-related properties of gases, such as their solubility, diffusivity, and reactivity, are related to molecular structure and composition. CMAQ uses a resistance in series method for dry deposition (Pleim and Ran, 2011). CMAQ v4.7 through v5.1 use adipic acid (Henry’s law coef-ficient,H=2×10⁸M atm−1) as a wet deposition surrogate for gas-phase semivolatile organic compounds (SVOCs). Default dry deposition of SVOCs is based on acetic acid (H=4.1×10³exp(63 000K(298−T )/(298T ))M atm−1; gas-phase diffusivity (Dg)=0.0944 cm2s−1; dry
cu-ticular resistance=1200 s m−1; LeBas molar vol-ume=63 cm3mol−1).
Hodzic et al. (2014) used the Generator of Explicit Chem-istry and Kinetics of Organics in the Atmosphere (GECKO) to predict products from various SOA systems commonly represented in models. Henry’s law coefficients were then estimated based on the GROup contribution Method for Henry’s law Estimate (GROMHE) (Raventos-Duran et al., 2010). GROMHE was found to reproduce Henry’s Law co-efficients for organic–water systems with a mean absolute er-ror of about 0.3 log units compared to 0.5 for HenryWin and
0.4 for SPARCv4.2 (SPARC Performs Automated Reasoning in Chemistry; Raventos-Duran et al., 2010). For SOA sys-tems, a strong relationship was observed between saturation concentrations and Henry’s law coefficients, with chemically aged species being less volatile, more functionalized, and more soluble than their parent hydrocarbon. Although the relationship betweenH andCi∗was relatively robust, vari-ability inH spanned many orders of magnitude for a given
Ci∗bin without considering how inorganic species may mod-ify the Henry’s law coefficient. The relationships derived by Hodzic et al. (2014) were used to predict the Henry’s law coefficients as a function of Ci∗ for each SVOC surrogate in equilibrium with the particle in the model. An enthalpy of solvation of 50 kJ mol−1 was also adopted to adjust the Henry’s law coefficients for temperature. Note that although the approach used by Hodzic et al. (2014) is also a group contribution method, it potentially represents the functional groups present in CMAQ SOA species with different groups than would be assumed by Eqs. (2)–(5).
Additional properties needed for deposition include the gas-phase diffusion coefficient, which was calcu-lated as a function of molecular weight via Dg,i=
1.9(Mie)−2/3cm2s−1(Schnoor, 1996), and the LeBas molar
volume (VLeBas), calculated assuming ring-opened products
(Mackay et al., 1993):
VLeBas=14.8nC+7.4nO+3.7nHcm3mol−1, (6)
where the number of hydrogens,nH, is calculated from the
molecular weight assuming only carbon, oxygen, and hydro-gen. Modifications were also made to the deposition param-eters affecting H2O2, IEPOX, and organic nitrates to
pro-duce results consistent with Nguyen et al. (2015a) (param-eters available in the Supplement).
2.4 Predicting phase separation
present, with ammonium sulfate having higher SRH (and less frequent mixing) than ammonium bisulfate, sodium chloride, and ammonium nitrate for a given O : C. During SOAS, inor-ganic aerosol was dominated by(NH4)2SO4and NH4HSO4,
and SRH was diagnosed in CMAQ based on the You et al. (2013) experimental results for ammonium sulfate. The rela-tionship for SRH (fraction between 0 and 1) as a function of O : C was recast in terms of OM/OC:
SRH=
1+exp
7.7OM OC −15.8
−1
. (7)
Since ammonium sulfate has the highest SRH of the salts examined by You et al. (2013), choosing another salt would increase the frequency of phase mixing and difference com-pared to the base simulation.
For simulations considering phase separation in CMAQ (ideal Wi and γ6=1), when the ambient relative humidity
was below the SRH, the model separated the particle into a water-rich phase (containing aqueous SOA) and an organic-rich phase (containing traditional SOA and POA). This sepa-ration of aqueous SOA and traditional SOA at low RH is con-sistent with the work of Ye et al. (2016), who found that iso-prene SOA surrogates unfavorably interacted withα-pinene SOA even at 60 % RH.
2.5 Predicting water uptake to the organic phase Water uptake to the organic phase (Wo>0 andγ6=1
simu-lations) was predicted in CMAQ usingκ-Köhler theory and solving for the volume-equivalent diameter, D (Petters and Kreidenweis, 2007):
RH− D
3−D3 core
D3−D3
core(1−κ)
exp 4σwMew
RT ρwD
!
=0 (8)
and
Dcore=
6
π
X
i6=Wo
Vi
!1/3
, (9)
whereDcoreis the volume (V) equivalent accumulation mode
diameter excluding water associated with organic species,
e
Mw is the molecular weight of water, ρw is the density of
water,Ris the universal gas constant,T is temperature, and
σw is the surface tension of water (0.072 J m−2). In order
to calculate the volume-equivalent diameters, DandDcore,
particle density was needed. Density values in CMAQ v4.7– v5.1 for organic constituents are generally on the order of 2000 kg m−3. The densities of organic aerosol species were updated to chamber-specific information when available (Ng et al., 2007; Chan et al., 2009) and to 1400 kg m−3 other-wise. The mass of particle liquid water associated with or-ganic compounds per volume of air (Wo) was calculated from
Wo=
π Npρw
6 (D
3−D3
core), (10)
where Np was number of particles per volume air. Total
aerosol water in the model was computed as the sum of water associated with inorganics (Wi) calculated with ISORROPIA
v2.2 (Fountoukis and Nenes, 2007) andWo.
The hygroscopicity parameter, κ, was calculated as a volume-weighted sum of the individual componentκi
(Pet-ters and Kreidenweis, 2007) ignoring water associated with organics:
κ=
P
i6=Wo(κiVi) P
i6=Wo(Vi)
. (11)
Cloud condensation nuclei (CCN)-basedκs were used fol-lowing Lambe et al. (2011) due to the completeness of that study. The O : C values obtained by Lambe et al. (2011) were increased by 27 % to account for a low bias in old calibra-tions (Canagaratna et al., 2015). In addition, the relacalibra-tionship was recast in terms of OM/OC, resulting in
κorg,i=0.11
OM
OC −0.10. (12)
Equations in terms of O : C are available in the Supplement. For subsaturated conditions, like those relevant to predict-ing water uptake, the hygroscopic growth factor (hgf)κ is most relevant (Pajunoja et al., 2015); however, CMAQ simu-lations used CCN-basedκorg,i to predict water uptake.
Hgf-basedκs from Duplissy et al. (2011) and Raatikainen et al. (2010) were combined with data from Jimenez et al. (2009) into a parameterization by Lambe et al. (2011). After cor-recting the parameterization to use updated O : C, the param-eterization including hgf-based data resulted in one negative
κand threeκs higher than 0.6 (same as ammonium sulfate), which may be an upper limit onκorg,i (Ervens et al., 2011).
Thus, contrary to the typical trend ofκCCN> κhgf, more than
half of the species hadκCCN< κhgf. Variation from study to
study may be higher than κCCN vs. κhgf variations, which
have been found to be within 30 % for many compounds and unable to be resolved using common measurement tech-niques (Petters and Kreidenweis, 2007).
In the processing of model output, the following equation was used to determine how errors in the concentration of or-ganic compounds ([OA]),κorg, and RH propagated to errors
inWo:
Wo=
ρw
ρorg
[OA]κorg
1
(1/aw−1)
, (13)
with the activity of water (aw) defined as
aw=
RH exp 4σwMew
RT ρwD
. (14)
2.6 Representing the effect of water on semivolatile partitioning
(Sein-feld and Pandis, 2006):
Ai/Mp
Gi
= RT
e
MpγiPisat
, (15)
where Ai is the aerosol phase concentration of species i (µg m−3air), Gi is the gas-phase concentration of i
(µg m−3air), Mp is the mass of the partitioning medium
(µg m−3air), Mep is the molecular weight of the
partition-ing medium,γi is a mole-based activity coefficient, andPisat
is the saturation vapor pressure of purei. This relationship (Eq. 15) is true regardless of how the partitioning coeffi-cient (Ci∗orKp,i) is defined. CMAQ, following Schell et al.
(2001), definesCi∗as
Ci∗≡MeiγiP sat
i
RT , (16)
where the relevant molecular weight is the individual species molecular weight in contrast to the traditional definition of Pankow (1994), which uses the partitioning medium’s molecular weight:
Ci∗0= 1
Kp,i
≡MepγiP sat
i
RT . (17)
Model calculations in this work used the definition in Eq. 16 thus:
Ci∗=GiMieN
Ai , (18)
where the total moles in the partitioning medium (N) are
N =Nother+ X
i
(Ai/Mie). (19)
Nother represents aerosol in the partitioning medium that is
not semivolatile during calculation. Including water in the partitioning medium (either from uptake onto hydrophilic or-ganic compounds or from the inoror-ganic phase) increases the moles of partitioning medium by contributing toNother. The
inclusion of water, and even inorganic constituents, in the ab-sorbing phase has been encouraged for simplified models in order to reproduce more detailed calculations (Zuend et al., 2010).
One equation for one unknown can be derived, whereTiis
the total (Gi+Ai) mass of the semivolatile determined by the
mass-based stoichiometric coefficients and amount of parent hydrocarbon reacted (αi1HC):
f (N )=0=Nother
N −1+
X
i
Ti
C∗i +MieN
. (20)
Equation 20 was solved forN in the model.
e
Mp≈Mie for the interpretation of data from chamber
ex-periments only, and it allows for Ci∗0≈Ci∗ in a single-precursor chamber experiment so that the Odum two-product fit can be determined. Table 2 indicates this was a realistic assumption for most systems as the two surrogate molecu-lar weights vary by less than 10 %. This assumption was not necessary within the CMAQ model.
2.7 Estimating solubility and deviations from ideality When deviations from ideality were considered, the satura-tion concentrasatura-tion used in the modified Raoult’s law was ad-justed using an activity coefficient. All organic–organic in-teractions were assumed to be ideal, and only the inclusion of water drove deviation from ideality. Observations during SOAS indicate that despite a factor-of-7 change in ambient aerosol water concentration from night to day,xw(mole
frac-tion of water in the partifrac-tioning medium) typically varied over a narrow range (80 to 96 % by mole) throughout the day. The activity coefficient for each organic species,γi, was
determined using a one-constant Margules equation: ln(γi)=xw2ln(γ
∞
i ). (21)
Sinceγi∞(the temperature-dependent constant in the Mar-gules equation) corresponds to the activity coefficient at infi-nite dilution in water (xw=1), it can be estimated based on
Henry’s law combined with Raoult’s law:
γi∞= Mieρw
HiC0∗,iRTMew
, (22)
whereC∗0,i is the pure species saturation concentration atT.
γi∞is related to solubility (Si) in mass per volume of water:
Si=HiC0∗,iRT . (23)
The saturation concentration as a function of water becomes
Ci∗=C0∗,i(γi∞)Nw2/N2, (24)
whereNw is the moles of aerosol water in the partitioning
medium. This equation applies across the entire organic-to-water spectrum and shows thatγi∞representsCi∗of a species in water (xw=1) normalized to the pure speciesC0∗,i.
Eval-uatingC∗i for pure water provides,C∗H,i, the saturation con-centration at infinite dilution:
CH,i∗ = Meiρw
HiRTMew
. (25)
Values are available in Table 2. The solubilities of nonvolatile species derived from traditional precursors (oligomers/accretion products) were estimated based on as-suming a C0∗,i between 10−2 and 10−5 µg m−3and the Henry’s law coefficients of Hodzic et al. (2014).
This representation of deviations from ideality resulted in competing effects due to the addition of aerosol water to the partitioning medium. Adding water increased the partition-ing medium as described in Sect. 2.6, which led to more SOA. However, adding water also increased the activity co-efficient via the Margules model (Fig. S2), leading to higher
that large additions of water reduced SOA due to the activ-ity coefficient adjustment. Indeed, all saturation concentra-tions for partitioning into pure water (C∗H,i) are higher than those into pure organic (C∗0,i) by 1 to 4 orders of magnitude (Table 2). A priori assumptions regarding the solubility and activity of monoterpene nitrates were so nonideal that partic-ulate nitrate was driven entirely out of the particle, inconsis-tent with observations (Xu et al., 2015a, b). As a result, the Henry’s law coefficient for monoterpene nitrates (MTNO3)
was increased by a factor of 100 and all activity coefficients were reduced by a factor of 10 compared to a priori values in the CMAQ γ6=1 simulation. These adjustments, deter-mined through a series of sensitivity simulations, may have been necessary due to inaccuracies in the Henry’s law co-efficients, effects of inorganics, pure species saturation con-centrations, molecular weights, Margules model, or a com-bination of all of the above. A posteriori parameters used inγ6=1, which include a factor-of-100 increase in MTNO3
solubility and factor-of-10 decrease in activity coefficients, are available in Table S6.
2.8 Estimating WSOC
WSOC is an operationally defined species measured by adding water to a system and analyzing the dissolved com-pounds (Sullivan et al., 2004). Particulate comcom-pounds with solubilities greater than 10 g L−1 tend to be measured as WSOC regardless of the sampling and extraction method, while compounds with solubilities less than 1×10⁻⁴g L−1 are insoluble (Psichoudaki and Pandis, 2013). To determine the fraction of OA extracted as WSOC (WSOCp), the particle
phase can be modeled as an equilibrium between two phases:
a andb. The fraction of species,i, in phasea compared to the total particulate species concentration is
fa,i = 1+
Ca,i∗ Nb
Cb,i∗ Na
!−1
, (26)
whereNaandNbare the number of moles in phasesaandb,
respectively. If phasebhas no water and is ideal, while phase
ais dominated by water and obeys Henry’s law, then the frac-tion of aerosol speciesiextracted as WSOCp(fWSOC,i) is
fWSOC,i= 1+γi∞
WIOA LWC
e
Mw
e
Mi
!−1
, (27)
where WIOA and LWC are concentration of water-insoluble OA and liquid water in mass per volume of air. Thus WSOC depends on the amount of insoluble material, liquid water, Henry’s law coefficient, and pure species saturation concen-tration.
2.9 Observations for evaluation
Simulations were evaluated by comparing to OC from IM-PROVE, Chemical Speciation Network (CSN), and
South-Eastern Aerosol Research and Characterization (SEARCH) network observations in the eastern US. For comparisons to SEARCH observations, the Jefferson Street, Atlanta, GA (JST), and Birmingham, AL (BHM), urban sites as well as Yorkville, GA (YRK), and CTR, rural sites were considered. In order to estimate secondary organic carbon (SOC), the method of Yu et al. (2007), which uses OC/EC (elemen-tal carbon) ratios, was revised to account for the semivolatile nature of POA. For estimating observed POA from total OA only, POA in CMAQ is assumed to correspond to emissions ofCi∗≈3000 µg m−3 and lower-volatility compounds. The volatility distribution of gasoline vehicle POA from May et al. (2013) and used by the CMAQ-VBS (Koo et al., 2014) was used to estimate how much POA is expected in the par-ticle under ambient conditions.
The fraction of POA in the particle (fP) for each
observa-tion data point was estimated as
fp=
5 X
i=1
αi
1+Ci∗/ (OCobs(OM/OC)mod)
, (28)
where the volatility profile is described by one nonvolatile andC∗i =1, 10, 100, and 1000 µg m−3 surrogate species in the following mass-based abundance (αi): 0.27, 0.15, 0.26, 0.16, and 0.17. Observed SOC was estimated from each ob-served OC by
SOCobs=OCobs−fp(POC/EC)modECobs; (29)
therefore,
POCobs=fp(POC/EC)modECobs. (30)
This calculation only accounts for the effect of dilution and partitioning on POC (primary organic carbon) and does not account for chemical processing that may convert POA to SOA. In addition, compared to other volatility profiles such as diesel POA, this profile tends to be weighted toward lower-volatility compounds. As a result, this approach may be an upper bound on the amount of POC (lower bound on SOC).
3 Results and discussion 3.1 Updated base model 3.1.1 Effect of property updates
Figure 4 shows the updated molecular weights as a func-tion of pure species saturafunc-tion concentrafunc-tion and colored by OM/OC. Values are summarized in Table 2. Four species that were initially outside the O : C=0 and O : C=1 bounds in CMAQ v5.1, ISO1, ISO2, SQT, and BNZ3, were moved within the bounds or just slightly outside as a result of plementing Eq. (2) through (5) for traditional OA. The im-pact of updated OM/OC and molecular weight had small impacts on OM (up to∼4 % decreases) and larger impacts on OC (5–8 % decrease in OC across the southeast). This change was driven by an increase in the OM/OC of bio-genic (semivolatile isoprene and monoterpene) SOA.
Note that there is likely inconsistency in the structure and assumed vapor pressure for methyltetrols and 2-methylglyceric acid. The model considers IEPOX-derived SOA to be mainly 2-methyltetrols and organosulfates with a small amount of oligomers (Pye et al., 2013). All IEPOX-derived species were treated as nonvolatile, but they should be semivolatile given their molecular weight. Lopez-Hilfiker et al. (2016) indicate that IEPOX-derived organosulfates and 2-methyltetrols measured by common techniques in-clude decomposition products of accretion reactions and that IEPOX-SOA should be relatively nonvolatile, consistent with Hu et al. (2016) and the nonvolatile assumption here. The nonvolatile assumption is, however, inconsistent with 2-methyltetrols being present in the gas phase as observed by Xie et al. (2014). The glyoxal SOA in CMAQ also corre-sponded to a monomeric unit. If oligomers are the dominant form for aqueous methylglyoxal SOA (Altieri et al., 2008), then the molecular weight would need to be increased. Given the nonvolatile nature of IEPOX-derived SOA and glyoxal SOA, they were not significantly affected by the sensitivity simulations.
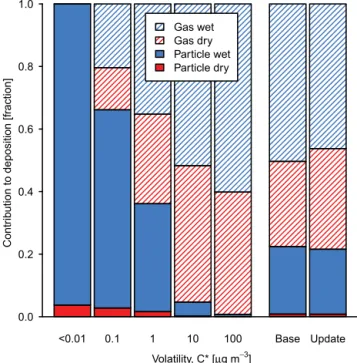
In the base and updated models, dry deposition of OA played a relatively minor role in removing semivolatile com-pounds from the system. Volatility was the primary factor determining the relative role of gas vs. particle deposition for a given species with the specific value of the Henry’s law co-efficient being less important as indicated by relatively small changes in overall deposition between the base and update (Fig. 5). At 298 K, the less volatile SVOCs became more soluble than predicted by base CMAQv5.1, while the more volatile SVOCs became less soluble. With the new parame-ters, dry deposition of gas-phase SVOCs increased by 20 %, while wet deposition decreased by 6 %. Total SOA+SVOC deposition changed by less than 2 %, and surface concentra-tions changed by less than 3 %. Overall, particle-phase depo-sition accounted for 22 % of the loss of SOA+SVOC mass. Dry deposition of gas-phase SVOCs accounted for 32 %, and
Contr
ib
ution to deposition [fr
action]
Volatility, C* [µg m−3]
<0.01 0.1 1 10 100 Base Update
0.0 0.2 0.4 0.6 0.8 1.0
Gas wet Gas dry Particle wet Particle dry
Figure 5.Contribution of wet (blue) and dry (red) deposition of gas (striped) and particle (solid) SVOCs binned by volatility and overall compared to the base simulation (CMAQ v5.1). Nonvolatile species are indicated byC∗<0.01 µg m−3. POA is not included.
wet deposition of gas-phase SVOCs accounted for 46 %. The relative role of gas-phase SVOC wet deposition was twice as important as predicted by Hodzic et al. (2014), consistent with the greater contribution from soluble biogenic species in the southeast in this work. The combined effects of the molecular weight, OM/OC, and deposition updates resulted in a 10 % decrease in predicted OC over the southeast. 3.1.2 Isoprene SOA
Heterogeneously derived IEPOX SOA in CMAQ was as-sumed to be nonvolatile and, thus, was not greatly affected by the sensitivity simulations. Positive matrix factorization (PMF) analysis of Aerosol Chemical Speciation Monitor (ACSM) data and high-resolution time-of-flight aerosol mass spectrometer (HR-ToF-AMS) data identified a factor with prominent m/z 82 signals (Lin et al., 2012; Xu et al., 2015a, b). This factor was referred to as “IEPOX-OA” and “isoprene-OA”, respectively. While it is largely attributed to IEPOX uptake, it may not be entirely due to IEPOX (Xu et al., 2015a, b; Schwantes et al., 2015). The term “isoprene-OA” will be used to refer to the ambient PMF factor regard-less of technique.
Liu et al. (2015) report that only half of the isoprene RO2+HO2SOA is from IEPOX in laboratory experiments.
isoprene-OA at the molecular level. Hu et al. (2015) ex-plained 78 % of isoprene-OA at CTR by molecular tracers measured online (Isaacman et al., 2014) and identified on fil-ters, but only 26 % of isoprene-OA was linked to tracers at LRK (Budisulistiorini et al., 2015). The lack of mass closure in these studies may have resulted from a lack of authentic standards for quantifying accretion products (oligomers and organosulfates).
Regional modeling also indicates that a number of later-generation species besides IEPOX contribute significantly to isoprene-derived SOA in the United States. Marais et al. (2016) indicate that isoprene SOA in the eastern US consists mainly of IEPOX (58 %) and glyoxal (28 %) uptake products, with 14 % due to other species. Ying et al. (2015) attribute only 20 % of isoprene-OA to IEPOX uptake, with roughly an equal contribution from methylglyoxal (MGLY) uptake. Semivolatile isoprene SOA and its oligomers accounted for just under 10 % of isoprene SOA in their work. Thus, it is un-clear if models can consider only SOA from IEPOX for the isoprene system as a surrogate for AMS-measured isoprene-OA.
Figure 6 shows three model definitions of isoprene-OA: SOA due only to IEPOX-reactive uptake, SOA due to IEPOX-reactive uptake and semivolatile isoprene+OH products, and SOA due to IEPOX and glyoxal/methylglyoxal uptake. Also included are the PMF factor observations of isoprene-OA from Xu et al. (2015a) for CTR and Budisulis-tiorini et al. (2015) for LRK. SOA is examined relative to sulfate as sulfate provides the acidity and aerosol medium for heterogeneous uptake (Pye et al., 2013; Marais et al., 2016). Modeled SOA due to IEPOX-reactive uptake was increased relative to CMAQ v5.1 as a result of the higher rate con-stant for organosulfate formation implemented in this work compared to the work of Pye et al. (2013). At the CTR site, all definitions of isoprene-OA led to overestimates of ob-served isoprene-OA relative to sulfate. Isoprene-OA based on IEPOX uptake+semivolatile Odum two-product surro-gates led to the highest predicted concentrations and a slope of 0.70 compared to the observed slope of 0.45. As a result, CMAQ IEPOX-OA could respond more strongly to changes in SOx emissions than ambient data would suggest as the
regression coefficient has been interpreted as the magnitude of the sulfate control on isoprene-OA (Xu et al., 2015a). However, no direct relationship between Odum two-product isoprene SOA and sulfate exists in CMAQ. The correlation between isoprene-OA and sulfate for all three model rep-resentations was high (r >0.8) and close to the observed value (r=0.91), which is also consistent with ongoing mod-eling work with CMAQv5.1 (Vasilakos et al., 2017). On an absolute basis, predicted IEPOX+SV (semivolatile) OA reproduced observed isoprene-OA within 6 % overall with small underestimates in the afternoon. However, modeled sulfate concentrations were lower than observed by 30 % and ISOPOOH+IEPOX concentrations (Nguyen et al., 2015a) were overestimated by a factor of 2.4 in the model
con-● ● ● ● ● ● ● ● ● ● ●●●● ● ●●● ● ●●● ● ●● ● ● ● ● ● ● ●● ● ● ●●●● ●● ● ●● ●● ● ● ● ●●●●●●●●●● ●● ● ● ● ● ● ● ● ● ● ● ● ● ● ● ● ● ● ●● ●●● ● ● ● ● ● ●● ● ● ● ● ● ● ● ● ● ● ● ● ● ● ● ● ● ● ● ● ● ●● ●● ● ● ● ● ● ● ●●●●●●●●●●●●●●●●●● ● ●●● ● ●●● ●● ●●● ●●●●●● ● ●● ● ● ● ● ● ●● ● ●●● ● ●● ● ●●● ● ●● ● ● ● ● ● ● ● ● ● ● ●●●● ●●●●●● ● ● ●● ● ● ● ●●●● ● ● ● ● ● ● ● ●●●●● ●●● ●● ● ●●●●●●● ● ● ● ● ●● ● ●● ●● ● ● ● ● ● ● ● ● ●●●●●●●●●●●●● ● ● ●● ● ● ● ● ● ● ● ● ●●● ● ●●●●●● ● ● ● ●● ● ● ●● ●● ● ●● ● ● ● ●●●● ● ● ●● ● ● ● ● ● ● ●●●●●●●●● ● ● ● ● ● ● ● ● ●●● ● ● ● ● ● ●● ● ● ● ● ● ● ● ● ● ●● ● ● ●●● ● ● ● ●● ●●●●● ● ● ● ● ●● ● ●● ● ●● ● ●● ● ● ● ●●●●●●●●●●● ● ●●● ● ● ● ● ●●● ●●
(a) CTR isoprene-OA vs. sulfate
Observed, b= 0.45 , r= 0.91
● ● ● ● ● ● ●●●●●●●● ● ● ● ● ● ●● ● ●●● ● ● ● ● ●●●● ● ● ● ●●●●● ● ● ●●●●● ● ● ● ● ●●●● ●●●● ● ●●●●● ● ● ●●● ● ●● ●●●● ● ● ● ● ● ● ● ● ● ● ● ● ●●●●● ● ● ● ● ● ● ● ●● ●●● ● ● ● ●● ●● ● ● ● ● ●● ● ● ● ●● ● ● ● ●● ● ● ● ● ● ● ●●●●●● ● ● ●● ● ● ● ● ●● ●●●● ● ● ● ●● ● ● ● ●●●● ● ●●● ● ● ●●●● ●●●●●●●● ● ● ● ● ● ●●●● ● ● ● ●●●●●●●●● ● ●● ● ● ● ●●● ● ● ● ● ●● ● ●● ● ● ●● ●● ● ● ● ● ●●●●●● ● ●● ● ● ● ● ● ●● ● ● ● ● ● ● ● ● ● ● ●●● ● ● ● ● ● ● ● ● ●●●●●●●●●●●●●●●●●●●●●●●●●●●●●●●● ● ●●●●●● ● ● ● ● ● ● ● ● ● ● ● ● ● ● ● ● ●● ●●●●●●● ● ● ● ● ● ●● ●●● ● ● ●●●●●● ● ● ● ● ●●● ● ● ● ● ●●● ● ●●● ● ●●●● ● ● ● ● ● ●● ● ●●● ● ● ● ● ● ●●●●●● ● ● ● ● ● ● ● ● ● ●●●●● ● ●●● ● ● ● ● ● ● ● ●●●●●●●● ● ● ● ● ● ●● ● ●●● ● ● ● ● ●●●● ● ● ● ●●●●● ● ● ●●●●●●● ● ● ●●●● ●●●● ● ●●●●● ●● ●●● ● ●●●●●● ● ● ● ● ● ● ● ● ● ● ● ● ●●●●● ● ● ● ● ● ● ● ●● ●●● ● ● ● ●● ●●●●●●● ●● ● ● ●● ● ● ● ●● ● ● ● ● ● ●●●●●●● ● ● ●● ● ● ● ● ●● ●●●●● ● ●●●●●●●●● ●●●●●●● ●●● ● ●●●●●●●● ● ● ● ● ● ●●●● ● ● ● ●●●●●●●● ●● ●●● ● ● ●●● ● ● ●● ●● ● ●● ● ● ●● ●● ● ● ● ● ●●●●●● ●●● ● ● ● ● ● ●●● ● ● ●● ● ● ● ● ● ●●● ● ● ● ● ● ● ● ● ●●●●●●●●●●●●●●●●●●●●●●●●●●●●●●●●●●●●●●●● ● ● ● ●● ● ● ● ● ● ● ● ● ● ● ●● ●●●●●●● ● ● ● ● ● ●● ●●● ● ● ●●●●●● ● ● ● ● ● ●● ● ● ● ● ●●● ● ●●●● ●●●●●●●●●●●●●●● ●● ● ● ● ●●●●●●●●●●● ● ● ● ● ●●●●● ● ●●● ●●●●●●●●●●●●●●● ●● ●●● ●●●●●● ● ● ● ● ●●●● ● ● ● ●●●●● ● ● ●●●●●●● ● ● ●●●● ●●●● ● ●●●●● ●● ●●● ● ●● ●●●● ● ● ● ● ● ● ● ● ● ● ● ● ●●●●● ● ● ● ● ● ● ● ●● ●●● ● ● ● ●● ●●●●●●●● ● ● ● ●● ● ● ● ●● ● ● ● ● ● ● ●●●●●● ●● ●● ● ● ● ● ●● ●●●●● ● ● ●● ● ● ● ●●●● ● ●●● ● ● ●●●●●●●●●●●●● ● ● ● ● ●●●● ● ● ● ●●●●●●● ● ●● ●●● ● ● ●●● ● ● ●● ●● ● ●● ● ● ●● ●● ● ● ● ● ●●●●●● ● ●● ● ● ● ● ● ●● ● ● ● ●● ● ● ● ● ● ●●● ● ● ● ● ● ● ● ● ●●●●●●●●●●●●● ● ● ● ●●●●●●●●●●●●●●●● ● ●●●●●● ● ● ● ● ●● ● ● ● ● ● ● ● ● ● ● ●● ●●●●●●● ● ● ● ● ● ●● ●●● ● ● ●●●●●● ● ● ● ● ● ●● ● ● ● ● ●●● ● ●●●● ●●●●●●● ● ● ●●●● ● ● ● ● ● ● ● ●●●●●● ● ● ● ● ● ● ● ● ● ●●●●● ● ●●● ●
IEPOX+GLY, b= 0.64 , r= 0.89 IEPOX, b= 0.51 , r= 0.85 IEPOX+SV, b= 0.7 , r= 0.88
0 2 4 6 8 10 12
0 2 4 6 8 10
Is op re ne -O A [ g m ] µ − 3
Sulfate [µg m−3]
●● ● ● ● ● ● ● ●●●●●● ● ● ● ● ● ● ●●●●●●●●●●●●●●●●● ●●●● ●●●●●●● ● ● ● ● ●● ● ● ● ● ●●● ●● ●● ● ● ● ● ● ●●● ● ● ● ● ● ● ● ● ● ● ● ● ● ●● ● ●●●● ● ●● ● ● ●●● ●●●●● ● ●● ● ● ●●●●●●●●●●● ● ● ● ●●● ● ●●●● ● ● ●● ● ●● ● ● ●● ● ● ● ● ● ● ● ● ● ● ● ● ● ● ●● ● ● ● ● ●● ● ● ● ● ● ● ● ● ● ● ● ●● ● ● ● ●●●● ● ●●●●●●●●● ● ● ●●●●●●●●● ● ●● ●● ●● ●●●●● ●●●● ● ● ●● ● ●●● ● ● ●● ● ● ● ● ● ● ● ● ● ● ● ● ● ● ● ● ● ● ● ● ●● ● ● ● ● ● ● ● ● ● ● ● ● ● ● ● ● ● ● ● ● ● ●● ● ● ●● ● ● ● ● ●● ●● ●●● ● ● ● ● ● ●●●●● ●●●●● ● ● ● ●●●● ● ● ● ● ● ● ● ● ●● ●● ●● ● ● ● ● ●●●●●●● ● ● ●● ● ● ● ● ● ● ● ● ●●● ● ●● ● ● ●● ● ● ● ●● ● ●● ● ●
(b) LRK isoprene-OA vs. sulfate
Observed, b= 0.83 , r= 0.87
● ●●● ●●● ●●●●●●●●●●●● ● ● ● ● ● ●● ●●● ● ● ● ●●●●●●●●●●●● ● ● ● ● ● ● ● ● ● ●● ● ● ● ● ● ● ● ● ●●●● ● ● ● ●● ● ● ●●●●● ● ● ●● ● ● ● ● ● ● ● ● ● ● ●● ● ● ● ● ● ●●●●●● ●●●● ● ● ● ● ●● ● ● ● ●●●●● ● ● ● ●●●●●●●●●● ● ●●●●●●●● ● ● ● ● ● ● ●● ●● ● ● ● ● ● ●● ● ● ● ● ● ● ● ● ● ● ● ●●● ● ● ●● ●● ● ●●● ●● ●●●●●●●●●●●●●●●●●●● ●●● ● ●●●●●●●● ●●●●●●●●●●●●●●● ● ● ● ● ● ● ● ● ● ● ● ● ● ● ● ● ●● ● ● ●● ●●●● ●● ● ● ● ●● ●●● ● ● ● ● ● ● ●●● ● ● ● ● ●● ●● ●● ● ● ● ●● ●●● ● ●● ● ●●● ● ● ● ● ● ● ●●●●● ● ●● ●●●● ● ●● ● ●●● ● ●●● ●●●●●●● ●● ●● ●● ● ● ● ● ● ● ● ●●● ● ●● ● ●●●● ●● ● ● ● ●● ● ●
IEPOX+SV, b= 0.79 , r= 0.94
● ●●● ●●● ● ●●●●●●●●●●● ● ● ● ● ● ●● ●●● ● ● ● ●●●●●●●●●●●● ● ● ●●● ● ● ● ● ●●●● ● ● ● ● ● ● ●●●● ● ● ● ●●● ●● ● ● ● ● ● ● ●● ● ● ● ● ● ● ● ● ● ● ●● ● ● ● ● ● ●●●●●●●●●● ● ● ● ● ● ● ● ● ● ●●●●● ● ● ● ●●●●●●●●●● ● ●●●●●●●●● ● ● ● ● ● ●● ● ● ● ● ● ● ● ●● ● ● ● ● ● ● ● ● ● ● ● ●●● ● ● ●● ●● ● ●●● ●● ●●●●●●●●● ●●●●●●●●●●●● ● ● ●●●●●●● ●●●●●●●●●●●●●●●● ● ● ● ● ● ● ● ● ● ● ● ● ● ● ● ●●● ● ● ●● ●●●● ● ● ● ● ● ●● ●●● ● ● ● ● ● ● ●●● ● ● ● ● ●● ●● ●● ● ● ● ●● ●●● ● ● ● ● ●●● ● ● ● ● ● ● ●●●●● ● ●● ● ●●● ●● ● ● ●●● ● ●●● ●●●●●●● ●● ●● ●● ● ● ● ● ● ● ● ●●● ● ●● ● ●●●● ●● ● ● ● ●● ● ●
IEPOX, b= 0.61 , r= 0.93
● ●●● ●●● ● ●●●●●●●●●●● ● ● ● ● ● ●● ●●● ● ● ● ●●●●●●●●●●●● ● ● ● ● ● ● ● ● ● ●●●● ● ● ● ● ● ● ●●●● ● ● ● ●●● ● ●●●●● ● ● ●● ● ● ● ● ● ● ● ● ● ● ●● ● ● ● ● ● ●●●●●●●●●● ● ● ●●●●●●●●●●●●●●●●●●●●● ●● ●● ● ●●●●●●●●● ● ● ● ● ● ●● ● ● ● ● ● ● ● ●● ● ● ● ● ● ● ● ● ● ● ● ●●● ● ● ●● ●● ● ●●● ●● ●●●●●●●●●● ●●●●●●●●● ●●● ● ●●●●●●●● ●●●●●●●●●●●●●●● ● ● ● ● ● ● ● ● ● ● ● ● ● ● ● ●●● ● ● ●● ●●●● ● ● ● ● ● ●● ●●● ● ● ● ● ● ● ●●● ● ● ● ● ●● ●● ● ● ● ● ● ●● ●●● ● ●● ● ●●● ● ● ● ● ● ● ●●●●●● ●●●●●● ● ●● ●●●● ● ●●● ●●●●●●● ●● ●● ●● ● ● ● ● ● ● ●●● ● ● ● ●● ●●●● ●● ● ● ● ●● ● ●
IEPOX+GLY, b= 0.74 , r= 0.95
0 2 4 6 8 10 12
0 1 2 3 4 5
Sulfate [µg m−3]
Figure 6.Isoprene-OA vs. sulfate at(a)CTR and (b)LRK and the slope (b, forced through 0) and correlation coefficient (r) for each data set. Model representations of isoprene-OA include
SOA from IEPOX uptake and semivolatile isoprene+OH SOA
(IEPOX+SV), SOA from IEPOX uptake (IEPOX), and SOA from
IEPOX and glyoxal uptake (IEPOX+GLY).
sistent with other modeling work (Vasilakos et al., 2017). Thus, as better agreement is obtained for the gas-phase iso-prene species, additional increases in processes that convert isoprene RO2+HO2products to the particle phase may be
needed despite the overestimates relative to sulfate shown in Figure 6 for Centreville. These additional processes may in-clude accounting for partitioning of 2-methyltetrols to the gas phase, formation of C5-alkene triols, and/or faster
oligomer-ization (Lopez-Hilfiker et al., 2016; Xie et al., 2014; Surratt et al., 2010).
At LRK, the different model representations of isoprene-OA closely resembled the observed isoprene-isoprene-OA to sulfate ratio of 0.83. IEPOX uptake alone resulted in a slope of 0.61, and IEPOX uptake along with semivolatile isoprene+OH products results in a slope of 0.79. The model showed only a slightly stronger relationship to sulfate than the obser-vations (observedr=0.87), with the different model rep-resentations indistinguishable in their correlation with sul-fate (model r=0.93 to 0.95). Similar to the model at the CTR site, CMAQ underpredicted sulfate at LRK by about 30 %. IEPOX+SV isoprene-OA was biased lower than ob-served OA by almost 40 %, and the bias in isoprene-OA (IEPOX+SV) was correlated with the bias in sulfate. ISOPOOH+IEPOX was underestimated by 60 % at LRK, in contrast to the CTR site, where it was overestimated (Sup-plement). Thus, isoprene products in the model were too ef-ficiently converted to SOA at LRK despite the low sulfate. 3.1.3 Total OA
SOA. An IMPROVE network observation with a value of 16.9 µg C m−3 (at SHMI1, Shamrock Mine, CO) had a
Cook’s distance (Cook, 1977) much greater than 1 in a base model–observation comparison and was subsequently removed from all analysis. For the IMPROVE network, 86 % of observed OC was predicted to be secondary in nature (Eq. 29), while CMAQ predicted 46 % of OC was secondary. The variability in predicted SOA fraction (standard devia-tion, s, of 0.21) was much higher than the variability in observed SOA fraction (s=0.08). The CSN network (with a greater proportion of urban sites) was slightly less sec-ondary in nature with 79 % of OC as SOC (s=0.11) and CMAQ predicting 40 % of model OC as SOC (s=0.19). The SEARCH network was the most influenced by SOA of the three networks. SEARCH OC was predicted to be 88 % SOC (s=0.06), while CMAQ indicated 58 % SOC (s=0.19). PMF analysis at the urban JST site during sum-mer 2011 and 2013 indicates that POA (hydrocarbon-like or-ganic aerosol (HOA), biomass burning OA (BBOA), cooking organic aerosol (COA)) factors accounted for 18–30 % of to-tal OA (Xu et al., 2015a; Budisulistiorini et al., 2013), while CMAQ predicted a 42 % contribution of POC to OC aver-aged across the urban and rural sites here.
Figure 7 indicates that overestimates in POC roughly com-pensated for underestimates in SOC in the updated CMAQ model. CMAQ predicted that total OC was within 20 % of average observed OC across each network. The normalized mean bias (NMB) for POC and SOC was much larger in magnitude than for total OC but relatively constant between networks. Specifically, SOC was lower by 40 %, while POC was higher by a factor of 1.7 to 1.8. The overestimate in model POC at the routine network locations was consistent with the model overestimate in AMS/ACSM-measured POA at SOAS CTR and LRK sites. Neither site resolved a HOA-type aerosol (Xu et al., 2015a; Budisulistiorini et al., 2015), indicating that POA from fossil fuel sources contributed less than 5 % of total OA. A BBOA-type aerosol was resolved at the CTR site and episodic in nature. Comparing CMAQ-predicted POA from all sources to the BBOA factor at CTR indicated that CMAQ generally overestimated POA by a fac-tor of 2, similar to the overestimate for network OC observa-tions.
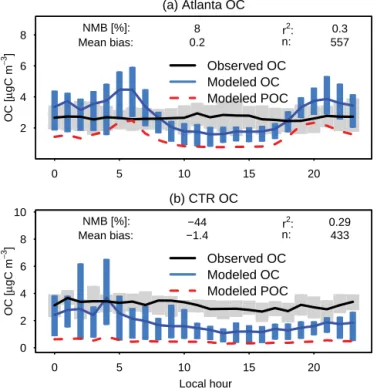
Additional insight into biases can be obtained by examin-ing the diurnal profiles of OC (Fig. 8). The diurnal profile of observed OC is relatively flat at the SEARCH sites, consis-tent with flat total OA (Xu et al., 2015b). CMAQ predictions had a pronounced diurnal profile, with higher concentrations (and relatively good performance or overpredictions) at night and lower concentrations (coinciding with underestimates) during the day. Averaged across the two urban sites (JST and BHM), however, CMAQ showed no bias as a result of compensating diurnal and spatial errors. Rural OC (YRK and CTR) was underpredicted by about one-third. Also included in Fig. 8 is the diurnal profile of POC in red dashes. Mod-eled POC at the Atlanta site correctly showed high
concentra-tions in the morning (06:00 LT) and evening (19:00 LT), but tended to peak several hours earlier than HOA observed at JST in 2012 (Budisulistiorini et al., 2016). JST total model-predicted POC during morning and evening transition hours was roughly the same magnitude as total observed OC, fur-ther indicating that CMAQ tends to overestimate primary or-ganic aerosol.
3.2 Role of water
3.2.1 Effect on network OC
Figure 9 shows how including water interactions in absorp-tive partitioning calculations affected model predictions of OC at routine monitoring network locations. While includ-ing water associated with inorganic species (idealWi
simula-tion) in the partitioning medium for SOA decreased the bias in SOC for all networks, it led to small increases in the mean error. Except for the SEARCH network, including organic water (Wo >0) also reduced the mean bias at the expense
of mean error. The simulation taking into account nonideal-ity (γ6=1) resulted in low normalized mean bias (≤10 %) and large improvements in the mean bias compared to all other simulations. The mean error forγ 6=1 was marginally increased over the base simulation.
Figure 9 highlights that increases in bias occurred during the night (SEARCH network). The largest increases in bias occurred for theWo>0 simulation as a result of a large
con-tribution of organic water. Similar to the results for the CTR site (Sect. 3.2.3), daytime concentrations of SOC increased but were still low compared to observations. In general, the variability in the bias increased as a result of water interac-tions, while the mean bias decreased.
resi-−0.11 0.28 −0.39 0.11 0.71 −0.6 −0.48 0.59 −1.07
C
M
A
Q
bi
a
s
[
µ
gC
m
−
3]
OC POC SOC OC POC SOC OC POC SOC
IMPROVE CSN SEARCH
−4 −3 −2 −1 0 1 2
n 762 739 2648
MB ME NMB [%]
r2
0.46 0.29 0.51 −10 177 −42 0.77 0.75 0.62
0.63 0.73 0.72
6 178 −42
0.84 0.68 0.71
1.33 0.61 1.36 −17 181 −43 0.71 0.63 0.65
Figure 7.Aerosol OC, POC, and SOC predicted by the base model simulation (Mi) compared to CSN, IMPROVE, and SEARCH (JST,
BHM, CTR, and YRK) observations (Oi). Mean bias (MB= 1n6i=n 1(Mi−Oi)) and mean absolute gross error (ME= 1n6ni=1|Mi−Oi|)
are in micrograms of carbon per cubic meter. X symbols indicate mean bias. Boxplots indicate 5th, 25th, median, 75th, and 95th percentile.
r2based on a zero intercept.nis the number of observations. NMB=6 n
i=1(Mi−Oi)
6n i=1Oi .
(a) Atlanta OC
2 4 6 8
0 5 10 15 20
OC [
µ
gC
m
−
3 ]
8 NMB [%]:
0.2 Mean bias:
0.3 r2:
557 n:
Observed OC Modeled OC Modeled POC
(b) CTR OC
0 2 4 6 8 10
0 5 10 15 20
OC [
µ
gC
m
−
3 ]
−44 NMB [%]:
−1.4 Mean bias:
0.29 r2:
433 n:
Observed OC Modeled OC Modeled POC
Local hour
Figure 8.OC as a function of hour of the day for a SEARCH urban (Atlanta, JST) and rural (CTR) site during June 2013. Bars/shading indicate 25th to 75th percentiles. Lines indicate means. Red dashed lines indicate model-predicted POC.
dence time of 7 s, which is much longer than the post-drying time used by the AMS in SOAS (approximately 1 s) and the time in the aerodynamic lens (approximately 0.01 s). A prior study reported that evaporation of ammonium nitrate, a water-soluble and semivolatile species, was not observed when using post-drying residence times of about 1 s (Guo et al., 2016). While this topic should be subject to additional
research, the AMS data in SOAS are unlikely to have signif-icant biases due to this effect.
3.2.2 Frequency of phase separation
Figure 10a shows the June 2013 predicted average OM/OC across the model domain for the simulation in which phase separation and ideal interactions with inorganic wa-ter were predicted (idealWi). Emitted POA in CMAQ has
an OM/OC of 1.25 for vehicles, 1.7 for biomass burning, and 1.4 for other sources, and heterogeneous aging of the POA results in the OM/OC increasing with time (Simon and Bhave, 2012). The urban sites of Birmingham, AL, and Atlanta, GA, had predicted OM/OC ratios between 1.3 and 2.2 with a mean of 1.8, while the rural SEARCH sites of Centreville, AL, and Yorkville, GA, had values between 1.7 and 2.2 with a mean of 1.9, consistent with previous work (Simon et al., 2011).