AN EQUITY ANALYSIS OF PERFORMANCE-BASED FINANCING
IN RWANDA
Martha Priedeman Skiles
A dissertation submitted to the faculty of the University of North Carolina at Chapel Hill
in partial fulfillment of the requirements for the degree of Doctor of Philosophy in the
Department of Maternal and Child Health in the Gillings School of Global Public Health.
Chapel Hill
2012
Approved by:
Siân Curtis, PhD
Gustavo Angeles, PhD
Paulin Basinga, MD, PhD
Kavita Singh Ongechi, PhD
ii ©2012
iii
Abstract
MARTHA PRIEDEMAN SKILES: An equity analysis of performance-based financing in
Rwanda
(Under the direction of Dr. Siân L. Curtis)
Maternal and child health services favor the wealthiest in lower and middle income countries. Debate about the potential of performance-based financing (PBF) to address these disparities continues. As PBF is adopted by other countries, it is critical to understand the equity effects for primary health care services. The aim of this dissertation is to evaluate the effects of PBF on equity in maternal and child health service use when no specific provisions target the poorest in the population.
In Rwanda, PBF was designed to increase health service use and improve quality of services provided. Paired districts were randomly assigned to intervention and control for PBF implementation. Using Rwanda’s Demographic Health Survey data from 2005 (pre-intervention) and 2007-08 (post-intervention), cluster-level panel datasets of 7,899 women 15-49 years of age and 5,781 children 0-59 months living in intervention and control districts were created. A difference-in-differences estimation strategy was used to evaluate the program impact of PBF on select primary maternal and child health service outcomes. Interaction terms between wealth quintiles and PBF were estimated to identify the differential effect of PBF among women and children from poorer households.
iv
Treatment received for childhood illnesses, however, significantly improved for children in PBF districts, and data suggests that poorer children benefited more.
These results indicate that PBF may be an effective strategy for increasing access when use is uniformly low and a service is well incentivized; but PBF will do little to alleviate
v
vi
Acknowledgements
vii
Table of Contents
List of Tables... ix
List of Figures ... xi
Chapter 1: Introduction ... 1
Maternal and Child Health ... 1
Equity in Health and Health Service Use... 4
Rwanda’s Health Reforms ... 6
Performance-Based Financing ... 8
Chapter 2: Research Aims and Methods ... 15
Aims and Hypotheses ... 16
Conceptual Framework ... 17
Study Setting and Design ... 21
Data ... 23
Statistical Approach ... 26
Chapter 3: Are Maternal Health Services Reaching the Poorest Women?... 29
Study Sample... 29
Measures ... 29
Results ... 31
Discussion and Limitations ... 37
Chapter 4: Impact of PBF on Care-Seeking and Treatment for Childhood Illness ... 42
Study Sample... 42
viii
Results ... 44
Discussion and Limitations ... 50
Chapter 5: Conclusions and Implications ... 54
Policy Implications ... 55
Programmatic Implications ... 59
Methodological Issues ... 61
Conclusion... 64
Appendix A ... 65
ix
List of Tables
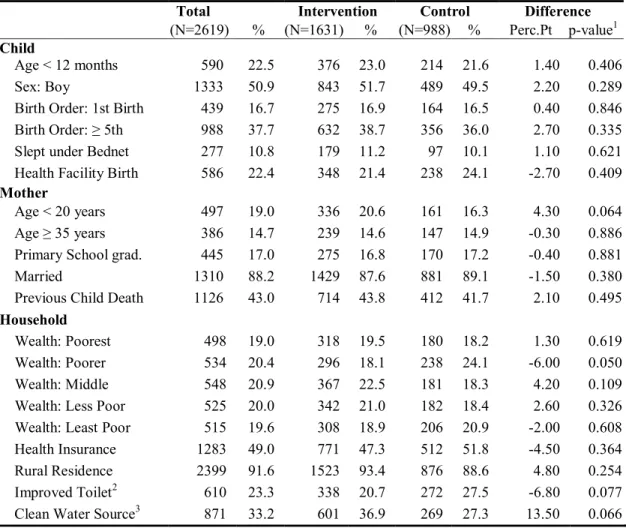
Table 3.1 Woman and household characteristics by intervention and control samples at
baseline ... 31 Table 3.2. Percent of women reporting key outcomes by study sample and year ... 34 Table 3.3. Estimated effects of performance-based financing on service use ... 35 Table 3.4. Estimated differential effects of performance-based financing by wealth on
service use ... 36 Table 3.5. Estimated differential effects of performance-based financing by wealth on
service use, stratified by residence ... 37 Table 4.1. Comparison of mother and household characteristics between the intervention
and control samples at baseline ... 44 Table 4.2. Number and percent of children reported ill, seeking care, and receiving
treatment in past two weeks by study sample and year ... 46 Table 4.3. Estimated change in the probability of reported childhood illness and facility
care-seeking in PBF and Control Districts, from 2005 to 2007: DD regression
results ... 47 Table 4.4. Estimated change in the probability of treatment received among children
seeking curative care in PBF and Control Districts, from 2005 to 2007: DD
regression results ... 48 Table 4.5. Estimated change in the probability of treatment received for diarrhea or fever
by wealth quintile, in PBF and Control Districts, from 2005 to 2007: DD and
DDD regression results1 ... 49 Table A.1. Output indicators and quality weights used to determine performance-based
financing payments ... 65 Table A.2. Linear probability models for effect of PBF on maternal health service use,
with and without community fixed effects ... 66 Table A.3. Linear probability models with community fixed effects for effect of PBF on
maternal health service use, differentiated by wealth and stratified by
residence ... 68 Table A.4. Linear probability models for effect of PBF on reported diarrhea, fever and/or
symptoms of ARI, and facility care-seeking, differentiated by wealth ... 71 Table A.5. Linear probability models for effect of PBF on reported on reported diarrhea
x
Table A.6. Linear probability models for effect of PBF on treatment received for diarrhea
xi
List of Figures
Figure 2.1. Conceptual Model ... 20
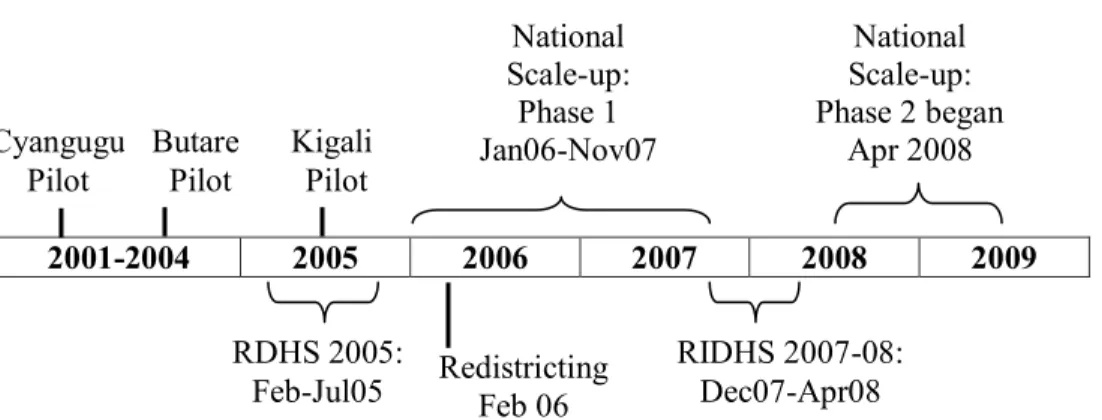
Figure 2.2. Timeline of PBF implementation and DHS data collection in Rwanda ... 23
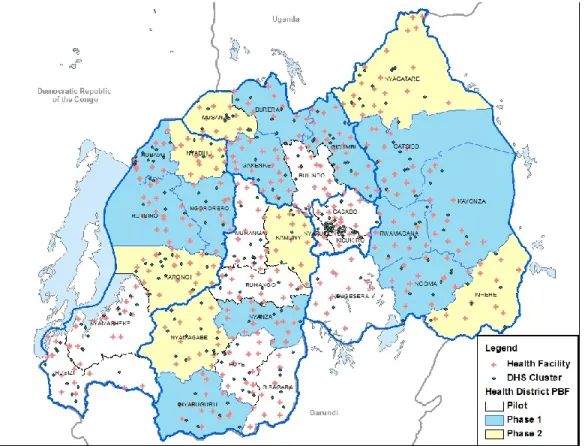
Figure 2.3. Districts by PBF implementation phase, Rwanda 2006 ... 25
Figure 3.1. Concentration curve: Early ANC ... 32
Figure 3.2. Concentration curve: ≥ 4 ANC ... 32
Figure 3.3. Concentration curve: Facility Birth ... 32
Chapter 1
Introduction
In Rwanda, considerable improvements have been reported for select maternal and child health indicators, including higher contraceptive prevalence, earlier use of antenatal care (ANC), more facility versus home births, increased childhood immunization coverage, and increased care-seeking for ill children.1-3 These indicators collectively point to improved use of health services, yet give little illumination about why service use has increased. Moreover, an inequity in service use between the richest and the poorest has been noted.3
In 2005, Rwanda formally adopted a national performance-based financing (PBF) initiative to increase health care worker productivity and quality of services provided at hospitals and health centers.4 This dissertation seeks to determine whether a PBF program, without equity targets, can differentially impact the use of select, preventive and curative health care services among the poorest women and children in Rwanda.
Maternal and Child Health
Maternal and child survival continue to improve globally, yet many countries will not meet the Millennium Development Goals (MDGs) by 2015. In September 2000, the
2
Childhood mortality has also declined globally in the past 20 years to 60 deaths per 1,000 live births in 2009, yet the possibility of meeting the targeted two-thirds reduction for MDG 4 remains elusive.10 In sub-Saharan Africa where pneumonia, diarrhea, and malaria remain the leading killers for children under five, the mortality rate remains twice that of the global average.10 Particularly vulnerable are children from the poorest households who are 80% more likely to die in the first five years of life compared to children from the wealthiest households.10
In Rwanda, progress in meeting the MDGs historically has not been consistent or
adequate, yet remarkable progress has been made in the past decade. The maternal mortality rate was declining prior to the 1994 genocide, reversed itself during the war years, before starting to decline again after 2000.10 Maternal mortality rose from 1,100 deaths per 100,000 live births in 1990 to 1,400 in 1995 then dropped to a new low of 540 in 2008, marking a 50.9% decrease from 1990 to 2008.10
Service indicators for maternal health in Rwanda have shown remarkable improvements in the past decade. The latest Demographic and Health Survey (DHS) reports an improvement in facility deliveries from 28% in 2005 to 69% in 2010.3 Similarly modern contraceptive use among married women increased dramatically from 10% in 2005 to 45% in 2010.3 The equity gap in maternal service use has also improved since 2005, when a 50 percentage point difference in facility deliveries existed between the poorest and least poor wealth quintile. This gap closed to 29 percentage points in 2007. 2 A parallel trend was seen for modern contraceptive use with only a 7 percentage point gap in 2007, down from 21 percentage points in 2005.2 Efforts that
3
mortality rate has declined by 50% since the 2005 RDHS, which may put Rwanda within striking distance of the 2015 target. Unfortunately this improved child survival is not uniform across Rwanda. In an equity analysis of childhood illness and mortality, the poorest quintile of households had a 58% higher infant mortality rate, a 60% higher under-five mortality rate, and over 40% higher prevalence of fever, diarrhea and acute respiratory infections compared to the least poor 20% of households.11 Moreover, the rate of severe stunting and severe underweight status among children was twice as high among the poorest compared to the least poor.11 Review of data from repeated DHS in Rwanda confirm this pattern of disparate health outcomes, with wealth quintiles inversely associated with morbidity.12-14 The exception to this trend was reported by Hong et al. who found that wealth was not predictive of childhood mortality in a pooled dataset from four DHS spanning 1992-2007; however, wealth status was grouped in terciles rather than quintiles without stratification by rural residence, which may have masked some of the differences, and the period reviewed included the war years which may also have affected findings.15
Jones and colleagues in 2003, evaluated the potential impact of multiple preventive and curative child survival interventions.16 Based on this work, Bryce and colleagues assessed individual country coverage of eight of these interventions deemed to have “the highest potential impact on child mortality” if universal coverage is achieved.17 For Rwanda, measles and DPT immunization, vitamin A supplementation and use of insecticide-treated bednets were found to be on track in 2007-08; use of a skilled birth attendant and oral rehydration therapy (ORT) were increasingly common but continued to require monitoring; while care-seeking for pneumonia and antimalarial treatment received had achieved less than 30% coverage, well below that needed to reduce mortality rates.14, 17
4
responding to acute needs. The success of facility-based interventions, such as Safe Motherhood Programs or Integrated Management of Childhood Illnesses (IMCI), requires a base level of service use to have a measurable effect.18
Equity in Health and Health Service Use
The overarching intent of the complete set of MDGs is to improve the life circumstances of the poor; however, the health-specific MDGs obscure this focus by monitoring national changes in health status rather than the differential changes for the poorest.19-21 Development of the health-specific MDGs – reduction in child mortality, maternal mortality, and infectious disease incidence – was based on the assumption that public health spending on programs that target “diseases of the poor” will primarily benefit the poor.22 Yet assessments of MDG progress have demonstrated that countries can continue to improve their MDG indicators through
advancements primarily among the wealthier population while notably not improving the health status of the poorest among them.23, 24 In a multi-country analysis of child mortality, Gwatkin and colleagues found that the under-five mortality rate was 70% lower among the wealthiest
compared to the poorest in sub-Saharan Africa.19 Poverty Reduction Strategy Papers required for heavily indebted poor countries to qualify for debt relief from the World Bank and International Monetary Fund are similarly devoid of health strategies that focus exclusively on the poor.25, 26 The World Development Report 2004 found countries failed to adequately allocate health resources to the poor, rather the wealthiest received the largest proportion of benefits.26
5
located in poorer communities are frequently understaffed, poorly equipped, and less well organized, resulting in health services less responsive to the needs of the population.27
Primary maternal and child health services continue to favor the wealthiest in lower and middle income countries. Use of health services and particularly adoption of new health interventions typically follow Rogers Theory of Diffusion of Innovations, with the wealthy adopting services first.28 The “inverse care law” proposed by Tudor-Hart 29 and added to by Victora and colleagues,30 take it a step further advocating that health services benefit those who least need them which exacerbates health inequities between the richest and poorest. Not until the richest have maximized the potential benefit of the intervention, will the benefits trickle down to the poorest among them.30 The poorer among the population often face more limited choices for services, require more education about the value of services, and face other economic priorities that compete for their limited time and resources. Even programs developed specifically to reach the poorest populations, such as oral rehydration therapy, were still more likely to reach those with greater economic resources, albeit in a less pro-rich manner than general health services.31, 32 The Countdown 2015 report found that uniform, simple preventive services with vertical implementation, such as immunizations and treated bednets, were more equitably consumed compared to curative services such as treatment of malaria and diarrhea, and services that required access to 24-hour clinical care such as deliveries.9 Castro-Leal and
colleagues reported similar findings from a multi-country analysis in Africa, where curative care services favor the wealthy compared to preventive care services.33
Wealth has been significantly associated with maternal and child health service
6
delivery, 33.9% difference in use, and antenatal care, 21.1% difference.41 In Rwanda, the use of health services and the adoption of maternal and child health interventions such as modern contraceptives, skilled deliveries, child and adult immunizations, as well as seeking skilled care for childhood illnesses, dropped or remained dangerously low in the years preceding and following the war.42, 43 By 2000, according to Boerma’s analysis, the combined gap in service provision for maternal and child health services was 51.7% and declined slightly to 46.9% in 2005; still almost half of the population was not receiving primary maternal and child health services.41 By 2005, the wealthiest, on average, used health services at a rate 16.3% higher than the poorest. This analysis of DHS data provides evidence of “top inequity” in Rwanda,
essentially evidence of some parallel trends in service use by wealth quintile, except among the very wealthiest who show a sharp increase in service use.41
The inequity in service utilization between the poorest and the less poor highlights the need to develop interventions to reach the poor. Health interventions need to motivate the poor households to seek services or encourage the providers to reach out to those populations.44 Approaches range from targeting the individual to addressing the health infrastructure, and multiple approaches are needed. Moreover, every intervention developed, whether with or without a specific equity focus, should be evaluated for its impact on equity.27 Without continued attention on the equitable distribution and uptake of health services, the poorest will remain at a disadvantage.
Rwanda’s Health Reforms
7
2005, approximately 60% of the total population lived within 5 kilometers of a health facility and 85% lived within 10 kilometers;4 as of 2007, total government spending on health was
approximately $12-14 per person; yet health staffing fell below international standards with many districts supporting only two doctors per 100,000 population.45 A series of health sector reforms were adopted in the mid-2000s to improve provision and access to primary care services,
including decentralization, coordination of donor aid, performance-based financing, and community-based health insurance.
The Government of Rwanda (GoR) adopted of a policy of decentralization in 2005, which was the prelude to substantial changes to the structure and autonomy of the public health sector in Rwanda. The aim of decentralization was to empower local administrative bodies to take on a leadership role in the administration and decision-making for local services, including health, education, and economic activities. In 2006, 30 new administrative districts replaced the former 106 health districts. These new districts were tasked with operations for all development areas and were encouraged to work with communities in a more proactive decision-making role.46 Each new administrative district included at least one district hospital and multiple health centers and health posts that fed referrals to the district hospital.
Meanwhile, the GoR established a financial framework to actively manage and
coordinate the donor funds supporting the health system.47 The GoR determined that it was in the best interest of Rwanda to have a strong, central voice in directing funds towards government-supported health priorities while minimizing duplication when possible.47
8
requiring households to purchase health insurance, largely through a community-based health insurance (CBHI) program, or Mutuelle de Santé. Mutuelles were developed in an effort to mobilize resources locally for health centers and to reduce the financial barriers and risks families faced with unexpected medical costs. Mutuelle benefits are decided by a local health committee and cover a standard set of primary health care services, such as family planning, antenatal care, deliveries, consultations, lab work and generic drugs. Participation requires an enrollment fee and annual premium, with the poorest in the village, as decided by the village committee, eligible for donor subsidies to cover the premiums. By 2006, 73% of the population reported
participation in a Mutuelle.47
The adoption of PBF in Rwanda has been closely watched to determine whether this type of funding strategy can positively impact service use in a lower income country. The evidence for increased use of preventive services is mounting; however, the effects on use of curative care and overall equity in access have not been scrutinized.
Performance-Based Financing
9
the line-item approach, which finances a health facility through the provision of inputs (e.g., drugs, personnel).”51(p.153)
10
on process measures such as immunization coverage rates in Haiti 59 or number of facility deliveries in Cambodia60, while other models explicitly reward quality of care as in the case of Rwanda, Burundi and Egypt.56, 57, 61, 62
Improvements in facility outputs and quality for incentivized services have been reported by numerous projects but few have included appropriately designated control sites that allow for robust comparisons.48, 52, 60, 63 Several evaluations of PBF projects have reported increased productivity, as measured by increased number of facility deliveries, immunizations given, family planning consultations and/or new contraceptive adopters, curative consults, etc.54, 55, 64 Many of these evaluations have design constraints that weaken their findings. First, some of the
evaluations have relied exclusively on health information system data reported by facilities that are incentivized to improve their reporting.57, 59, 60, 63-65 Second, a number of studies examine changes only in PBF sites, with no comparison group or means of controlling for changes in the health environment that may influence uptake of services.57, 64 Lastly, in an effort to tease out the effect of PBF from other concurrent changes, some studies have identified control sites, however, frequently these comparison groups are convenience samples and rarely are the intervention and control site assignments randomized. While there are analytic techniques available to surmount this lack of randomization, none of the studies reviewed employed these, instead trend
comparisons dominate the literature.65, 66 Notable exceptions include the experimental designs employed for the scale-up in PBF in Rwanda61, the comparison of contracting methods in Cambodia60, and the pilot project in Egypt.56
Rwanda was one of the first countries in sub-Saharan Africa to experiment with PBF. From 2002 to 2005, three PBF pilot projects covering approximately 2.6 million people (~32%) were implemented in Rwanda. Known as the Performance Initiative, these projects were
designed to reverse a disturbing trend of decreasing health service utilization. User fees, initially abolished following the war, were reintroduced locally in the late 1990’s to provide some
11
off.63, 67 By 2001, cost-sharing at the local level accounted for 60-80% of a facility’s revenues, placing the lion’s share of the funding on the population.66 Many could not afford the new user fees and use of public health services dropped precipitously.63, 66, 67 The fixed salaries and standard bonus payment system for health providers, meanwhile, provided no financial incentive to maximize productivity or extend the reach of services to the populations in need.63, 67 The Performance Initiative was designed to incentivize providers to increase productivity within the public health system; quality of services was not part of the pilot payment scheme.
Evaluations of Rwanda’s pilot projects’ influence on increased productivity were promising. From 2001 to 2004, Meessen and colleagues reported dramatic increases in facility deliveries, family planning adoption, and tetanus toxoid delivery to pregnant women served by health centers in two pilot districts, Gakoma and Kabutare, compared to far less dramatic changes in health centers outside the pilot districts.67 Corroborating these findings, Rusa and colleagues compared service use before and after pilot implementation and found increased uptake of family planning, facility deliveries, and measles immunization from health centers in contracting
12
used to evaluate changes in service utilization. This was the primary source of data used to calculate incentive payments thus intensive capacity building efforts focused on improving the information systems in the pilot districts, without comparable efforts made in the non-contracting districts. It is not unreasonable to expect that an incentive based on reporting of services
provided will increase the completeness of reporting and, some would argue, the inflation of reporting. Although independent surveys by the School of Public Health in Rwanda did validate the reported data from the intervention sites67, qualitative interviews in one district following national expansion, revealed some evidence of inflated reporting.58
13
effectively designated matched districts as the counterfactual, allowing for comparisons between what did happen in implementation districts and what might have happened in these sites if the program had not been implemented.61
For the impact evaluation, data were collected on use of maternal and child health services from household surveys and client exit interviews in a pre-post evaluation design. Quality of ANC services was measured in the household survey by maternal receipt of tetanus toxoid while assessment of quality at the facility relied on the quality index measure developed per GoR clinical protocols and used to determine payment. Increased input-based funding was provided to the control sites in an effort to determine the impact of incentive-based payments on service productivity and quality compared to a lump sum general budget increase. A difference-in-differences analysis controlling for facility fixed effects as well as individual and household covariates was used to estimate changes in service use attributable to the PBF program. Basinga and Gertler found a compelling 23% increase in use of facility deliveries, and an increase in use of child preventive care visits for both young children (56% for 0-23 month olds) and older children (132% for 24-59 month olds), yet no differences were found in number of ANC visits or in childhood immunization uptake.61 The quality of ANC care provided at intervention sites was found to be significantly higher compared to control sites despite no difference in knowledge and training, supporting the claim that incentives encourage the extra effort needed to provide
comprehensive care.61
Basinga and Gertler posit that incentive-based payments have a positive effect on services most incentivized and where providers exert more control, such as quality of services rendered at a visit, compared to outcomes that require repeat initiative by the client to seek out services, for example multiple ANC visits or childhood immunizations. Per the schedule of output indicators and quality weights, facility deliveries and obstetric referrals are the most highly incentivized services and the quality of prenatal services along with the quality of facility
14
for a one-time delivery and attention to quality for these services can reap large benefits for health centers and providers. Childhood immunizations on the other hand, require repeat visits by the client yet incentives are only awarded for completion of the recommended full schedule rather than for each shot administered. The quality weight for immunizations accounts for less than 10% of the total facility weight and the payment for a completed schedule is less than a
dollar.(Appendix A.1) Family planning services are well incentivized for new adopters ($1.83) and account for 11% of the quality score, however evaluations have shown mixed results for use and no assessment of quality.62, 63, 67 Curative care visits have low per-visit incentives ($0.18) yet the quality score for curative care accounts for 17% of the overall weight. Again, results for increased curative care visits are mixed, and the quality of these services have not been independently evaluated.63, 67
Basinga and Gertler argue that supply-side incentives can positively impact quality of services and additionally increase use of services if strongly incentivized and within the control of the provider. Understanding the effects of PBF on less incentivized services both the quality and the use, will better inform adjustments to the strategy as Rwanda moves forward.
Advocates hail PBF as a potential reform strategy that may profoundly influence the provision of health care through greater local provider autonomy under strong national oversight, 51 praise it as a flexible financing strategy that is responsive to country context and evolving health priorities, 69, 70 and promote it as an effective strategy for increasing service use. 36, 59, 61 Critics on the other hand, raise concerns regarding the limited empirical evidence for PBF, specifically the effect on equity of service use, on health outcomes not just service outputs, on the potential adverse effects for non-incentivized services, and on the long term impact and
Chapter 2
Research Aims and Methods
The PBF program implemented in Rwanda was designed to increase provider output thereby increasing health service utilization particularly for maternal and child primary health care. This study examines the question of whether a PBF program can help close the equity gap in use of maternal and child health services when there are no specific provisions to target the poorest in the population.
This proposed work builds on a prior impact evaluation work for PBF in the following ways. First, the intent of PBF in Rwanda is to increase provider output thereby increasing health service utilization for maternal and child services; however, historical use of services has been
16
can incorporate to improve their model and countries looking to replicate Rwanda’s model can benefit as well.
Aims and Hypotheses
This evaluation seeks to determine whether the Rwanda’s PBF program differentially influenced the use of select, preventive and curative health care services among the poorest women and children. The following specific aims are addressed:
Aim 1: To determine whether the effect of PBF on the use of maternal health services in Rwanda varies by household wealth status.
Hypothesis 1A. The probability of receiving an adequate number of ANC visits and early ANC
visits increased more from 2005 to 2007 among the poorest women living in districts
financed through PBF compared to the least poor women living in PBF districts and relative
to women living in control districts.
Hypothesis 1B. The probability of delivering in a health facility increased more from 2005 to
2007 among the poorest women living in districts financed through PBF compared to the
least poor women living in PBF districts and relative to women living in control districts.
Hypothesis 1C. The probability of adopting modern contraception increased more from 2005 to
2007 among the poorest women living in districts financed through PBF compared to the
least poor women living in PBF districts and relative to women living in control districts.
17
Hypothesis 2A. The probability of a child sick with diarrhea, fever, and/or symptoms of acute
respiratory infection (ARI) is negatively associated with the adoption of PBF by the district.
Hypothesis 2B. The probability of reported illness with diarrhea, fever, and/or symptoms of ARI
decreased more from 2005 to 2007 among the poorest children living in districts financed
through PBF compared to the least poor children living in PBF districts and relative to
children living in control districts.
Hypothesis 2C. The probability of a child sick with diarrhea, fever, and/or symptoms of ARI
receiving consultation from a health facility is positively associated with the adoption of PBF
by the district.
Hypothesis 2D. The probability of seeking consultation from a health facility when sick with
diarrhea, fever, and/or symptoms of ARI increased more from 2005 to 2007 among the
poorest children living in districts financed through PBF compared to the least poor children
living in PBF districts and relative to children living in control districts.
Hypothesis 2E. Among those children reporting diarrhea or fever who received care from a
health facility, the probability of receipt of ORT or antibiotics for diarrhea or a fever reducer
or anti-malarial medication for fever, is positively associated with the adoption of PBF by the
district.
Conceptual Framework
Andersen’s Behavioral Model of Health Services Use was first developed in 1968 to explain the use of formal health care services.76 The intent was to provide a theoretical framework for understanding the use of and access to services in order to assist with the
18
characteristics, enabling factors, and needfor services contribute to one’s decision to seek health care. In 1995, Andersen unveiled the fourth iteration of this model which expanded to include consideration of the environmental context as well as the outcomes of service utilization, including health outcomes and service use experiences, that may influence decisions for subsequent service use.76 The conceptual model (Figure 2.1) illustrates Andersen’s Behavioral Model of Health Services Use populated with variables of interest for preventive and curative care seeking in Rwanda. For the purposes of this study, the analyses focused on the predisposing characteristics, enabling factors, and need that lead to use of health services, with some
consideration of prior health service utilization.
Predisposing characteristics are those individual and household factors that might predispose one’s need for health services and the use of those services. These are the factors that might influence someone’s desire to seek care. Numerous studies have identified
socio-demographic predictors for maternal and child health service utilization, including age, education, marital status, and parity/birth order.
Enabling factors are those characteristics at the household or community level that may facilitate or impede one’s use of services. Typical considerations include financial and
geographic access to services, such as family economic status, health insurance, rural or urban residence, and distance to health facilities. By 2007, over 85% of the DHS surveyed population lived within 5 kilometers of a facility and 100% lived with 10 kilometers, hence geographic access is assumed to be adequate.
19
limit pregnancies. Preventive childhood services such as immunizations and Vitamin A supplementation are also recommended for the entire population. Need for curative care from a health facility is harder to estimate. First the need is conditional on a disease event, which as mentioned above is more likely among the poorer populations and the severity may be more likely among the poor as well due to inadequate initial response. Second, the perception of severity for the parent may be hard to measure and for the researcher impossible to determine on an individual basis. However at a population level, the operating assumption is that most of the children whose parents remember an illness were likely sick enough to warrant medical
consultation and/or treatment.
Figure 2.1. Conceptual Model
Illness Performance
Based Financing
ANC Visits – 1st Trimester, ANC - 4 visits Facility Delivery Use Modern
Contraception Consultations for
illness Treatment for
illness
Improved Health
Birth Planning Healthy
Delivery Healthy
Children Quality
Services Satisfaction
with services
Individual & Household
Age Education Marital Status Parity
Household & Community
HEALTH BEHAVIOR
Wealth
Health Insurance Residence Geographic
Access ENVIRONMENT Health Facility POPULATION CHARACTERISTICS Preventive Care Needs
ANC
Facility Delivery Family Planning
Curative Care Needs
OUTCOMES
Use of Health Services Predisposing Characteristic s Enabling Factors Health Care System
National Health Strategy Community
Control
Need
21 Study Setting and Design
The Republic of Rwanda, “Land of a Thousand Hills”, is nestled in the highlands of the Great Lake region in eastern Africa. This small, landlocked country is home to approximately 11.4 million people, making it the most densely populated country in Africa.87 Nineteen percent of the population lives in urban centers, with close to one million in the capital Kigali. The economy is driven equally by agriculture and services with each comprising approximately 42% of the Gross Domestic Product; the additional 14% is supplied by industry.87 The vast majority (90%) of the population is engaged in subsistence farming, with some mining and agribusiness.87
The formal health sector in Rwanda is comprised of public health facilities, government-assisted health facilities or agréés, private health facilities and traditional healers. Agréés are private non-profit and faith-based health facilities that work within the public health system and have agreed to support the national health policies and abide by the protocols in place for the public facilities. In 2005, the combined number of public and agréés facilities was 385 health centers, 34 district hospitals and 4 national referral hospitals.4 The private sector increased to more than 300 dispensaries and clinics, with over 50% of those located in and around Kigali.4 The public sector health system provides a tiered system of facilities with health centers providing the primary point of access for comprehensive preventive and curative care. Health posts and dispensaries are one tier down, typically located in more remote areas and serving a smaller population with a minimum basic package of services. Hospitals are most typically a district referral resource with expanded capabilities for treatment and rehabilitation. There is at least one district hospital per administrative district while the four national hospitals serve as referral hospitals for the districts, providing more highly trained providers and specialized services.
22
insurance and increasing government expenditures on health; increasing human resources and geographic access for public health through infrastructure building, transportation support, PBF and training; and improving select maternal and child health outcomes through increased uptake of modern contraception, ANC and delivery care, as well as expanding the program for integrated management of childhood illnesses.4
In 2005, the government adopted a national performance-based financing (PBF) program for health centers and hospitals. PBF was designed to incentivize health facility personnel to increase health service productivity and improve service quality through special contracting at the facility-level. This supply-side incentive theoretically motivates providers and facilities to attract and maintain a client base in need of health services. Productivity is explicitly incentivized through a payment per health service provided, for example growth monitoring visits, facility deliveries, or tetanus toxoid immunizations. In Rwanda, the 14 incentivized services cover evidence-based primary maternal and child health services, both preventive and curative care (Appendix A.1; see Rusa62 and Basinga61 for details). In addition, service quality is assessed in a quarterly site visit and the quality score is used to weight the overall PBF payment, such that facilities receive a portion only of the performance payment if the quality score is not perfect. This contracting mechanism empowers providers, facilities, and the local health authorities to distribute these supplemental funds according to local priorities; typically provider bonuses as well as facility supplies and equipment, or local outreach efforts.
23
implementers or control districts. National household survey data, collected independently from the randomized intervention, provide pre- and post-implementation measures for select child health outcomes.
2001-2004 2005 2006 2007 2008 2009
Figure 2.2. Timeline of PBF implementation and DHS data collection in Rwanda
Data
Demographic and Health Surveys
Data from the 2005 Rwanda Demographic and Health Survey (RDHS) and the 2007-2008 Rwanda Interim Demographic and Health Survey (RIDHS) provide individual and
household socio-demographic characteristics and health indicators for maternal and child health, including ANC, birthing practices, family planning, immunizations, childhood illness, care seeking, and treatment received.
The 2005 RDHS employed a two-stage national sampling design to produce a sample representative of the 12 former provinces and stratified by rural and urban residence. Primary sampling units (PSUs) or clusters were selected from the 2002 General Population and Housing Census enumeration areas based on a probability proportional to the number of households within the enumeration area. Twenty households per urban cluster (111 clusters) and 24 households per rural cluster (351 clusters) were randomly selected. Within each participating household, one household survey was completed plus all women 15-49 years of age who were usual residents of
Cyangugu Pilot
Butare Pilot
Kigali Pilot
National Scale-up:
Phase 1 Jan06-Nov07
National Scale-up: Phase 2 began
Apr 2008
RDHS 2005: Feb-Jul05
RIDHS 2007-08: Dec07-Apr08 Redistricting
24
the house or who slept in the house the previous evening were eligible for interviews. In total, 462 clusters were sampled, 10,272 households completed interviews (99.7% response rate), 11,321 women completed interviews (98.1% response rate), and data on 8,715 live births during the preceding five years and 8,649 children under the age of five was provided.13 Individual sampling weights are included in the dataset to ensure that the sample is nationally
representative.13
The 2007-2008 RIDHS selected 250 of the clusters that were sampled in the 2005 RDHS. These 250 clusters were sampled with probability proportional to size, and representative at the national and provincial level, both the former 12 provinces and subsequently the new 5 provinces formed in 2006. To assure reliable estimates for the urban areas and robust estimates for
indicators at the provincial level, urban clusters were slightly over-sampled and 30 households were randomly selected from all clusters. One cluster was excluded from the surveying when it was found to be a refugee camp. In total, 249 clusters were sampled, 7,377 households
completed interviews (99.5% response rate), 7,313 women completed interviews (97.1% response rate) and data on 5,656 live births in the preceding five years and 5,489 children under the age of five was provided. Individual sampling weights are included in the dataset to ensure that the sample is nationally representative.14
Geographic coordinates were available for 246 of the clusters, facilitating the creation of a panel dataset of matched clusters from 2005 and 2007. Eleven pilot districts, including the three districts surrounding Kigali, were excluded from the analysis, eliminating 96 clusters. Longitudinal data from a total of 150 clusters were thus used in the analysis, with 86 clusters from the 12 intervention districts and 64 from the 7 control districts. Details on the study sample of women and children for each analysis are presented in chapters 3 and 4, respectively.
25
program implementation at the district level; b) the close match between district boundaries and facility catchment areas post-decentralization; and c) the timing of the two DHS, book-ending the implementation for intervention districts.
Health Facility Data
The Ministry of Health hosts a database of public health facilities on their website, with geographic location (GPS coordinates) for health centers and hospitals. Figure 2.3 shows the phased implementation of the PBF program, the health facilities and DHS clusters. At baseline, there were 79 facilities located in intervention districts and 86 facilities in control districts.46
26 Statistical Approach
The approach described below applies to the analyses for maternal and child health service use. Details specific to each analysis are included in chapters 3 and 4 respectively.
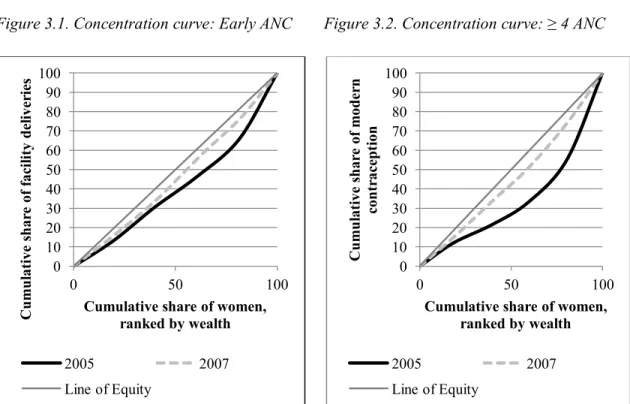
Bivariate descriptive analyses of baseline population characteristics and for each outcome variable by year and wealth quintile were completed. Concentration curves plotting the
cumulative outcome variables by the cumulative percentage of women ranked by wealth were created to graphically illustrate inequity in service use by wealth status. 88 Concentration curves were also created for child use of services but were not very revealing, hence they are not presented.
A difference-in-differences (DD) estimation strategy was used to evaluate the impact of PBF on the use of primary health services. The DD estimator calculates the change in mean outcome (Y) for the intervention and control groups over time and takes the difference between the groups to determine the effect of PBF, written as:
Equation (1): .
A linear probability model (LPM) was run for each outcome, with cluster-robust standard errors and individual, maternal, and household covariates included to reduce residual variance and improve the efficiency of the estimates. Community fixed effects were subsequently included to control for time-invariant unobserved community differences. The DD with community fixed effects specification is written as:
27
where subscripted indexes are defined as i=individual, j=community or cluster, and t=time. Terms in the model include the vector of covariates (X),a dummy variable for time period 2007/08 (Y07=1 for post-implementation), and a dummy program variable for clusters located in districts with performance-based financing (PBF=1 for intervention district, 0 for control). The primary coefficient of interest is β3, which captures the effect of the PBF program on the outcomes Y. By subtracting the differences over time between program areas, the unobserved time-invariant community fixed effects (µj) will be differenced out. Unobserved time-varying community variables (µjt) are excluded from the model because community characteristics are unlikely to change dramatically during the short 2-3 year interval, any changes are likely to be minor, and the fixed community differences are already differenced out. Individual unobserved time-invariant fixed effects (µi) are also excluded because any potential bias due to omitted variables might arise at the community level where the program intervention was assigned, rather than the individual level.
Interaction terms between wealth quintiles and the PBF intervention were then estimated to identify the differential effect of PBF among women and children from poorer families. The model specification shown below is written with only one set of wealth interaction terms to illustrate the inclusion of the interactions.
Equation (3):
28
the least poor, Wealth5, served as the referent group. The primary coefficient of interest (β7), is for the triple interaction which captures the effect of the PBF program on the probability of the outcome among women/children from the poorest households compared to the probability of the outcome among women/children from the least poor households, relative to women/children living in control districts. Interaction terms between insurance status and PBF residence, and insurance with wealth quintiles were also tested.
Additionally for the woman’s analysis, the models were stratified by residence to identify any difference in program effect in rural versus urban settings that were not revealed in the full model when residence was differenced out by the community fixed effects specification. However due to the minimal number of urban clusters (n=22) and the allowance for intracluster correlation, correct cluster-robust standard errors will not be produced with more than 21
variables in the model. Hence the number of covariates was restricted for the stratified models to those considered most influential as noted in the results.
For the child analysis, marginal effects for each population group of interest –
intervention group, control group, poorest in intervention, wealthiest in intervention, etc – were calculated to illustrate the changes in the selected outcomes over time by group. Stratification by residence was not possible due to the smaller sample.
Chapter 3
Are Maternal Health Services Reaching the Poorest Women?
The aim of this analysis is to examine the effects of PBF on equity in maternal health service use. Specifically, in the absence of provisions targeting the poor, does PBF increase health service use differentially among the poorest women?
Study Sample
The panel dataset of 150 clusters included 7,899 women 15-49 years of age who lived in either an intervention (4,477) or control district (3,422); 3,611 women from the 2005 data and 4,288 from 2007. Three pregnancy-related outcomes were studied: early initiation of ANC, four or more ANC visits during pregnancy, and delivery in a health facility. The window of analysis for these outcomes was limited to deliveries in the previous 18 months to isolate the effects of PBF. The final dataset for pregnancy-related outcomes included 2,044 women; 1,170 from intervention districts and 874 from control districts. The fourth outcome studied was use of modern contraceptives among married women. This final dataset included 4,121 currently married woman; 2,328 from intervention districts and 1,793 from control districts.
Measures
30
receiving prenatal care from a trained medical provider in a public or private health facility. WHO recommends four or more ANC visits and early initiation of care, defined as any visit before the 4th month of pregnancy.89 Facility deliveries include delivery in any public or private health facility, and are promoted worldwide as a key strategy to reduce maternal mortality. Modern contraception was limited to pills, injectables, implants, or IUDs, as these methods were specifically promoted under PBF. Each of these outcomes is incentivized through PBF, although the payment rate varies by service, with the highest monetary incentive for a facility delivery.
The key independent variables are residence in a PBF intervention or control district and household wealth. Assignment to a PBF intervention district was based on the district in which the survey cluster was located; hence all women from the same cluster were assigned the same PBF status. Household wealth scores based on asset ownership and housing characteristics were created separately for the 2005 and 2007 study samples. Polychoric principal component analysis (PCA) was used to calculate a wealth score that maximized the contribution of binary and
categorical variables.90 The choice of assets for the wealth score was based on the economic context in Rwanda and data availability. Assets for 2005 included television, radio, telephone, bicycle, and land ownership; housing characteristics included electricity, drinking water, toilet facility, cooking fuel, and flooring material. Three assets were excluded due to perfect prediction with other assets: refrigerator, motorcycle, and car. For 2007, land ownership data was not collected, car and motorcycle ownership were combined as a single variable, and refrigerator was excluded, again for reasons of perfect prediction. The first component of the polychoric PCA was used to create the wealth index score, explaining 59% of the variance for 2005 and 57% for 2007. Households were divided into quintiles based on their wealth index score; the new wealth quintile was assigned to each woman living in the household.
31
included, and for the modern contraception outcome, history of a previous child death in the family was included.
Results
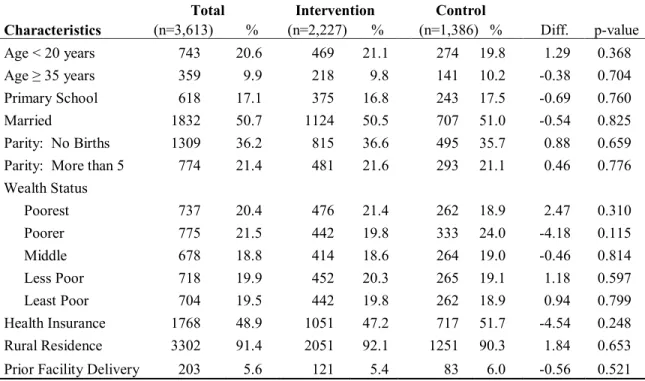
Comparison of the intervention and control study populations at baseline indicates that the random assignment of districts to intervention phase created comparable populations with no significant differences (Table 3.1).
Table 3.1 Woman and household characteristics by intervention and control samples at baseline, 2005 RDHS weighted data
Total Intervention Control
Characteristics (n=3,613) % (n=2,227) % (n=1,386) % Diff. p-value
Age < 20 years 743 20.6 469 21.1 274 19.8 1.29 0.368 Age ≥ 35 years 359 9.9 218 9.8 141 10.2 -0.38 0.704 Primary School 618 17.1 375 16.8 243 17.5 -0.69 0.760 Married 1832 50.7 1124 50.5 707 51.0 -0.54 0.825 Parity: No Births 1309 36.2 815 36.6 495 35.7 0.88 0.659 Parity: More than 5 774 21.4 481 21.6 293 21.1 0.46 0.776 Wealth Status
Poorest 737 20.4 476 21.4 262 18.9 2.47 0.310 Poorer 775 21.5 442 19.8 333 24.0 -4.18 0.115 Middle 678 18.8 414 18.6 264 19.0 -0.46 0.814 Less Poor 718 19.9 452 20.3 265 19.1 1.18 0.597 Least Poor 704 19.5 442 19.8 262 18.9 0.94 0.799 Health Insurance 1768 48.9 1051 47.2 717 51.7 -4.54 0.248 Rural Residence 3302 91.4 2051 92.1 1251 90.3 1.84 0.653 Prior Facility Delivery 203 5.6 121 5.4 83 6.0 -0.56 0.521
32
in the population. The equity gap in 2005 is most evident for use of modern contraception, with 60% of the poorest women reporting less than 40% of the share of modern contraceptive use (Figure 3.4). Likewise facility deliveries were more often reported among the wealthier in 2005 (Figure 3.3). By 2007, the gap in equity for all four outcomes decreased.
Figure 3.1. Concentration curve: Early ANC Figure 3.2. Concentration curve: ≥ 4 ANC
Figure 3.3. Concentration curve:Facility Birth Figure 3.4. Concentration curve: Contraception 0 10 20 30 40 50 60 70 80 90 100
0 50 100
Cum u lat ive sh ar e of e ar ly AN C vis it s
Cumulative share of women, ranked by wealth
2005 2007 Line of Equity
0 10 20 30 40 50 60 70 80 90 100
0 50 100
Cum u lat ive sh ar e of 4 or m or e AN C vis it s
Cumulative share of women, ranked by wealth
2005 2007 Line of Equity
0 10 20 30 40 50 60 70 80 90 100
0 50 100
Cum u lat ive sh ar e of f ac ilit y d el iver ies
Cumulative share of women, ranked by wealth
2005 2007 Line of Equity
0 10 20 30 40 50 60 70 80 90 100
0 50 100
Cum u lat ive sh ar e of m od er n con tr ac ep tion
Cumulative share of women, ranked by wealth
33
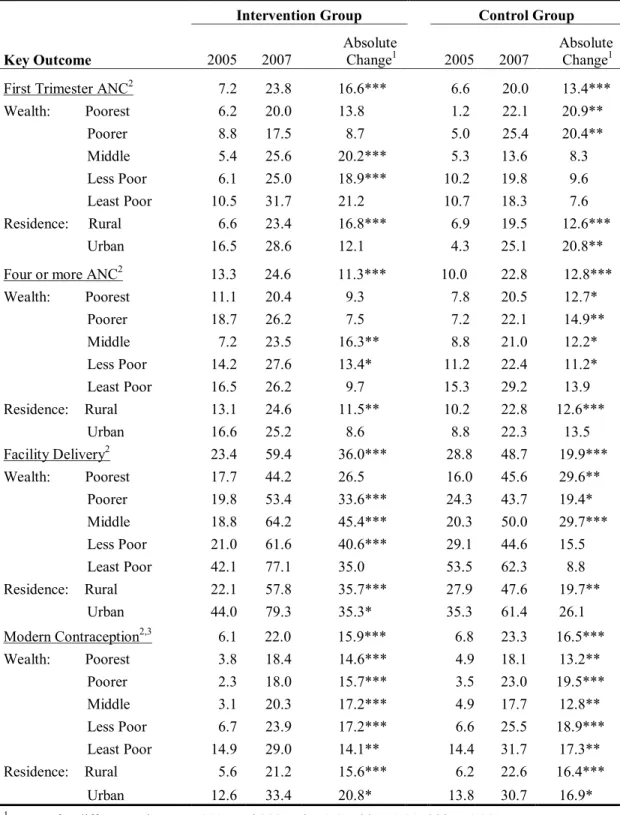
The absolute change in service use improved from 2005 to 2007 for all four outcomes (Table 3.2). The most dramatic improvements were measured for facility deliveries among the intervention and control groups, 36.0 and 19.9 percentage-point changes respectively. For ANC visits and contraceptive use, average service use improved approximately 14 percentage points from 2005 to 2007.
Looking at disparities, the inequity of facility deliveries seen in 2005 between the least poor 20% of the population compared to the poorer 80% of the population is substantial for the intervention and control groups. By 2007, improved use by the middle income groups narrowed this gap in facility deliveries. A similar pattern is seen for modern contraceptive use in 2005 where use doubles among the least poor quintile compared to the poorer 80%. This disparity by wealth is much less evident for early ANC initiation and nearly non-existent for meeting the recommended number of ANC visits.
Modern contraceptive use was twice as high among urban versus rural residents in 2005, a pattern seen also for facility deliveries. In absolute terms, the improvements between 2005 and 2007 for urban and rural residents were similar for modern contraceptives and facility deliveries. By 2007, approximately one-quarter of the women reported early ANC and adequate number of ANC visits, with no clear differences between rural and urban communities.
Comparisons of absolute changes between PBF intervention and control groups between 2005 and 2007 suggest that PBF may have positively influenced the increased use of facility deliveries. However, no consistent patterns of higher service use are evident for intervention versus control populations for ANC visits or modern contraceptive use. Further analyses using econometric techniques provides an opportunity to control for unmeasured influences or
34
Table 3.2. Percent of women reporting key outcomes by study sample and year
Intervention Group Control Group
Key Outcome 2005 2007 Absolute Change1 2005 2007 Absolute Change1
First Trimester ANC2 7.2 23.8 16.6*** 6.6 20.0 13.4***
Wealth: Poorest 6.2 20.0 13.8 1.2 22.1 20.9** Poorer 8.8 17.5 8.7 5.0 25.4 20.4** Middle 5.4 25.6 20.2*** 5.3 13.6 8.3 Less Poor 6.1 25.0 18.9*** 10.2 19.8 9.6 Least Poor 10.5 31.7 21.2 10.7 18.3 7.6 Residence: Rural 6.6 23.4 16.8*** 6.9 19.5 12.6***
Urban 16.5 28.6 12.1 4.3 25.1 20.8** Four or more ANC2 13.3 24.6 11.3*** 10.0 22.8 12.8***
Wealth: Poorest 11.1 20.4 9.3 7.8 20.5 12.7* Poorer 18.7 26.2 7.5 7.2 22.1 14.9** Middle 7.2 23.5 16.3** 8.8 21.0 12.2* Less Poor 14.2 27.6 13.4* 11.2 22.4 11.2* Least Poor 16.5 26.2 9.7 15.3 29.2 13.9 Residence: Rural 13.1 24.6 11.5** 10.2 22.8 12.6***
Urban 16.6 25.2 8.6 8.8 22.3 13.5 Facility Delivery2 23.4 59.4 36.0*** 28.8 48.7 19.9***
Wealth: Poorest 17.7 44.2 26.5 16.0 45.6 29.6** Poorer 19.8 53.4 33.6*** 24.3 43.7 19.4* Middle 18.8 64.2 45.4*** 20.3 50.0 29.7*** Less Poor 21.0 61.6 40.6*** 29.1 44.6 15.5 Least Poor 42.1 77.1 35.0 53.5 62.3 8.8 Residence: Rural 22.1 57.8 35.7*** 27.9 47.6 19.7**
Urban 44.0 79.3 35.3* 35.3 61.4 26.1 Modern Contraception2,3 6.1 22.0 15.9*** 6.8 23.3 16.5*** Wealth: Poorest 3.8 18.4 14.6*** 4.9 18.1 13.2**
Poorer 2.3 18.0 15.7*** 3.5 23.0 19.5*** Middle 3.1 20.3 17.2*** 4.9 17.7 12.8** Less Poor 6.7 23.9 17.2*** 6.6 25.5 18.9*** Least Poor 14.9 29.0 14.1** 14.4 31.7 17.3** Residence: Rural 5.6 21.2 15.6*** 6.2 22.6 16.4***
Urban 12.6 33.4 20.8* 13.8 30.7 16.9*
1 T-tests for differences between 2005 and 2007. *p<0.05, ** p<0.01, *** p<0.001
2 No statistical differences found between intervention and control groups at baseline.
35
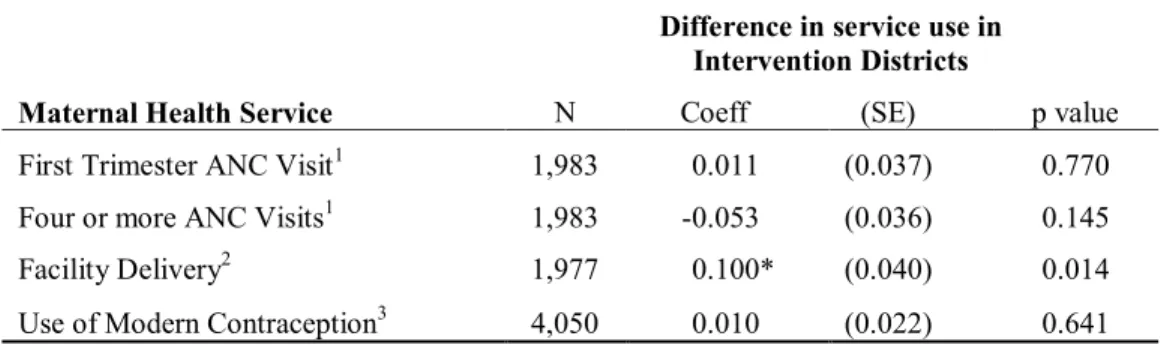
Results from the LPM were used to obtain the difference-in-differences estimator for the effect of PBF on maternal health services (Table 3.3). The probability of a facility delivery increased by 10.0 percentage points in the intervention districts compared to the control districts (p=0.014), while no significant effects were noted for ANC visits or modern contraceptive use.
Table 3.3. Estimated effects of performance-based financing on service use (difference-in-differences estimate)
Difference in service use in
Intervention Districts
Maternal Health Service N Coeff (SE) p value
First Trimester ANC Visit1 1,983 0.011 (0.037) 0.770 Four or more ANC Visits1 1,983 -0.053 (0.036) 0.145 Facility Delivery2 1,977 0.100* (0.040) 0.014
Use of Modern Contraception3 4,050 0.010 (0.022) 0.641 1 Covariates include wealth, age, education, marital status, parity, insurance, and prior
facility birth within past five years.
2 Covariates include wealth, age, education, marital status, parity, insurance, any ANC visits,
and prior facility birth within past five years.
3 Modern contraception includes pill, injectable, implant and IUD. Covariates include
wealth, age, education, marital status, parity, insurance, previous child death, and prior facility birth within past five years.
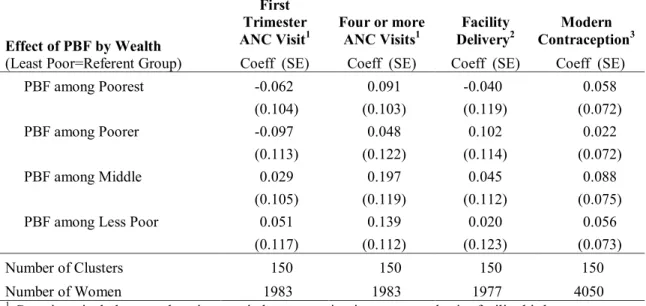
36
wealth quintiles, although the results are not significant. No clear patterns emerge for either early ANC initiation or modern contraceptive use by wealth group.
Table 3.4. Estimated differential effects of performance-based financing by wealth on service use (difference-in-differences estimate with wealth interaction terms)
Effect of PBF by Wealth (Least Poor=Referent Group)
First Trimester
ANC Visit1 Four or more ANC Visits1 DeliveryFacility 2 ContraceptionModern 3 Coeff (SE) Coeff (SE) Coeff (SE) Coeff (SE) PBF among Poorest -0.062 0.091 -0.040 0.058
(0.104) (0.103) (0.119) (0.072) PBF among Poorer -0.097 0.048 0.102 0.022
(0.113) (0.122) (0.114) (0.072) PBF among Middle 0.029 0.197 0.045 0.088
(0.105) (0.119) (0.112) (0.075) PBF among Less Poor 0.051 0.139 0.020 0.056
(0.117) (0.112) (0.123) (0.073)
Number of Clusters 150 150 150 150 Number of Women 1983 1983 1977 4050
1 Covariates include age, education, marital status, parity, insurance, and prior facility birth
2 Covariates include age, education, marital status, parity, insurance, prior facility births and ANC visits
3 Modern contraception includes pill, injectable, implant and IUD. Covariates include age, education,
marital status, parity, insurance, prior facility birth and previous child death
37
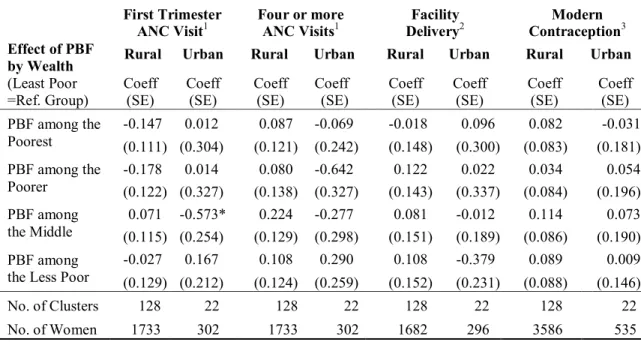
Table 3.5. Estimated differential effects of performance-based financing by wealth on service use, stratified by residence (difference-in-differences estimate with wealth interaction terms)
First Trimester ANC Visit1 Four or more ANC Visits1 DeliveryFacility 2 ContraceptionModern 3 Effect of PBF
by Wealth (Least Poor =Ref. Group)
Rural Urban Rural Urban Rural Urban Rural Urban
Coeff
(SE) Coeff (SE) Coeff (SE) Coeff (SE) Coeff (SE) Coeff (SE) Coeff (SE) Coeff (SE) PBF among the
Poorest
-0.147 0.012 0.087 -0.069 -0.018 0.096 0.082 -0.031 (0.111) (0.304) (0.121) (0.242) (0.148) (0.300) (0.083) (0.181) PBF among the
Poorer -0.178 (0.122) (0.327) 0.014 (0.138) (0.327) 0.080 -0.642 (0.143) 0.122 (0.337) 0.022 (0.084) 0.034 (0.196) 0.054 PBF among
the Middle (0.115) (0.254) 0.071 -0.573* (0.129) (0.298) 0.224 -0.277 (0.151) 0.081 -0.012 (0.189) (0.086) 0.114 (0.190) 0.073 PBF among
the Less Poor -0.027 (0.129) (0.212) 0.167 (0.124) (0.259) 0.108 0.290 (0.152) 0.108 -0.379 (0.231) (0.088) 0.089 (0.146) 0.009
No. of Clusters 128 22 128 22 128 22 128 22 No. of Women 1733 302 1733 302 1682 296 3586 535 * p<0.10, **p<0.05
1 Covariates limited to marital status, parity, and insurance.
2 Covariates limited to parity, prior facility birth and any ANC visits.
3 Modern contraception includes pill, injectable, implant and IUD. Covariates limited to parity.
Discussion and Limitations
To combat the pervasive low use of maternal health services in Rwanda in the early 2000s, the Government of Rwanda promoted both supply-side and demand-side financing strategies. Performance-based financing was scaled up nationally to increase the supply of health services through an incentive program for providers and health facilities. Meanwhile, community based health insurance rapidly increased to reduce financial barriers for consumers. Supporters for PBF recognized that increasing and improving service performance was not solely an issue of lack of provider knowledge or skills, 91 rather the government needed to target multiple facets of provider motivation to increase service output. Serneels and Lievens propose four institutional factors that influence health worker performance in Rwanda: incentives, monitoring
38
Indirectly, PBF may improve the professional norms or culture of a facility as colleagues begin to work together towards higher outputs and subsequently intrinsic motivations may improve as one takes pride in the improved performance of the facility. Basinga and colleagues found that the monetary incentives of PBF did increase the percentage of facility deliveries and the quality of ANC services provided in intervention sites, after controlling for the increase in absolute health expenditures (approximately 22%).61 Our analysis confirmed some of these findings with national data collected independently of the intervention. In 2007, women living in intervention districts were 10.0 percentage points more likely to deliver in a health facility compared to women in control districts, a 42.7% increase in facility deliveries attributable to PBF.
This study took a step further and looked at whether PBF was an effective pro-poor strategy, increasing the use of maternal services among the poorest women in the population. No evidence was found that PBF is pro-poor in Rwanda, likewise we found no evidence that PBF is pro-rich. The increase in facility deliveries was seen across all wealth groups ranging from 26-45 percentage point increases among the intervention group compared to 8-30 percentage point increases among the controls (Table 3.2), yet interaction terms between wealth, year and PBF program found no differential effect of the program by wealth quintile. While the equity gap in service use for facility deliveries and modern contraceptive use decreased from 2005 to 2007; we cannot conclude that PBF was responsible for these improvements.
39
perceived need; provider bonuses, equipment replacement, and community outreach efforts all were options exercised by local leaders. Anecdotally we know that some facilities adopted outreach strategies to encourage facility use by women from poorer households, including
waiving or reducing fees, offering transportation, and enlisting community health workers to refer women for services. However there were no specific provisions in the PBF incentive structure or the program placement that differentially targeted poorer households or communities; rather the program was rolled out uniformly to serve all Rwandans.
Given the widespread disparities in health service use between the least poor and poorest populations in sub-Saharan African, a fair question is why the Government of Rwanda did not design a PBF program that explicitly targeted poorer households. Following the war and
genocide in Rwanda, maternal health indicators and service utilization was poor across the board. Estimated maternal mortality was very high, 1,071 deaths per 100,000 live births from 1994-2000.93 Less than one third of deliveries were assisted by a trained birth attendant and only 27% reported delivery in a health facility. While over 90% of women reported at least one ANC visit during pregnancy, only 10% reported receiving the recommended four or more visits, and only 4% of married women reported modern contraceptive use, down from 13% in 1992, resulting in a 36% estimated unmet need for family planning in Rwanda. With such low service statistics in 2000, a national approach to improve services for everyone was warranted; particularly, one could argue, if levels of use among the poorest might continue to lag as long as the wealthiest were not achieving high levels of use.94