Validation of a Metallomics Analysis of Placenta Tissue by
Inductively-Coupled Plasma Mass Spectrometry
James M. Harrington1, Daniel J. Young1, Rebecca C. Fry2, Frank X. Weber1, Susan S. Sumner3, and Keith E. Levine1,*
1Trace Inorganics Department, Technologies for Industry and the Environment, RTI International,
Durham, NC 27709
2Gillings School of Global Public Health, University of North Carolina, Chapel Hill, NC 27599
3Discovery Science Technology, RTI International, Research Triangle Park, NC, 27709
Abstract
Trace elements can play an important role in maternal health and fetal development, and deficiencies in some essential minerals including zinc and copper have been correlated in some individuals to the development of birth defects and adverse health outcomes later in life. The exact etiology of conditions like preeclampsia and the effects of fetal exposure to toxic metals has not been determined, making the assessment of trace element levels crucial to the elucidation of the causes of conditions like preeclampsia. Previous studies analyzing serum and placenta tissue have produced conflicting findings, suggesting the need for a robust, validated sample preparation and analysis method for the determination of trace elements in placenta. In this report, an acid digestion method and analysis by ICP-MS for a broad metallomics/mineralomics panel of trace elements is developed and validated over three experimental days for inter- and intraday precision and accuracy, linear range, matrix impact, and dilution verification. Spike recovery experiments were performed for the essential elements chromium (Cr), iron (Fe), cobalt (Co), nickel (Ni), copper (Cu), and zinc (Zn), and the toxic elements arsenic (As), cadmium (Cd), and lead (Pb) at levels equal to and in excess of native concentrations in control placenta tissue. The validated method will be essential for the development of scientific studies of maternal health and toxic metal exposure effects in childhood.
Introduction
Trace elements play a role in a variety of biological processes in humans ranging from the transport of small molecules to the catalysis of redox reactions in cells.[1] While dietary intake of essential minerals is a requirement to sustain these biological processes, a variety of factors can result in improper absorption or utilization of the metals. This deficiency can
*Corresponding author: [email protected].
Ethical statement
This manuscript does not contain samples that were obtained from clinical studies and no personally identifiable patient data is
HHS Public Access
Author manuscript
Biol Trace Elem Res. Author manuscript; available in PMC 2016 February 23.
Published in final edited form as:
Biol Trace Elem Res. 2016 February ; 169(2): 164–173. doi:10.1007/s12011-015-0431-3.
Author Manuscript
Author Manuscript
Author Manuscript
result in adverse health effects to the individual, and these health effects can become doubly threatening when the individual is pregnant. In the same way, an exposure to an excess of an essential mineral or to a toxic metal can result in illnesses resulting from toxicity. For example, an excess of iron such as in hemochromatosis or excessive iron supplementation can result in increased cellular oxidative damage.[2]
Previous studies of health outcomes such as preeclampsia, low birth weight, intra-uterine growth restriction (IUGR), and childhood neurological effects in the fetus have focused on the analysis of serum and plasma from the mother, but the placenta has a more direct role in the development and sustenance of the fetus and can be viewed as a biological indicator of exposure of the fetus to toxic compounds before birth. Placenta tissue has previously been used as a matrix for studying fetal exposure to contaminants including toxic metals and for relation to the development of diseases.[3–5] The results of these investigations have provided conflicting findings regarding correlations between exposure and toxic metal concentrations in placenta tissue.
One potential explanation for the inconsistent findings of studies of trace metals in placenta may arise from the analytical method used to monitor the elemental concentrations. Inconsistent analytical methods between studies can result in variability in elemental concentrations, especially for trace elements that approach the limits of detection and quantification for the methods. This is especially true for the analysis of organ tissue, which can exhibit uneven spatial distribution, making the exact sampling and preparation methods crucial to the outcome of the study. In order to draw sound scientific conclusions from bioanalysis research projects, it is important to have a robust validated analytical method. [6,7] While some methods may focus on the analysis of a single analyte to investigate causal relationships between the analyte and the health outcome, biological systems are often more complicated and require multifactorial analyses to elucidate the complex interrelationships of a broad panel of analytes, or “-omics” type approaches. “Metallomics” is an
encompassing term for the study of metals and their function in cells that has seen increased visibility and attention in recent years.[8–11] An additional subset of metallomics has recently been described that focuses on the essential nutritional metals or minerals that is referred to as “mineralomics.” [12,13] It is especially important to carefully validate broad panel “omics” methods to ensure that accurate results are achieved for all elements included in the analytical method.
The purpose of this study was to develop and validate an analytical method for a suite of toxic and essential metals in placenta tissue to support studies of the relationships between trace elements and health outcomes in pregnancy. The primary analyte of interest was zinc (Zn), but the method was also validated for the essential elements chromium (Cr), iron (Fe), cobalt (Co), nickel (Ni), and copper (Cu), and the toxic elements arsenic (As), cadmium (Cd), and lead (Pb) at varying concentrations. The validation was performed by
bioanalytical method guidelines to demonstrate interday (same day) and intraday (different day) accuracy and precision for these elements in the human placental matrix. The method was shown to be valid for the elements of interest at levels comparable to or above the native concentrations in the tissues.
Author Manuscript
Author Manuscript
Author Manuscript
Methods and Materials
Samples and Materials
Two whole human placenta samples were purchased from Bioreclamation IVT (Baltimore, MD) and were stored at a nominal temperature of −80 °C until time of use. Samples were collected from healthy volunteers and were used as received for preparation. Sample collection procedures followed the Helsinki Declaration guidelines regarding informed consent of human volunteers. Samples were fortified and calibration standards were prepared with the elements of interest by spiking with stock standards that were prepared with National Institute of Standards and Technology (NIST)-traceable standards of As, Cd, Co, Cr, Cu, Ni, Pb (all 10 μg/mL), Fe, and Zn (both 1000 μg/mL) purchased from High Purity Standards (Charleston, SC). Prepared samples and calibration standards were spiked with NIST-traceable Bi, In, Pr, and Y standards (10 μg/mL) as internal standards that were also purchased from High Purity Standards. Samples were prepared with concentrated, 70%
(v/v) nitric acid (HNO3, Optima purity, Thermo-Fisher) and high purity 30% (v/v) hydrogen
peroxide (H2O2, Ultrex purity, non-stabilized, Thermo-Fisher Scientific, Waltham, MA).
Approximately 18 MΩ cm−1 water was used in all sample preparation and analysis steps.
Validation guidelines
Digested samples were prepared from a homogenized mixture of two whole human placenta and were used to prepare multiple replicates of samples that were spiked at seven
concentration levels representing a range of concentrations relative to native levels (Table S1, Supplemental Information). Samples were prepared in triplicate at all concentration levels and on three separate, non-consecutive analytical days, and multiple replicates (n = 6) were prepared at the two lowest nominal concentration levels to challenge detection and quantitation limits. The preparation of samples in at least triplicate was performed to assess interday (same day) accuracy and precision, and the repetition of analyses on at least three non-consecutive analytical days was intended to assess intraday (different day) accuracy and precision. The limit of detection (LOD), and lower limit of quantification (LLOQ), and selectivity were assessed by analysis of six replicates of the lowest concentration spike levels on the first analytical day. In addition, on the first analytical day, a series of matrix standards were prepared for comparison to solvent standards in order to assess matrix effects on analyte signal. On the second analytical day, three replicate samples were spiked and prepared at nominal concentrations exceeding analyte linear ranges to perform a dilution verification check.
Instrumentation
All samples were prepared in a Class 100 clean hood to prevent contamination by
atmospheric particulates. After digestion, the samples were analyzed for trace minerals using the Thermo (Bremen, Germany) X-Series I inductively-coupled plasma mass spectrometer (ICP-MS) equipped with a concentric glass nebulizer, collision cell technology (CCT) and Peltier-cooled glass spray chamber. Digestion of samples was performed using a DigiPrep graphite block digestion unit (SCP Science, Quebec) equipped for 15 mL digestion vessels.
Author Manuscript
Author Manuscript
Author Manuscript
Digestion method
A scheme of the sample preparation method is shown in Figure 1 and details are provided in Table S2 (Supplemental Information). In order to promote an even distribution of tissue and promote optimal acid digestion of samples throughout, tissue samples were massed and homogenized by mixture with 2 times the sample weight of concentrated Optima-purity nitric acid in a heated circulating water bath and stirring until smooth. Nominal 0.500 mL homogenate aliquots were transferred to acid-washed 15-mL digestion vessels and directly spiked with elemental intermediate stock solutions at concentrations described in Table S1.
After spiking, 0.500 mL of HNO3 and 0.100 mL of H2O2 were added to each vessel and the
cap was placed loosely on the vessel. All vessels were placed in the graphite block digestion unit at 100 °C for 60 minutes and the digestion vessels were removed to allow to cool to room temperature. Samples were spiked with internal standard stock solution to a final concentration of 2 ng/mL to provide a measure of matrix effects on analyte ionization in the plasma and provide an indicator of instrument performance throughout the analysis, and the solutions were diluted to a final volume of 10 mL with DI water.
Sample analysis
Sample analysis was performed by quadrupole ICP-MS (Table 1). Calibration ranges were prepared to contain both the native concentrations of the trace elements and the spiked levels of all elements. All elements were analyzed in kinetic energy discrimination (KED) mode
with 10% H2/He collision cell gas to minimize polyatomic interferences. System suitability
was monitored throughout the analysis by measurement of multiple matrix QC samples over a range of concentrations. Blank samples were measurement immediately after calibration to confirm a lack of analyte carryover. For the calibration, standards were accepted as passing if their back-calculated concentration was found to be within ±15% of the nominal
concentration (±20% of the nominal concentration for the lowest concentration standard). At least 8 calibration standards were required to pass in order to accept the calibration curve as valid for the analytical day.
Calculations
Analytical recovery of spiked samples was calculated using Eq. 1 for bias (relative error):
(1)
Where Cmeas represents the measured concentration of each element, CMxB represents the
average measured concentration of the element in five replicates of matrix blank samples,
and Cnom represents the nominal concentration for the element at that concentration level.
Precision was calculated as the relative standard deviation (RSD) of repeated analyses of the same concentration level, shown in Eq. 2:
(2)
Author Manuscript
Author Manuscript
Author Manuscript
Where σn represents the standard deviation of all measurements.
Matrix impact was calculated for each element as the ratio of the slope of the calibration
curve obtained from matrix standards (mMx) to the slope of the calibration curve obtained
from solvent standards (mSolv), Eq. 3:
(3)
Results
Precision and accuracy
Results for intraday precision and accuracy for all three validation days are presented in Tables 2 and 3. For analytes (Table 2 and Table 3), precision and accuracy were required to be ≤20% and within ±20%, respectively. These pre-defined acceptance criteria were achieved for all analytes and concentration levels on all three validation days, indicating that the validated analytical method was robust and fit for purpose.
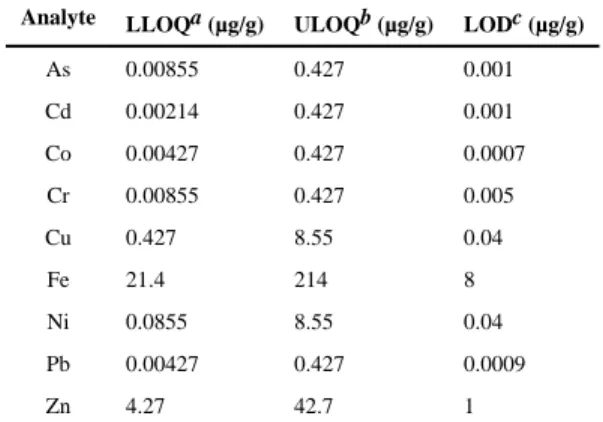
Analytical limits
Analytical measurement limits for the analyte suite are presented in Table 4. The lower limit of quantitation (LLOQ) was conservatively defined as the lowest nominal matrix QC level meeting the above described a priori defined precision and accuracy acceptance criteria on each of three validation days. To further challenge the analytical method, six replicates at the lowest two nominal concentration levels were prepared on the first validation day (Table S1). The limit of detection (LOD) for each analyte was then calculated as three times the standard deviation of the determined concentration at the LLOQ level on the first validation day. A total of six replicates were used to establish these figures of merit for all elements except for As and Cr, which had three replicates because it was necessary to shorten the linear range to meet precision and accuracy acceptance criteria. The upper limit of quantitation (ULOQ) for each analyte was defined as the highest level matrix standard included in the linear regression on all validation days. The reported preparation and analytical method has provided validated analytical ranges between one and two orders of magnitude depending on the identity and endogenous levels of each element.
Dilution verification and matrix impact
Precision and accuracy data from the dilution verification matrix samples (Table S1) are presented in Table 5. Precision (%RSD) and accuracy (%RE) were required to be ≤ 20% and within ±20%, respectively, for all other analytes. These pre-defined acceptance criteria were easily achieved, indicating the feasibility of diluting samples to have determined
concentrations that fall within validated linear ranges. The pre-defined acceptance criterion was a slope ratio within ±20% for all analytes in the suite. This criterion was achieved on the first validation day indicating that the overall matrix impact was not significant, so all precision and accuracy calculations were conducted using solvent curves.
Author Manuscript
Author Manuscript
Author Manuscript
Discussion
Digestion method
In ICP-MS methods and in bioanalytical methods, the sample preparation technique is of the utmost importance to ensure that consistent, reliable analytical results are obtained. It is necessary to ensure complete solubilization of the elements of interest uniformly throughout the sample solution and that minimal particulate matter remains in the solution, which could potentially clog the nebulizer of the instrument.
The first step of the sample preparation technique, homogenization of the tissue prior to digestion, has been successfully applied to previous method validation efforts for other analytes and tissues.[14] Homogenization assists in the degradation of the tissue in solution by providing more exposed surface area for acid digestion to occur. The process also helps to provide a uniform distribution of the element throughout the solution, as opposed to previous studies, which cut small masses of tissue from the whole organ.[4,5,15] This sample preparation method may not account for the possibility of the localization of elements within the mass of tissue, potentially resulting in artificially high or low results for the elements of interest.
Another difference in the method applied here is that digestion of the tissue is occurring through the use of a graphite digestion unit rather than microwave digestion. While
microwave assisted digestion is appropriate for some types of samples, graphite heating unit digestion is a less-expensive, gentler digestion technique that is fit for the intended purpose described in this validation[16] The application of cost-effective, graphite heating digestion units can result in a less violent digestion than microwave digestion and a lower probability of sample loss due to frothing or bursting of digestion vessels. Further, the homogenization step serves to perform a predigestion of the sample, breaking down much of the organic matter before the addition of hydrogen peroxide, which produces more frothing than nitric acid alone. Previous studies have used cryogenic grinding of biological samples to
homogenize the sample prior to microwave digestion with some success, but this method of homogenization requires the purchase of specialized equipment, which was not required for this reported method.[17]
Method figures of merit
The LLOQ, LLOD, and ULOQ for each analyte, presented as μg element/g tissue, were robustly established and confirmed over three validation days. One previous study reported limits of detection for Cd, As, and Pb of 0.007 ng/g, 0.041 ng/g, and 0.01 ng/g, respectively, although the method used to determine the limits was not described.[15] Another
investigation reported the LOD for the elements of interest as Fe = 0.0016 ng/g, Co = 0.002 ng/g, Cu = 0.0002 ng/g, Zn = 0.0058 ng/g, As = 0.02 ng/g, Cd = 0.001 ng/g, and Pb = 0.003 ng/g.[5] However, these values were calculated as 3 times the standard deviation of blank samples, but an LLOQ as defined above may be a more realistic estimate of values that can be consistently achieved due to the requirement of meeting predefined acceptance criteria for both accuracy and precision. Another study reported limits of detection of 0.4 ng/mL for Pb, 0.08 ng/mL for Cd, 4 ng/mL for Zn, and 1 ng/mL for Cu. These values appear to be
Author Manuscript
Author Manuscript
Author Manuscript
more consistent with those obtained in the current study. However, it is unclear whether any of these studies take into account dilution of the samples as a result of the sample
preparation method, a phenomenon that is taken into account with the results reported here. Further, the values determined in this validation are supported by a more robust method of determination of the limits owing to the use of multiple measurements of quantifiable samples. This method of determination is also the explanation of the relatively high limits determined for Fe and Zn, elements that suffer from appreciable polyatomic interferences (Table S3) and lower sensitivity in KED mode. However, it is unlikely that samples of this type will ever exhibit concentrations that challenge the limit of detection owing to the high native concentrations of the elements in tissues.
Broad panel analyses
Broad panel analyses such as the one described here can have a significant impact in elucidating the causal relationships that can produce harmful health outcomes. In the study of complex conditions such as preeclampsia where the exact etiological factors that result in their development are uncharacterized, a holistic approach to the complex interrelationships between different compounds, in this case minerals, can be informative. The approach described here can also provide a “shotgun” approach to toxicological studies, producing a maximum amount of information to determine correlations between health outcomes later in life and early life exposures to toxic metals or trace mineral deficiencies.
Another advantage to the “omics” approach described here is that the method described uses a minimal amount of sample for each measurement. “Omics” approaches often make use of minimal amounts of tissue or biological fluid in order to maximize the number of analyses that can be performed and minimize the invasiveness of sample collection, allowing the collection of a vast amount of data from a small amount of tissue. This approach can be particularly effective for performing research on samples that are stored in biological sample repositories, where the sample mass may be limited.
However, the use of the broad panel analysis method by ICP-MS can potentially suffer from challenges to some of the analytes of interest. Polyatomic interferences (Table S3) can result in difficulties in the consistent determination of the concentration of analytes without the use of corrective measures. In this analysis, all elements were analyzed in kinetic energy discrimination mode (KED mode, also known as collision cell mode or CCT mode) with
H2/He gas to minimize the presence of polyatomic interferences, which could pose
significant analytical challenges for a number of the elements in biological matrices, shown in Table S3.[18] Analysis in KED mode also results in decreased sensitivity for all elements compared to standard mode analysis. This issue is a particular concern for the analysis of Cr (ArC and CaC polyatomic interferences) and Co, where the native levels of the metals are very low, to the point of approaching the limits of detection. The exogenous toxic metal arsenic also suffers from a polyatomic interference in high salt solutions due to the formation of the ArCl species in the plasma, necessitating its analysis in KED mode.[19] It is possible that the use of higher resolution analysis modes, such as by sector-field ICP-MS (SF-ICP-MS) could provide higher sensitivity and lower limits of detection for challenging elements.[20]
Author Manuscript
Author Manuscript
Author Manuscript
In some cases, it may also be possible to analyze an alternate isotope that does not suffer from the same interferences or has interferences that contain lesser abundant isotopes of their own elements. This can allow the analyst to obtain higher sensitivity for the element of interest (if the isotope is sufficiently abundant that the signal is greater than that obtained with the primary isotope in KED mode). Conversely, lead and cadmium do not suffer from any commonly-observed polyatomic interferences in ICP-MS, making it possible to quantify the elements without the use of KED mode, such as in a multimode analytical run, allowing lower limits of detection and quantification for those analytes. However, this could in some cases present challenges resulting from the need to consume increased volumes of the sample as the instrument would perform two sets of scans, one in standard mode and another in KED mode. It is also possible to use interference correction equations to account for the formation of polyatomic interferences.[21] However, this practice is less accurate than other forms of interference exclusion, as it assumes constant rates of formation of polyatomic interferences, and requires thorough and repeated characterization of the correction factors necessary to accurately calculate the analyte counts throughout the analysis. This approach may be better suited to laboratories that do not have instruments equipped with collision cells, but can also over- or under-compensate depending on the levels of analyte and interference.
Finally, it is important to note that the methods described here have only definitively been shown to produce accurate analytical results for the elements reported here. The analysis of other elements, such as the alkali metals, has not been definitively demonstrated and will require additional work to verify the appropriateness of these digestion and analysis methods prior to their use.
Applications
The analytical approach validated in this study was primarily developed to address correlations between the occurrence of preeclampsia and zinc levels in the placenta.
However, the broad panel analysis validated here can be applied to a variety of health equity issues, some of which have been described in previous reports citing correlations between trace element concentrations and health outcomes. The studies reported thus far have touched on the potential roles for specific analytes in the prenatal or early childhood
development of illnesses, but a detailed link to prenatal exposure and mineral nutrition status has not been explored and the method described here may be able to provide a more detailed link between these factors.
Preeclampsia is a serious multisystemic medical condition in pregnant women that is generally observed after 20 weeks of gestation and is characterized by new-onset elevated blood pressure and proteinuria, among a variety of other symptoms.[22,23] Advanced cases of preeclampsia can result in serious medical complications in the mother including stroke and heart disorders, as well as fetal outcomes including IUGR.[24] The development of the placenta has been found to be linked to some of the maternal symptoms of preeclampsia.[22] The condition is currently one of the leading causes of mother and infant morbidity and mortality, and is especially prevalent in the developing world, where malnutrition leads to decreased dietary intake of many essential nutrients.[25,26] The occurrence of preeclampsia
Author Manuscript
Author Manuscript
Author Manuscript
has also been linked to the development of noncommunicable diseases later in life.[27] The only effective cure for preeclampsia is delivery or abortion, making early manifestation of the disease a challenge to maintain maternal health until the fetus can mature sufficiently to survive outside of the womb. Early detection and the development of effective treatment regimens requires an understanding of the etiology of the disease.
A number of previous studies have shown a statistical correlation between micronutrient levels in the mother and the occurrence of preeclampsia.[28] Zinc is an essential trace micronutrient that plays a role in signaling proteins and catalytic enzymes, and its deficiency has been linked to a wide variety of adverse health outcomes.[29] Maternal plasma zinc concentrations have been found to naturally decrease during pregnancy, and some studies have found that individuals suffering from preeclampsia exhibit zinc levels that are decreased relative to normal pregnancies, with lower levels observed in more severe cases. [30–32] One study demonstrated a correlation between decreased zinc absorption and iron and folic acid dietary supplements that are commonly prescribed to pregnant women.[33] Maternal serum levels of other elements, including copper, zinc, and iron were shown to be lower in preeclamptic women than in normal pregnant women.[34] The ability to mitigate the occurrence of preeclampsia through the administration of dietary mineral supplements is a subject of some debate.[18,35] Other studies have shown that administration of
multivitamins containing essential micronutrients preconception can result in a significant decrease in the rate of occurrence of preeclampsia and other adverse birth outcomes.[36] An appropriate analytical method that provides consistent concentrations of zinc and other micronutrients could shed some light on the etiology of the disease, providing novel strategies for preventing the development of the disease.
However, beyond the study of preeclampsia, there are a variety of other conditions and health outcomes that can be studied with the broad panel approach validated here.[37] Low maternal iron levels have been suggested to influence birth weight, and iron and folic acid supplementation has previously been correlated to low maternal zinc uptake.[35] Prenatal iron deficiency has also been linked to neurocognitive developmental effects in early
childhood.[38] Vitamin B12 (cobalamin, a cobalt compound) deficiencies in maternal diets
have been linked to low fetal growth and other adverse symptoms including cleft palate.[39] Nutritional deficiencies are very frequently observed in developing countries, making dietary uptake and maternal health an urgent health equity issue.[40]
Additionally, exposures to toxic metals may be of greater concern in developing countries as a result of less stringent controls on environmental release, less developed testing and treatment systems, and the availability of consumer products containing toxic metals.[41] Maternal occupational exposure to nickel has been found to be linked to the development of musculoskeletal birth defects.[38] Elevated lead levels are observed in children in
developing countries, which can have a strongly adverse effect on neurocognitive development.[42] Arsenic exposure from the water supply has been observed in some eastern Asian countries including Bangladesh, which can result in neurocognitive effects and other health outcomes.[43]
Author Manuscript
Author Manuscript
Author Manuscript
Conclusions
The analysis of biological tissues for trace metals can provide invaluable information regarding the etiology of diseases and other outcomes, as well as providing an assessment of environmental exposure to contaminants that may be correlated to adverse health outcomes later in life. The accurate determination of the levels of trace elements requires a robust sample preparation and analysis method that provides reliable, precise results. The method of sample homogenization and acid digestion detailed in this report has been validated for inter- and intraday accuracy and precision and matrix effects on the analytical signal and has demonstrated a high degree of reproducibility of results. The results suggest that the method can provide strong analytical results in support of studies to assess maternal and natal health and their relationship to the environmental exposome.
Supplementary Material
Refer to Web version on PubMed Central for supplementary material.
Acknowledgments
This project was supported by the NIH Eastern Regional Metabolomics Resource Core (NIH Common Fund Grant 1U24DK097193; PI Susan Sumner), and the NIH Clinical and Translational Sciences Award (NCATS Grant UL1TR00111; PI Marshall Runge). The authors would also like to acknowledge R.K.M. Jayanty, Distinguished RTI Fellow, for his support and mentorship during the development of this manuscript.
Abbreviations
ICP-MS Inductively Coupled Plasma-Mass spectrometry
NIST National Institute of Standards and Technology
ELOQ Estimated limit of quantitation
LOD Limit of Detection
KED Kinetic Energy Discrimination
SF-ICP-MS Sector field inductively coupled plasma mass spectrometry
IUGR Intra-uterine growth restriction
References
1. Frausto da Silva, JJR.; Williams, RJP. The Biological Chemistry of the Elements. 2nd. Oxford University Press; Oxford: 2001.
2. Zhuang T, Han H, Yang Z. Iron, oxidative stress and gestational diabetes. Nutrients. 2014; 6(9): 3968–3980.10.3390/nu6093968 [PubMed: 25255832]
3. Burton GJ, Sebire NJ, Myatt L, Tannetta D, Wang YL, Sadovsky Y, Staff AC, Redman CW. Optimising sample collection for placental research. Placenta. 2014; 35(1):9–22. http://dx.doi.org/ 10.1016/j.placenta.2013.11.005. [PubMed: 24290528]
4. Sakamoto M, Yasutake A, Domingo JL, Chan HM, Kubota M, Murata K. Relationships between trace element concentrations in chorionic tissue of placenta and umbilical cord tissue: Potential use as indicators for prenatal exposure. Environment International. 2013; 60:106–111.10.1016/j.envint. 2013.08.007 [PubMed: 24028800]
Author Manuscript
Author Manuscript
Author Manuscript
5. Fagerstedt S, Kippler M, Scheynius A, Gutzeit C, Mie A, Alm J, Vahter M. Anthroposophic lifestyle influences the concentration of metals in placenta and cord blood. Environmental Research. 2015; 136:88–96.10.1016/j.envres.2014.08.044 [PubMed: 25460625]
6. Levine KE, Tudan C, Grohse PM, Weber FX, Levine MA, Kim YSJ. Aspects of bioanalytical method validation for the quantitative determination of trace elements. Bioanalysis. 2011; 3(15): 1699–1712.10.4155/bio.11.163 [PubMed: 21827269]
7. USFDA. Guidance for Industry Bioanalytical Method Validation. Rockville, MD: 2001. 8. Hu LG, He B, Wang YC, Jiang GB, Sun HZ. Metallomics in environmental and health related
research: Current status and perspectives. Chin Sci Bull. 2013; 58(2):169–176.10.1007/ s11434-012-5496-1
9. Mounicou S, Szpunar J, Lobinski R. Metallomics: the concept and methodology. Chem Soc Rev. 2009; 38(4):1119–1138.10.1039/b713633c [PubMed: 19421584]
10. Sussulini A, Becker JS. Combination of PAGE and LA-ICP-MS as an analytical workflow in metallomics: state of the art, new quantification strategies, advantages and limitations. Metallomics. 2011; 3(12):1271–1279.10.1039/c1mt00116g [PubMed: 22020804]
11. Wang B, Feng WY, Zhao YL, Chai ZF. Metallomics insights for in vivo studies of metal based nanomaterials. Metallomics. 2013; 5(7):793–803.10.1039/c3mt00093a [PubMed: 23775512] 12. Harrington JM, Young DJ, Essader AS, Sumner SJ, Levine KE. Analysis of human serum and
whole blood for mineral content by ICP-MS and ICP-OES: Development of a mineralomics method. Biological Trace Element Research. 2014; 160(1):132–142.10.1007/s12011-014-0033-5 [PubMed: 24917052]
13. Yasuda H, Yonashiro T, Yoshida K, Ishii T, Tsutsui T. Relationship between Body Mass Index and Minerals in Male Japanese Adults. Biomed Res Trace Elem. 2006; 17:316–321.
14. Poitras EP, Levine MA, Harrington JM, Essader AS, Fennell TR, Snyder RW, Black SL, Sumner SS, Levine KE. Development of an Analytical Method for Assessment of Silver Nanoparticle Content in Biological Matrices by Inductively Coupled Plasma Mass Spectrometry. Biological Trace Element Research. 2014; 163(1–2):184–192.10.1007/s12011-014-0141-2 [PubMed: 25308764]
15. Jin L, Zhang L, Li Z, Liu JM, Ye R, Ren A. Placental concentrations of mercury, lead, cadmium, and arsenic and the risk of neural tube defects in a Chinese population. Reproductive Toxicology. 2013; 35(1):25–31.10.1016/j.reprotox.2012.10.015 [PubMed: 23164984]
16. Burguera JL, Burguera M. Recent on-line processing procedures for biological samples for determination of trace elements by atomic spectrometric methods. Spectrochimica Acta - Part B Atomic Spectroscopy. 2009; 64(6):451–458.10.1016/j.sab.2009.01.004
17. Santos WPC, Hatje V, Lima LN, Trignano SV, Barros F, Castro JT, Korn MGA. Evaluation of sample preparation (grinding and sieving) of bivalves, coffee and cowpea beans for multi-element analysis. Microchemical Journal. 2008; 89(2):123–130.10.1016/j.microc.2008.01.003
18. Mahomed K, James DK, Golding J, McCabe R. Zinc supplementation during pregnancy: A double blind randomised controlled trial. British Medical Journal. 1989; 299(6703):826–830. [PubMed: 2510845]
19. Chiba K, Narukawa T. The Effect of Plasma Reactions on Arsenic Measurement by ICP Spectrometry. Analytical Sciences. 2014; 30(1):175–181.10.2116/analsci.30.175 [PubMed: 24420260]
20. Case CP, Ellis L, Turner JC, Fairman B. Development of a routine method for the determination of trace metals in whole blood by magnetic sector inductively coupled plasma mass spectrometry with particular relevance to patients with total hip and knee arthroplasty. Clin Chem. 2001; 47(2): 275–280. [PubMed: 11159776]
21. De Boer JLM. Real-time adjustment of ICP-MS elemental equations. Journal of analytical atomic spectrometry. 2000; 15(9):1157–1160.10.1039/b001101k
22. George EM. New approaches for managing preeclampsia: Clues from clinical and basic research. Clinical Therapeutics. 2015; 36(12):1873–1881.10.1016/j.clinthera.2014.09.023 [PubMed: 25450475]
23. Hypertension in Pregnancy: Executive Summary. Obstetrics & Gynecology. 2013; 122(5):1122– 1131.10.1097/01.aog.0000437382.03963.88 [PubMed: 24150027]
Author Manuscript
Author Manuscript
Author Manuscript
24. Redman CWG, Sargent IL. Placental Stress and Pre-eclampsia: A Revised View. Placenta. 2009; 30(SUPPL):38–42.10.1016/j.placenta.2008.11.021
25. Bilano VL, Ota E, Ganchimeg T, Mori R, Souza JP. Risk factors of pre-eclampsia/eclampsia and its adverse outcomes in low- and middle-income countries: A WHO secondary analysis. PLoS ONE. 2014; 9(3)10.1371/journal.pone.0091198
26. Khan KS, Wojdyla D, Say L, Gülmezoglu AM, Van Look PF. WHO analysis of causes of maternal death: a systematic review. Lancet. 2006; 367(9516):1066–1074.10.1016/s0140-6736(06)68397-9 [PubMed: 16581405]
27. Bygbjerg IC. Double burden of noncommunicable and infectious diseases in developing countries. Science. 2012; 337(6101):1499–1501.10.1126/science.1223466 [PubMed: 22997329]
28. Jain S, Sharma P, Kulshreshtha S, Mohan G, Singh S. The role of calcium, magnesium, and zinc in pre-eclampsia. Biological Trace Element Research. 2010; 133(2):162–170.10.1007/
s12011-009-8423-9 [PubMed: 19547932]
29. Fukada T, Yamasaki S, Nishida K, Murakami M, Hirano T. Zinc homeostasis and signaling in health and diseases. Journal of Biological Inorganic Chemistry. 2011; 16(7):1123–1134.10.1007/ s00775-011-0797-4 [PubMed: 21660546]
30. Bassiouni BA, Foda AI, Rafei AA. Maternal and fetal plasma zinc in pre-eclampsia. European Journal of Obstetrics and Gynecology and Reproductive Biology. 1979; 9(2):75–
80.10.1016/0028-2243(79)90002-9 [PubMed: 264086]
31. Halsted JA, Hackley BM, Smith JC Jr. Plasma-zinc and copper in pregnancy and after oral contraceptives. Lancet. 1968; 2(7562):278–279. [PubMed: 4173703]
32. Black RE. Micronutrients in pregnancy. British Journal of Nutrition. 2001; 85(SUPPL. 2):S193– S197. [PubMed: 11509110]
33. Simmer K, Iles CA, James C, Thompson RPH. Are iron-folate supplements harmful? American Journal of Clinical Nutrition. 1987; 45(1):122–125. [PubMed: 3799496]
34. Sarwar MS, Ahmed S, Ullah MS, Kabir H, Rahman GKMM, Hasnat A, Islam MS. Comparative study of serum zinc, copper, manganese, and iron in preeclamptic pregnant women. Biological Trace Element Research. 2013; 154(1):14–20.10.1007/s12011-013-9721-9 [PubMed: 23749478] 35. Chaffee BW, King JC. Effect of zinc supplementation on pregnancy and infant outcomes: A
systematic review. Paediatric and Perinatal Epidemiology. 2012; 26(SUPPL. 1):118– 137.10.1111/j.1365-3016.2012.01289.x [PubMed: 22742606]
36. Dean SV, Lassi ZS, Imam AM, Bhutta ZA. Preconception care: nutritional risks and interventions. Reproductive Health. 2014; 11 doi:http://dx.doi.org/10.1186/1742-4755-11-S3-S3.
37. Hovdenak N, Haram K. Influence of mineral and vitamin supplements on pregnancy outcome. European Journal of Obstetrics Gynecology and Reproductive Biology. 2012; 164(2):127– 132.10.1016/j.ejogrb.2012.06.020
38. Arild V, Vasiljevna TL, Petrovitsj CV, Öyvind OJ, Evert N. Maternal nickel exposure and congenital musculoskeletal defects. American Journal of Industrial Medicine. 2008; 51(11):825– 833.10.1002/ajim.20609 [PubMed: 18655106]
39. Wallenstein MB, Shaw GM, Yang W, Carmichael SL. Periconceptional nutrient intakes and risks of orofacial clefts in California. Pediatric Research. 2013; 74(4):457–465.10.1038/pr.2013.115 [PubMed: 23823175]
40. Tulchinsky TH. Micronutrient deficiency conditions: Global health issues. Public Health Reviews. 2010; 32(1):243–255.
41. Walker SP, Wachs TD, Meeks Gardner J, Lozoff B, Wasserman GA, Pollitt E, Carter JA. Child development: risk factors for adverse outcomes in developing countries. Lancet. 2007; 369(9556): 145–157.10.1016/s0140-6736(07)60076-2 [PubMed: 17223478]
42. Lanphear BP, Hornung R, Khoury J, Yolton K, Baghurst P, Bellinger DC, Canfield RL, Dietrich KN, Bornschein R, Greene T, Rothenberg SJ, Needleman HL, Schnaas L, Wasserman G, Graziano J, Roberts R. Low-level environmental lead exposure and children’s intellectual function: An international pooled analysis. Environmental Health Perspectives. 2005; 113(7):894–899.10.1289/ ehp.7688 [PubMed: 16002379]
43. Wasserman GA, Liu X, Parvez F, Ahsan H, Factor-Litvak P, van Geen A, Slavkovich V, Lolacono NJ, Cheng Z, Hussain I, Momotaj H, Graziano JH. Water arsenic exposure and children’s
Author Manuscript
Author Manuscript
Author Manuscript
intellectual function in Araihazar, Bangladesh. Environmental Health Perspectives. 2004; 112(13): 1329–1333.10.1289/ehp.6964 [PubMed: 15345348]
Author Manuscript
Author Manuscript
Author Manuscript
Figure 1.
A flow diagram showing the sample preparation method developed and validated here.
Author Manuscript
Author Manuscript
Author Manuscript
Author Manuscript
Author Manuscript
Author Manuscript
Author Manuscript
Table 1
Instrumental parameters for the ICP-MS analysis of digested placenta samples
Instrument Thermo X Series I ICP-MS
Software PlasmaLab ICP-MS Software, Version 2.3.0.161
Nebulizer Type Glass Concentric
Spray Chamber Peltier cooled
Collision Cell Gas 10% H2/He
Injector 1.8 mm
Analyte Masses 52Cr, 56Fe, 59Co, 60Ni, 63Cu, 66Zn, 75As, 111Cd, 208Pb
Internal Standard Masses 89Y, 115In, 141Pr, 209Bi
Author Manuscript
Author Manuscript
Author Manuscript
Author Manuscript
Table 2
Intraday Precision and accuracy at all concentration levels for As, Cd, Co, Cr, and Cu Nominal [X]
a (μg/g)
Day 1 RE (%)
Day 1 RSD (%)
Day 2 RE (%)
Day 2 RSD (%)
Day 3 RE (%)
Day 3 RSD (%)
Author Manuscript
Author Manuscript
Author Manuscript
Author Manuscript
Nominal [X]
a (μg/g)
Day 1 RE (%)
Day 1 RSD (%)
Day 2 RE (%)
Day 2 RSD (%)
Day 3 RE (%)
Day 3 RSD (%)
0.427
−10
3.7
−17
4.4
−17
2.8
1.07
−12
0.99
−11
1.1
−12
0.66
3.21
−11
1.5
−10
1.7
−7
5.1
4.27
−4
2.6
−10
2.3
−10
0.61
Author Manuscript
Author Manuscript
Author Manuscript
Author Manuscript
Table 3
Intraday Precision and accuracy at all concentration levels for Fe, Ni, Pb, and Zn Nominal [X]
a (μg/g)
Day 1 RE (%)
Day 1 RSD (%)
Day 2 RE (%)
Day 2 RSD (%)
Day 3 RE (%)
Day 3 RSD (%)
Author Manuscript
Author Manuscript
Author Manuscript
Author Manuscript
Nominal [X]
a (μg/g)
Day 1 RE (%)
Day 1 RSD (%)
Day 2 RE (%)
Day 2 RSD (%)
Day 3 RE (%)
Day 3 RSD (%)
21.4
−4
1.3
−4
0.74
0.7
0.84
32.1
−4
1.6
−2
0.51
2
4.6
42.7
3
1.3
−2
2.2
14
3.5
Author Manuscript
Author Manuscript
Author Manuscript
Author Manuscript
Table 4
Analytical figures of merit
Analyte LLOQa (μg/g) ULOQb (μg/g) LODc (μg/g)
As 0.00855 0.427 0.001
Cd 0.00214 0.427 0.001
Co 0.00427 0.427 0.0007
Cr 0.00855 0.427 0.005
Cu 0.427 8.55 0.04
Fe 21.4 214 8
Ni 0.0855 8.55 0.04
Pb 0.00427 0.427 0.0009
Zn 4.27 42.7 1
a
Lower limit of quantitation (LLOQ) defined as lowest matrix QC level with %RE within ±15% and %RSD ≤20% on all three validation days.
b
Upper limit of quantitation (ULOQ) defined as highest matrix standard included in regression.
c
Author Manuscript
Author Manuscript
Author Manuscript
Author Manuscript
Table 5
Dilution verification
Analyte RE (%) RSD (%)
As 1 0.40
Cd 1 1.4
Co −3 0.96
Cr −7 0.75
Cu 10 1.2
Fe −1 4.0
Ni −1 0.17
Pb 2 0.36