Structural bioinformatics
Classification of RNA structure change
by ‘gazing’ at experimental data
Chanin Tolson Woods
1,2and Alain Laederach
1,2,*
1
Department of Biology and
2Curriculum in Bioinformatics and Computational Biology, University of North Carolina
at Chapel Hill, Chapel Hill, NC 27599, USA
*To whom correspondence should be addressed. Associate Editor: Ivo Hofacker
Received on March 14, 2016; revised on January 18, 2017; editorial decision on January 19, 2017; accepted on January 20, 2017
Abstract
Motivation:
Mutations (or Single Nucleotide Variants) in folded RiboNucleic Acid structures that
cause local or global conformational change are riboSNitches. Predicting riboSNitches is
challeng-ing, as it requires making two, albeit related, structure predictions. The data most often used to
ex-perimentally validate riboSNitch predictions is Selective 2
0Hydroxyl Acylation by Primer
Extension, or SHAPE. Experimentally establishing a riboSNitch requires the quantitative
compari-son of two SHAPE traces: wild-type (WT) and mutant. Historically, SHAPE data was collected on
electropherograms and change in structure was evaluated by ‘gel gazing.’ SHAPE data is now
rou-tinely collected with next generation sequencing and/or capillary sequencers. We aim to establish
a classifier capable of simulating human ‘gazing’ by identifying features of the SHAPE profile that
human experts agree ‘looks’ like a riboSNitch.
Results:
We find strong quantitative agreement between experts when RNA scientists ‘gaze’ at SHAPE
data and identify riboSNitches. We identify dynamic time warping and seven other features predictive
of the human consensus. The classSNitch classifier reported here accurately reproduces human
con-sensus for 167 mutant/WT comparisons with an Area Under the Curve (AUC) above 0.8. When we
ana-lyze 2019 mutant traces for 17 different RNAs, we find that features of the WT SHAPE reactivity allow
us to improve thermodynamic structure predictions of riboSNitches. This is significant, as accurate
RNA structural analysis and prediction is likely to become an important aspect of precision medicine.
Availability and Implementation:
The classSNitch R package is freely available at http://classsnitch.
r-forge.r-project.org.
Contact:
[email protected]
Supplementary information:
Supplementary data
are available at
Bioinformatics
online.
1 Introduction
A persistent challenge in the field of structural biology is accurately predicting the conformational and ultimately functional conse-quences of a mutation on a protein or nucleic acid (Chauhan and Woodson, 2008;Chenget al., 2005;Churkinet al., 2011;Russell
et al., 2002a,b). For both nucleic acids and proteins, accurately pre-dicting the extent of disruption is generally more challenging than predicting the entire structure (Miaoet al., 2015;Waldispuhl and Reinharz, 2015;Wanet al., 2014). Indeed it requires making two, albeit related structure predictions. The data most often used in
conjunction with RiboNucleic Acid (RNA) structure prediction al-gorithms are chemical and enzymatic probing experiments (Corley
et al., 2015; Ritzet al., 2012;Solem et al., 2015). These experi-ments, in particular Selective 20 Hydroxyl Acylation by Primer
Extension (SHAPE) provide nucleotide resolution structural infor-mation and are exquisitely sensitive to structure change (Cruzet al., 2012;Kutchkoet al., 2015;Riceet al., 2014;Siegfriedet al., 2014). Recent technological advances enable this data to be collected with unprecedented throughput (Siegfriedet al., 2014); traditionally this data was carefully human curated to ensure accuracy, which is
VCThe Author 2017. Published by Oxford University Press. 1647
This is an Open Access article distributed under the terms of the Creative Commons Attribution Non-Commercial License (http://creativecommons.org/licenses/by-nc/4.0/), which permits non-commercial re-use, distribution, and reproduction in any medium, provided the original work is properly cited. For commercial re-use, please contact [email protected]
simply not possible in the genomic context (Ritzet al., 2012; Rocca-Serraet al., 2011;Sansoneet al., 2012).
Chemical and enzymatic probing techniques have long been used in structural, kinetic and thermodynamic characterizations of nu-cleic acids (Brenowitz et al., 1986a,b; Deras et al., 2000; Sclavi
et al., 1997). Until the advent of capillary sequencing and more re-cently next generation sequencing, the experiments were carried out using traditional gel electrophoresis (Brenowitzet al., 1986a,b;Petri and Brenowitz, 1997). Although informatics tools were developed to rapidly quantify these complex electropherograms, most struc-tural insight was still gleaned by ‘gel gazing;’ for an effect to be ro-bust the scientist had to be able to visualize it (Daset al., 2005;Das
et al., 2008;Russellet al., 2002a,b;Takamotoet al., 2004). With high-throughput probing experiments rapidly becoming the norm, it is impossible to systematically visualize all the data.
In this manuscript we are specifically interested in mutation induced structure change in RNA and in particular the detection of riboSNitches using chemical and enzymatic probing data (Corley
et al., 2015; Halvorsenet al., 2010;Lokody, 2014;Martin et al., 2012; Ritz et al., 2012; Solem et al., 2015; Wan et al., 2014). Accurately detecting riboSNitches experimentally is essential to es-tablishing robust benchmarks (Corleyet al., 2015;Ritzet al., 2012). Moreover, as transcriptome-wide structure probing experiments rap-idly become the norm (Martinet al., 2012;Wanet al., 2012,2014), efficiently detecting riboSNitches is likely to become an important component of personalized medicine (Solemet al., 2015). The main premise for the work presented in this manuscript is in the history of chemical and enzymatic probing techniques and in particular the value of expert human decision making in the determination of whether a structural change is significant. In particular, the distinc-tion between a local structural change affecting several residues and a global structure change affecting a majority of residues.
Human ability to visually detect patterns in data is exceptional; even in the field of RNA structure, humans readily design better RNA folds than purely automated programs (Lee et al., 2014;
Rowles, 2013;Treuille and Das, 2014). Interestingly, with enough examples machines can then learn the rules used by humans to make these designs (Leeet al., 2014). In this manuscript, we aim to auto-mate some of the human skills associated with ‘gel gazing’ and apply these to the problem of identifying riboSNitches from high-throughput SHAPE data. We are particularly interested in under-standing how humans interpret SHAPE data and what features of the signal they use to classify structure change. We are also inter-ested in determining whether there is a consensus among users of SHAPE data as to what constitutes a small or large change in RNA structure. We therefore created a platform for easily visualizing SHAPE traces and asked experts in the field to classify traces and structures. As will be shown below, there is surprising agreement in human appreciation of the data and from these classifications we are able to identify novel metrics that reproduce the manual classifi-cations. We are therefore able to report a structural classification scheme that quantitatively reproduces the process of ‘gel gazing.’ Our classifier allows us to simulate human eyes on high-throughput datasets and identify important differences in specific RNAs’ sensi-tivity to mutation.
2 Materials and methods
2.1 Dataset
SHAPE traces for 17 mutate-and-map experiments were obtained from the publicly available RNA Mapping DataBase (RMDB)
(Corderoet al., 2012;Kladwanget al., 2011a,b,c). These 17 RNA database entries had a total of 2019 WT and single-point mutant trace pairs (Supplementary Material, Table S1). Of these trace pairs, 200 pairs were chosen for manual evaluation by 14 experts. Due to incomplete survey results we were able to obtain a majority consen-sus from at least 14 experts on 167 of the pairs.
2.2 Data normalization and noise reduction
Each WT trace was normalized to a mean reactivity of 1.5. A multiplier was used to normalize the respective mutant trace. The multiplier was chosen that minimized the difference between the WT and mutant traces. We reduced noise by setting mutant SHAPE values equal to the WT value, if both reactivities were outliers as defined by (Karabiberet al., 2013). To remove end effects, 8% of the data was trimmed from the 50and 30ends. Normalization and
noise reduction are further explained in MethodsSupplementary, Section S2.2.
2.3 Human expert evaluations
An online survey was created for the manual evaluation of 200 WT/ mutant trace pairs. A trace pair consisted of a single WT trace and a mutant trace. The same WT trace could be used in multiple pairs with different mutants. The WT structure determined from the mutate-and-map experiments was provided, along with the WT SHAPE trace, the mutant SHAPE trace, the overlay of the WT and mutant traces, and the difference between the WT and mutant trace (Kladwanget al., 2011a,b,c). Survey participants were asked to label each WT/mutant pair as having: (i) no differences or small differ-ences, (ii) local differences or (iii) global differences (Methods Supplementary, Section S2.3). For the purpose of this survey, local differences were considered to be close to the mutation site in se-quence space. Under this definition, local changers in secondary structure space may be misclassified as global changers. Similarly, global changers in secondary structure space may be misclassified as local changers. Therefore, it is useful to consider secondary structure in structure change prediction, but the true secondary structure for an RNA is difficult to obtain experimentally. To address this we compared the expert classification to secondary structure prediction guided by SHAPE data. It is important to note that using predicted secondary structures in lieu of experimental structures is imperfect and likely increases the perceived secondary structure classification error by the experts. The experts did occasionally classify local chan-gers in predicted secondary structure as global chanchan-gers. However, the experts rarely classified global changers in secondary structure as local changers. (Supplementary Material, Table S8). Experts were filtered using a set of questions that gauged their familiarity with the biological sciences, RNA, RNA structure and SHAPE experiments. We identified 14 respondents in our survey results who self-identified as experts.
2.4 Feature and algorithm selection
Twenty-three features were initially used to quantify WT and mu-tant SHAPE trace differences and are reported in Table 2 and
most accurate for classification (Supplementary Material, Table S3) based on the number correctly predicted for non-changers. Assuming a tie at this level, we then selected the most accurate based on local changers and then global changers. We used this ranking because the distinction between change and no change is the most biologically important in our opinion. Further visual analysis of specific traces suggests that the random forest algo-rithm better distinguishes between local and non-changers than the next best performing algorithms, Multilayer Perceptron and Kstar. This is particularly true for WT/mutant pairs with minimal differences in pattern, but sizeable differences in magnitude such as the G55U mutation in the 16S four-way junction, which we il-lustrate in Supplementary Material, Figure S1. KStar and Multilayer Perceptron mislabel the pair as a local changer, while Random Forest correctly identified the pair as a non-changer in agreement with the majority vote of experts. Although these minor differences in classification do not indicate that random forest is statistically better than Kstar and Multilayer Perceptron, the correct classification by random forest on these particularly difficult comparisons led us to choose it for implementation in the classSNitch approach. We built a random forest classifier on the set of 167 trace pairs using the randomForest R package with 5001 trees and default settings (Breiman, 2001;Liaw and Wiener, 2002). The random forest classifier was used to predict the classes for the entire set of 2019 normalized and noise reduced WT/mu-tant trace pairs. Feature selection, algorithm selection, and model building are further explained in Methods Supplementary, Section S2.4. The model’s robustness to noise was tested using both simulated noise and repeated experiments (Supplementary Material, Fig. S2).
2.5 classSNitch package
An R package was created for the identification of RNA structure change in large amounts of SHAPE data. The package includes methods for normalization, noise reduction, and calculating fea-tures. Feature calculations include pattern change, dynamic time
warping, change contiguousness, Pearson correlation, Euclidean norm, change variance, eSDC and change range. The package can identify structure change in new SHAPE datasets based on an exist-ing classifier. classSNitch is currently available at R-Forge.
2.6 WT SHAPE improved SNPfold
We modified the SNPfold scoring scheme, which is based on the WT and mutant Pearson correlation coefficient (Halvorsenet al., 2010), to include the WT SHAPE prediction as follows:
Score¼ SNPfoldscoreþSHAPEf0;1gþGorCf0;1g (1)
whereSHAPE{0,1}is 1 if the WT SHAPE reactivity is above the
me-dian value of the trace, 0 if it is below;GorC{0,1}is 1 if the WT
nu-cleotide is a G or C, 0 otherwise. SNPfold is further explained in
Methods Supplementary, Section S2.6.
3 Results
3.1 The ‘obvious’ riboSNitch
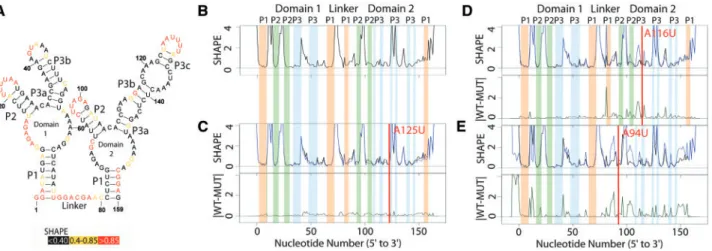
Figure 1Aillustrates the published secondary structure of the apo Glycine riboswitch based on multiple probing experiments, phylogen-etic analysis and partial crystal structures (Butler et al., 2011;
Kladwanget al., 2011a,b,c). The nucleotides are color coded accord-ing to SHAPE reactivity (red high, yellow medium and black low). In
Figure 1B, the corresponding experimental SHAPE data for the WT RNA is plotted as a black line. A qualitative relationship between the structure and experimental data is evident when the data is presented in this way; in general paired nucleotides have low SHAPE reactivity, while unpaired bases have a ‘peak’ in the profile. In a gel electro-pherogram, the peaks would be darker, and the paired nucleotides lighter.Figure 1Cillustrates the experimental SHAPE data and cor-responding SHAPE-directed structure prediction for the A125U mu-tation in the Glycine riboswitch. The overlay of the two traces reveals no visible difference between the WT (WT, black) and mutant (MUT, blue) trace; the structure prediction is nearly identical to that
Fig. 1. Structure change patterns in SHAPE trace data for the glycine riboswitch aptamers fromFusobacterium nucleatum. (A) Published WT structure for the apo
glycine riboswitch aptamers consistent with the crystal structure and multiple independent structure probing experiments (Butleret al., 2011;Kladwanget al.,
2011a,b,c). Red nucleotides indicate high SHAPE reactivity, yellow indicates mid-range reactivity, and black indicates low reactivity. (B) The individual WT trace is
shown in black; the colored bars indicate the structural regions for each of the aptamers: P1 (orange), P2 (green) and P3 (blue). (C) The WT trace (black) is overlaid
with the mutant SHAPE trace (dark blue), and the absolute difference between the WT and mutant traces is below (dark green). A red bar on the traces shows the mutation site. The A125U mutation is a mutation that leads to no appreciable differences in structure. 100% of experts that classified this mutant labeled it as a
non-changer. (D) The A116U mutation leads to a local structure change, where the mutant trace reactivity increases at the mutation site disrupting the P3 region
of domain 2. 66% of experts that classified the A116U mutant labeled it as a local changer. (E) The A94U mutation leads to a global structure change, where the
mutant trace reactivity increases at both the mutation site and at nucleotides distant in sequence space disrupting both the P1 and P2 regions of domain 2. 66%
of the WT. Not surprisingly, mutating A125 in domain 2 (P3) does not affect structure, as this nucleotide is not paired.
InFigure 1Dwe report the SHAPE-directed prediction for the A116U mutation, which occurs in the P3 helix of domain 2. In this case we see a local difference in the SHAPE trace, and the predicted structure does not contain this region of P3. This mutation has dis-rupted a single hairpin. It is important to note that the resulting SHAPE differences are readily visualized with the difference of the two traces (green trace, right panel).Figure 1Eshows the effect of dis-rupting a base in the P2 stem in domain 2 with the A94U mutation. This results in a change in the P1 helix of domain 2 as well and is con-sidered a global change. We chose to illustrate these three mutations from the 158 available for the Glycine riboswitch (Cruzet al., 2012) as they are visually striking. As will be revealed below, not all muta-tion induced RNA structure change is as clear to visualize.
3.2 Human consensus on local and global
structure change
The complexity of interpreting SHAPE traces is illustrated inFigure 2. Here we plot the WT structure for the 16S four-way junction from the E.coliribosome, as well as the mutant SHAPE data for A26U, A47U (P2b) and U99A (P1c). In each of these cases, it is not visually evident if the structure change is local, global, or if the data is simply inadequate. It is important to note that these SHAPE data are collected in a high throughput fashion, robotically and often not replicated (Chenget al., 2015;Cordero and Das, 2015;Kladwanget al., 2011a,b,c;Miaoet al., 2015). This is one of the main differences in the way in which chemical and enzymatic probing is now collected. Because it can be collected in a very high throughput way, emphasis is placed on multiple experiments (all mutations in an RNA) rather than multiple replicates. Although it would be ideal to replicate these large-scale experiments there is a sig-nificant financial cost associated with multiple replicates.
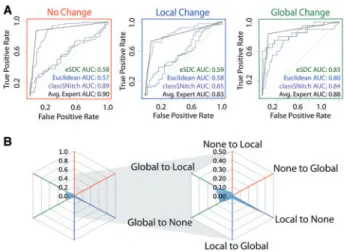
In visually inspecting traces like the ones illustrated inFigure 2A, we observed that in general most people in our lab agreed that A26U does not alter structure, A47U causes a local change, and U99A ap-pears to alter the structure globally. We therefore decided to evaluate if RNA scientists, when presented with these types of traces and the accepted secondary structure of the RNA, agree on the classification of these data into none, local and global change. We recruited 14 vol-unteers from multiple RNA labs to answer an online survey in which each person would classify up to 200 traces (WT/MUT comparisons) into none, local and global changes. In total 1427 comparisons were manually classified, with an average of seven views for each trace (Table 1). From this data we built a consensus human classification of the traces and evaluated each expert’s ROC (receiver operator curve) area under the curve (AUC) to the consensus (Fig. 2B). Since this is a three-way classification we evaluate AUC pairwise for none, local and global change. As can be seen the expert reproducibility is high (AUC average above 0.8) which indicates RNA scientists agree with each other at least with respect to what structure change looks like in a SHAPE trace. We also evaluate human three-way AUC using a cob-web plot (Fig. 2C). This shows that the largest disagreement between self-reported RNA SHAPE experts is in their classification of local ver-sus global change. The average AUC is still 0.8 (blue) suggesting the disagreement is weak. The green AUC curves inFigure 3A, show that for all but distinguishing global vs. none (rightmost graph) eSDC per-forms quite poorly.
We also investigated whether another standard metric, the Euclidean distance (blue AUC) did any better and observed a similar trend. The mean expert performance is shown in black, and is far su-perior to any single metric. Thus, to achieve consensus, RNA
scientists must be looking at other features in the data than simple correlations in the pattern. We set out to discover what these are and to develop an automated classification system of RNA structure change that simulates human consensus calls.
3.3 Automated classification of mutation induced
structure change
To develop an automated classifier for identifying mutation induced structure changes in RNA we began by establishing a list of 23 fea-tures commonly used to evaluate quantitative differences Fig. 2. Expert evaluation of RNA structure change in SHAPE data. (A)
Accepted WT structure for the 16S four-way junction domain from theE.coli
ribosome in agreement with the crystal structure and multiple structure prob-ing experiments (Cordero and Das, 2015;Tianet al., 2014;Zhanget al., 2009). Red nucleotides indicate high SHAPE reactivity, yellow indicates mid-range reactivity, and black indicates low reactivity. For each mutant, the WT trace (black) is overlaid with the mutant SHAPE trace (dark blue). The absolute dif-ference between the WT and mutant traces is depicted below (dark green). 100% of experts that evaluated the A26U WT mutant pair agree that there is no difference or a small difference. 88% of experts agree that the A47U muta-tion creates a local difference. Experts are split on the U99A mutamuta-tion. 37.5% of experts indicated that the mutation creates no difference or a small differ-ence, 37.5% of experts indicated that the mutation creates a local difference and 25% of experts indicated the mutation creates a global or distant
muta-tion. (B) ROC curve analysis was used to compare expert classification to the
majority vote consensus. The gray curves represent individual expert per-formances, while the black curves show the average performance among ex-perts. The ROC curves are depicted for performance in identifying
non-changers (red), local non-changers (blue) and global non-changers (green). (C)
Cobweb plots show the percentage of mutants mislabeled by the expert ma-jority vote with non-changers on the red axes, local changers on the blue axes, and global changers on the green axes. Expert classification is least consistent on differences between global and local changers with a higher percentage of global changers mislabeled as local changers, and local chan-gers mislabeled as global chanchan-gers (Color version of this figure is available at
between two linear datasets (Table 2andSupplementary Material, Table S2). Using the human survey classification (Table 1) for super-vised learning, we trained 38 different algorithms and evaluated their accuracy. The results of this training are provided in
Supplementary Materials, Table S3and suggest the Random Forest classifier performs the best on this data using the eight features found inTable 2. The trained random forest classifier on these eight features is the algorithm used in the classSNitch R package released with this manuscript.
Interestingly no single feature drives the classification, indicating that the human experts are looking at multiple features of the signal to decide what is or is not a change. Nonetheless we performed ran-dom feature elimination and did identify that dynamic time warping alone achieves an accuracy of 65% (Supplementary Material, Fig. S5A). Dynamic time warping is less sensitive to distortion caused by local misalignments, a quality that makes the technique useful in speech recognition and likely contributes to the feature’s success in our classifier (Sakoe and Chibe, 1978). We also ranked the eight fea-tures by their importance and see that each feature increases accur-acy incrementally when added to the model in approximately equal increments. Plotting the WT to mutant Pearson correlation coeffi-cient and contiguousness versus dynamic time warping (Supplementary Material, Fig. S5B) reveals how these features cor-relate but also illustrates subtle differences in how these different features classify change.
We illustrate the basic dynamic time warping principle in
Supplementary Material, Figure S4Aand how we score differences based on this trace alignment strategy. The score increases as the two traces differ and is calculated over the entire alignment. Dynamic time warping is visualized on the U99A data in
Supplementary Materials, 4B. It identifies the minimum number of insertions and deletions to optimally align the mutant and WT traces. As such, a higher dynamic time warping score indicates greater differences in the traces. It is therefore likely that the expert humans are performing some form of trace alignment combined with pattern matching when evaluating the data. Processing SHAPE data (whether it is obtained by capillary or next generation sequenc-ing) requires an alignment strategy. It is not surprising that humans may choose to ignore small frame shifts in the data (which lead to very high eSDC values) since they know these are most likely errors in trace alignment (Supplementary Material, Fig. S6).
Overall, the classSNitch performance (purple line Fig. 3A) is equivalent to human consensus for none, local and global change. The cobweb plot reveals that the highest error rate in classSNitch
classification is false negatives for local change (Fig. 3B). In com-parison to eSDC and the Euclidean distance (green and blue AUC, respectively) our classifier performs significantly better. Thus classSNitch is a good approximation of human expert classification of SHAPE trace differences and applying it to high-throughput mu-tational datasets can simulate human consensus classification of these data.
3.4 classSNitch analysis of experimental
structure change
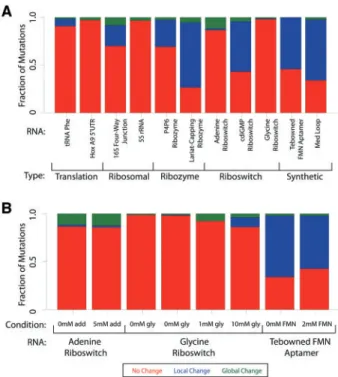
The training data used for the development of the classSNitch classi-fier (Table 1) represents a small subset of publically available muta-tional SHAPE data (Corderoet al., 2012). We identified a total of 2019 SHAPE traces for eleven different RNAs (Supplementary Material, Table S1). We classified these using the classSNitch algo-rithm excluding the training set of 167 RNAs. In this dataset we identified 382 local changers (19%), and 111 global changers (5%). When these data are further broken down by RNA (Fig. 4A) we im-mediately observe significant differences in the sensitivity of muta-tion in these RNAs. Some RNAs, like the homeobox (Hox) A9 50UTR, are more resistant to mutations. The Hox mRNAs are
involved in development, and the 50UTR plays an important role in
ribosome-mediated translational control. It is highly structured and folding to a specific conformation is essential to function (Alexander
et al., 2009;Xueet al., 2015). Similarly, the phenylalanine-transfer RNA, 16S four-way junction and 5S ribosomal RNA are also rela-tively resistant to mutation. Other RNAs are more sensitive to muta-tions, like the synthetic Tebowned aptamer that was designed in the Eterna laboratory as part of their online game (Cordero and Das, 2015; Leeet al., 2014). RNAs folded in different solution condi-tions, such as aptamers in the absence or presence of their ligand, re-spond differently to mutation as well (Fig. 4B). For the adenine and glycine riboswitches, ligand binding increases the RNA’s sensitivity to mutations. The synthetic Tebowned aptamer has decreased Fig. 3. classSNitch performance. (A) ROC curve analysis comparing methods for classifying structure change to the majority consensus by experts. The ROC curves are depicted for performance in identifying non-changers (red), local changers (blue) and global changers (green). The methods used for ex-perimental classification are classSNitch (purple), eSDC (green), Euclidean norm (blue) and the mean expert human performance (black). Consistently, classSNitch performs comparably to the mean expert evaluation. classSNitch outperforms eSDC and the Euclidean norm, which are the current metrics for
classifying RNA structure change in SHAPE data. (B) The cobweb plot shows
the percentage of traces mislabeled by classSNitch; a higher percentage of local changers are misclassified (Color version of this figure is available at
Bioinformaticsonline.)
Table 1.Expert evaluation summary
Survey statistics
Total Traces 200
Total Experts 14
Total Responses 1427
Mean Trace Coverage 7.24
SD Trace Coverage 2.78
Mean Expert Agreement (%) 79.75
SD Expert Agreement (%) 0.79
Expert Reproducibility (%) 79.70
Total Non-Changers (Majority Consensus) 107
Total Local Changers (Majority Consensus) 40
Total Global Changers (Majority Consensus) 20
sensitivity to mutations when in the presence of ligand. The chem-ical modifier used in chemchem-ical mapping experiments also affects the SHAPE data and ultimately sensitivity to structure change (Supplementary Material, Fig. S7). N-methlyiastoic anhydride (NMIA) is less reactive and requires a longer time to react than 1-methyl-7 nitroisatoic anhydride (1M7) (Mortimer and Weeks, 2007). Given the kinetics of the reaction, it is not surprising that 1M7 can detect more subtle differences in structure that could be occurring on a shorter time scale.
Most structure prediction programs have low accuracy when identifying experimental riboSNitches with AUC values ranging from 0.6 to 0.7 (Corleyet al., 2015; Ritz et al., 2012). In these benchmark studies, validation of the experimental data is analyzed using simple metrics like eSDC or the Euclidean distance (Corley
et al., 2015; Ritz et al., 2012). One possible explanation for the poor predictive performance of the prediction algorithms in these benchmark studies is misclassification of the experimental data with these simple metrics. Indeed, when we observe the performance of SNPfold on data classified with either eSDC or Euclidean difference, the AUC values indicate the algorithm is barely predictive (Fig. 5A). We observe a subtle improvement in performance when we use the classSNitch classification of the experimental data. A similar per-formance increase is observed for the other published algorithms de-signed for riboSNitch prediction (Fig. 5B) (Halvorsenet al., 2010;
Sabarinathanet al., 2013;Salariet al., 2013). Thus, misclassifica-tion of experimental data is likely a confounding factor for the poor performance of riboSNitch prediction algorithms, and the use of
classSNitch in future benchmarking studies may improve prediction accuracy. Details on algorithm parameters can be found inMethods Supplementary, Section S3.4.
The mutational strategy data is based primarily on four types of transversion mutations (Kladwang et al., 2011a,b,c) as seen in
Supplementary Material, Table S4. The data presented in this table indicates mutating C or G in the WT sequence is more likely to in-duce structure change than mutating A or U with an odds ratio of 1.9,P<0.001. We also observed that low SHAPE reactivity in the experimentally predicted WT structure is more likely to lead to structure change when mutated (OR¼1.4,P<0.05).
3.5 WT SHAPE informed riboSNitch detection
It is well established that incorporating SHAPE into RNA structure folding algorithms improves secondary prediction performance (Diegan et al., 2009). Since we use SHAPE data to detect riboSNitches, it does not make sense to include experimental data for the WT and mutant in structure predictions. Nonetheless our analysis of sequence composition and WT SHAPE data for local and global changers does suggest an alternative. Can the WT SHAPE trace alone inform riboSNitch predictions? This is an attractive strategy since ultra high-throughput techniques exist to collect WT data on a genome-wide scale (Siegfriedet al., 2014).
The major bottleneck in collecting systematic mutational infor-mation is the molecular biology required to synthesize and validate each mutant. When we modify the SNPfold algorithm scoring to Table 2.Features used to quantify differences between WT and mutant traces
Feature Formula Description
Pearson CC PCC(SHAPE
ref, SHAPEalt)
Pearson correlation coefficient is the covariance between the wild type and mutant trace SHAPE values divided by their standard deviations. Additional descriptions can be found in
Supplementary Material, Figure S3
Pattern CC PCC(Change
ref, Changealt)
Pattern correlation coefficient is the Pearson correlation coefficient between wild type and mu-tant trace patterns. The trace pattern is given by increase (þ1), decrease (-1) or no change (0) in SHAPE value moving from one nucleotide to the next across the entire length of the RNAs. The pattern change between wild type and mutant traces are positions where the trace patterns different. Additional descriptions can be found inSupplementary Material, Figure S3
Contiguousness # of icontiguous Contiguousness is the number of contiguous stretches of pattern change between wild type and mutant traces. See Pattern CC. Additional descriptions can be found inSupplementary Material, Figure S3
Change Range max(idiff) – min(idiff) Change range is the interval containing all pattern changes between wild type and mutant traces. See Pattern CC. Additional descriptions can be found inSupplementary Material, Figure S3
Change Variance Ri(idiff-mean(idiff))/N Change variance is the spread of pattern change distances between the wild type and mutant traces. The pattern change distance is the distance away from the mutation site (in nucleotides) that a pattern change occurs. See Pattern CC. Additional descriptions can be found in
Supplementary Material, Figure S3
Dynamic time warping dynamic time warping algorithm
Dynamic time warping is an algorithm to optimally align wild type and mutant traces by ‘warp-ing’ one into the other (Giorgino, 2009). Dynamic time warping aligns two series on the sides of a grid. The distance between each point in the two series is calculated for every position in the grid. Summing over the minimum distance path along the grid gives the overall distance. Additional descriptions can be found inSupplementary Material, Figure S4
eSDC (1-PCC(SHAPE
ref, SHAPEalt)*sqrt(N)
Experimental structural disruption coefficient is 1 minus the Pearson correlation coefficient be-tween the wild type and mutant traces, normalized by the square root of the length of the RNA (Ritz, et. al, 2012). See Pearson CC. Additional descriptions can be found in
Supplementary Material, Figure S3
Euclidean Norm Ri(SHAPEref [i]-SHAPEalt[i])2
Euclidean norm is the L2-norm or distance between the wild type and mutant traces. The dis-tance is calculated as the sum over the squared difference between wild type and mutant traces. Additional descriptions can be found inSupplementary Material, Figure S3
include WT SHAPE data and to take into account the type of muta-tion (Equation 1), we are able to improve the performance of our al-gorithm further (Fig. 5B). Thus the WT SHAPE data is useful in increasing the accuracy of riboSNitch prediction.
4 Discussion
Identifying mutations that are likely to lead to changes in RNA struc-ture remains a significant computational and experimental challenge (Chauhan and Woodson, 2008;Chenget al., 2005;Churkinet al., 2011;Russellet al., 2002a,b). Such predictions are important in the context of personalized medicine since many riboSNitches are now known to be causative of human disease (Solemet al., 2015). Despite the advent of experimental technology enabling us to probe structure on a genome-wide scale, we still rely on structure change prediction algorithms or visual interpretations of the data to detect riboSNitches as there is no ultra-high throughput approach for rap-idly mutating an RNA (Ritzet al., 2012;Rocca-Serraet al., 2011;
Sansoneet al., 2012;Siegfriedet al., 2014).
We hypothesized that one reason for the poor performance of RNA structure prediction algorithms (Corley et al., 2015; Ritz
et al., 2012) on riboSNitches is the misclassification of the experi-mental data. We therefore set out to develop novel metrics to evaluate structure change from SHAPE data. This approach did lead to modest improvements in performance suggesting that care-ful analysis of SHAPE data is essential when using these data as a benchmark. In this age of whole transcriptomic structure probing, manual validation and curation of these datasets is impractical. The classSNitch classifier simulates human consensus on what is
and is not a structure change and therefore offers an alternative to simple metrics like eSDC in experimentally describing RNA struc-ture change.
The features that classSNitch uses to classify change reveals some of the subtleties involved in interpreting SHAPE data. Beyond evalu-ating the magnitude difference between traces, human experts also utilize information on pattern matching and the distribution of change along the length of the RNA (Supplementary Material, Figs S3 and S4). We used those features to develop a classifier that suc-cessfully mimics expert classification of structure change (Fig. 3). SHAPE reactivity is correlated with secondary structure, more react-ive nucleotides are generally single stranded (Eddy, 2014); however the experiment probes the overall structure of the RNA. The classSNitch classifier does not attempt to model structure, but instead establishes a standard for quantifying change. This is biologically relevant, allowing us to compare different RNAs using a standard vo-cabulary (Fig. 4). Although only two synthetic RNAs are included in our dataset, there is a striking difference in their sensitivity to muta-tion (Fig. 4A). Indeed a much larger fraction of the mutations in these RNAs result in conformational rearrangement. Although with only two RNAs it is impossible to draw statistical conclusions, this obser-vation remains biologically interesting and warrants further investi-gation as more experimental data is obtained on a wide variety of RNAs (both synthetic and naturally occurring). The idea that RNA sequences under natural evolutionary pressure may evolve a general robustness to mutation warrants further investigation.
The data used for training classSNitch was exclusively collected using traditional capillary methods of electrophoresis. The quantifi-cation of this type of data from a capillary trace is a challenge, as it requires alignment to a reference ladder (Daset al., 2005;Karabiber
et al., 2013;Mitraet al., 2008). Recent algorithmic developments have further automated this process and increased reliability (Yoon
et al., 2011). It is interesting that dynamic time warping is the most significant feature used by classSNitch in reproducing expert classifi-cation. If alignment errors were to persist in the data, one might ex-pect that experts could be correcting these when gazing at the data. Fig. 4. Fraction of disruption for individual RNAs. (A) The fraction of
muta-tions that cause no change (red), local change (blue) or global change (green) for each RNA as classified by classSNitch. The RNAs are grouped by biolo-gical function: translation, ribosomal, ribozyme, riboswitch or synthetic. The
experimental conditions for each of these RNAs are listed inSupplementary
Material, Table S1. (B) The fraction of mutations that cause aptamers to change structure in the absence or presence of differing amounts of ligand for the adenine riboswitch, glycine riboswitch and Tebowned FMN aptamer (Color version of this figure is available atBioinformaticsonline.)
Fig. 5. Improving the performance of structure change prediction algorithms (Halvorsenet al., 2010;Sabarinathanet al., 2013;Salariet al., 2013). (A) We performed ROC curve analysis for SNPfold, a structure change prediction al-gorithm, using classSNitch (purple), eSDC (green) and the Euclidean norm
(blue) to classify the experimental data using the 10% tails strategy (Corley
et al., 2015). (B) We compare the performance of structure change prediction algorithms on the classSNitch classification for SNPfold (purple), RNAsnp (green) and RemuRNA (blue). Each of these algorithms predicts structure change in RNA using only sequence information. SNPfold, remuRNA and
RNAsnp all makeab initiopredictions on whether a mutation alters the RNA
structure; none of the algorithms benchmarked used SHAPE-directed struc-ture prediction since we are using the WT and mutant SHAPE data for experi-mental validation. We improved the SNPfold prediction (dark purple) using Equation 1. The ROC curves for local and global change predictions are
included inSupplementary Materials, Figure S8(Color version of this figure
As technology has evolved, in particular with the use of next gener-ation sequencing to collect chemical and enzymatic probing data (Kerteszet al., 2010;Mortimeret al., 2012;Rouskinet al., 2014;
Siegfriedet al., 2014) alignment artifacts may disappear in the data. As such it may become necessary to retrain classSNitch on these newer types of data. In our lab’s limited experience with these types of data (currently unpublished), classSNitch performance is similar regardless of the type of data analyzed. However, it will be necessary to continue evaluating classSNitch performance as new experimen-tal modalities are used. SHAPE data measures the selective reactivity of a probe for the 20OH of the RNA (Dieganet al., 2009). As such,
the direct relationship between structure and reactivity is complex and ultimately depends on the 3-D structure of RNA. As a result, differences in SHAPE data due to mutation (or exogenous molecule binding) are notoriously difficult to interpret (Kutchko and Laederach, 2017). This does not however mean that SHAPE data does not contain useful information. Our use of the WT SHAPE data to improve riboSNitch predictions (Equation 1,Fig. 5B) indi-cates that much as including SHAPE as a free energy term in struc-ture prediction (Dieganet al., 2009), aspects of the reactivity can inform predictions. It is likely that the improvement we observe when usingEquation 1, which does not include any free energy terms, is due to the fact that in general, higher SHAPE reactivities are indicative of unpaired nucleotides (Eddy, 2014; Kutchko and Laederach, 2017). The by effectively adjusting the SNPfold score for nucleotides that are likely unpaired in the WT structure, which also are less likely to cause a riboSNitch, we observe a modest improve-ment in prediction performance. This effect remains modest since the correlation between SHAPE reactivity and base-pair probability is only moderate (Kutchko and Laederach, 2017).
Although classSNitch was trained on riboSNitches and is pri-marily intended as a tool to evaluate the effect of mutation induced structure change, it is in fact a more general metric for comparing SHAPE data. RNAs will adopt alternative conformations depend-ing on their environment. For example riboswitches adopt differ-ent conformations depending on the presence of the ligand. When applied to the WT traces of apo and bound riboswitch data, the al-gorithm does identify local and global change for a majority of riboswitches, as expected. Protein binding, changes in cellular en-vironment and even counter-ions are known to affect RNA struc-ture (Baiet al., 2005;Frederiksenet al., 2012). The classSNitch classifier provides a common language to describe these differ-ences. For example, it could be used when comparingin vivoand in vitroprobing of the RNA to identify regions where the presence of proteins alters structure locally and globally. It also offers an at-tractive way to quantify these changes in agreement with expert consensus.
Manual classification of traces remains a laborious process, and is the main reason we developed the classSNitch classifier. We lim-ited our training set to 200 traces and were able to recruit 17 experts to classify a majority of these traces. Certainly, a larger number of manual classifications will further improve the performance and precision of our classifier, especially for difficult cases. As such it is important when using the classSNitch classifier to be aware of the limited size of the training set and exercise care in evaluating the predictions on novel data. In particular, the performance of the clas-sifier was with only 5 cross-validation folds in lieu of an independ-ent test set, and as such is likely still somewhat partial. Nonetheless our data do suggest that it will be possible to arrive at a consensus for what a small and large RNA structure change look like and that the approach we present here is viable for developing a community standard.
The agreement between human experts ‘gazing’ at this data is reassuring. Prior to quantitative methods being widely available to life scientists, significant progress was achieved by carefully looking at the data; the structure of group I introns, tRNA and the ribosome were correctly predicted manually years before they were crystal-lized (Michel and Westhof, 1990). The value of automated systems that reproduce human appreciation of data is underutilized in RNA structural research despite the rich history of success in the field. Developing the classSNitch classifier minimally captures dying ex-pert knowledge, while also making this exex-pertise accessible to the community in an automated package.
Acknowledgements
We thank members of the Laederach and Weeks labs for their contribution to our survey questions and for looking at a heroic number of SHAPE traces. Evonne MacArthur, Katrina Kutchko, Lela Lackey, Meredith Corely, Matthew Smola, Sarah Marks, Aaztli Coria, Elizabeth Dethoff, Anthony Mustoe, Benjamin Keith, Amanda Solem and Ruslan Soldatov.
Funding
This work was supported by the U.S. National Institutes of Health [grant numbers HL111527, GM101237 and HG008133 to A.L.].
Conflict of Interest: none declared.
References
Alexander,T.et al. (2009) Hox genes and segmentation of the hindbrain and axial skeleton.Annu. Rev. Cell. Dev. Biol.,25, 431–456.
Bai,Y.et al. (2005) Probing counterion modulated repulsion and attraction be-tween nucleic acid duplexes in solution.Proc. Natl. Acad. Sci. U. S. A.,102, 1035–1040.
Breiman,L. (2001) Random forests.Mach. Learn.,45, 5–32.
Brenowitz,M.et al. (1986a) ‘Footprint’ titrations yield valid thermodynamic isotherms.Proc. Natl. Acad. Sci. U. S. A.,83, 8462–8466.
Brenowitz,M.et al. (1986b) Quantitative DNase footprint titration: a method for studying protein-DNA interactions.Methods Enzymol.,130, 132–181. Butler,E.et al. (2011) Structural basis of cooperative ligand binding by the
gly-cine riboswitch.Chem. Biol.,18, 293–298.
Chauhan,S. and Woodson,S.A. (2008) Tertiary interactions determine the ac-curacy of RNA folding.J. Am. Chem. Soc.,130, 1296–1303.
Cheng,C.Y.et al. (2015) Consistent global structures of complex RNA states through multidimensional chemical mapping.Elife,4, e07600.
Cheng,Z.et al. (2005) Crystal structure and functional analysis of DEAD-box protein Dhh1p.RNA,11, 1258–1270.
Churkin,A.et al. (2011) The RNAmute web server for the mutational analysis of RNA secondary structures.Nucleic Acids Res.,39, W92–W99. Cordero,P. and Das,R. (2015) Rich RNA structure landscapes revealed by
mutate-and-map analysis.PLoS Comput. Biol.,11, e1004473.
Cordero,P.et al. (2012) An RNA Mapping DataBase for curating RNA struc-ture mapping experiments.Bioinformatics,28, 3006–3008.
Corley,M.et al. (2015) Detecting riboSNitches with RNA folding algorithms: a genome-wide benchmark.Nucleic Acids Res.,43, 1859–1868.
Cruz,J.A.et al. (2012) RNA-Puzzles: a CASP-like evaluation of RNA three-dimensional structure prediction.RNA,18, 610–625.
Das,R.et al. (2005) SAFA: semi-automated footprinting analysis software for high-throughput quantification of nucleic acid footprinting experiments.
RNA,11, 344–354.
Das,R.et al. (2008) Structural inference of native and partially folded RNA by high-throughput contact mapping.Proc. Natl. Acad. Sci. U. S. A.,105, 4144–4149.
Deras,M.L.et al. (2000) Folding mechanism of the Tetrahymena ribozyme P4-P6 domain.Biochemistry,39, 10975–10985.
Eddy,S. (2014) Computational analysis of conserved RNA secondary structure in transcriptomes and genomes.Annu. Rev. Biophys.,43, 433–456. Frederiksen,J.et al. (2012) Metal-ion rescue revisited: biochemical detection
of site-bound metal ions important for RNA folding.RNA,18, 1123–1141. Giorgino,T. (2009) Computing and visualizing dynamic time warping
alignm-nets in R: The dtw Package.J. Stat. Softw.,31, 1–24.
Hall,M.et al. (2009) The WEKA data mining software: an update.SIGKDD Explor.,11,
Halvorsen,M.et al. (2010) Disease-associated mutations that alter the RNA structural ensemble.PLoS Genet.,6, e1001074.
Karabiber,F.et al. (2013) QuShape: rapid, accurate, and best-practices quanti-fication of nucleic acid probing information, resolved by capillary electro-phoresis.RNA,19, 63–73.
Kertesz,M.et al. (2010) Genome-wide measurement of RNA secondary struc-ture in yeast.Nature,467, 103–107.
Kladwang,W.et al. (2011a) A mutate-and-map strategy accurately infers the base pairs of a 35-nucleotide model RNA.RNA,17, 522–534.
Kladwang,W.et al. (2011b) A two-dimensional mutate-and-map strategy for non-coding RNA structure.Nat. Chem.,3, 954–962.
Kladwang,W.et al. (2011c) Understanding the errors of SHAPE-directed RNA structure modeling.Biochemistry,50, 8049–8056.
Kuhn,M. (2008) Building predictive models in R using the caret package.
J. Stat. Softw.,28,
Kutchko,K.M. and Laederach,A. (2017) Transcending the prediction para-digm: novel applications of SHAPE to RNA function and evolution.Wiley Interdiscip Rev RNA.,8, e1374.
Kutchko,K.M.et al. (2015) Multiple conformations are a conserved and regu-latory feature of the RB1 50UTR.RNA,21, 1274–1285.
Lee,J.et al. (2014) RNA design rules from a massive open laboratory.Proc. Natl. Acad. Sci. U. S. A.,111, 2122–2127.
Liaw,A. and Wiener,M. (2002) Classification and regression by randomForest.
R. News,2, 18–22.
Lokody,I. (2014) RNA: riboSNitches reveal heredity in RNA secondary struc-ture.Nat. Rev. Genet.,15, 219.
Martin,J.S.et al. (2012) Structural effects of linkage disequilibrium on the transcriptome.RNA,18, 77–87.
Miao,Z.et al. (2015) RNA-Puzzles Round II: assessment of RNA structure prediction programs applied to three large RNA structures. RNA, 21, 1066–1084.
Michel,F. and Westhof,E. (1990) Modelling of the three-dimensional architec-ture of group I catalytic introns based on comparative sequence analysis.
J. Mol. Biol.,216, 585–610.
Mitra,S.et al. (2008) High-throughput single-nucleotide structural mapping by capillary automated footprinting analysis.Nucleic Acids Res.,36, e63. Mortimer,S.et al. (2012) SHAPE-Seq: high-throughput RNA structure
ana-lysis.Curr. Protoc. Chem. Biol.,4, 275–297.
Mortimer,S.A. and Weeks,K.M. (2007) A fast-acting reagent for accurate ana-lysis of RNA secondary and tertiary structure by SHAPE chemistry.J. Am. Chem. Soc.,129, 4144–4145.
Petri,V. and Brenowitz,M. (1997) Quantitative nucleic acids footprint-ing: thermodynamic and kinetic approaches.Curr. Opin. Biotechnol.,8, 36–44.
Rice,G.M.et al. (2014) RNA secondary structure modeling at consistent high accuracy using differential SHAPE.RNA,20, 846–854.
Ritz,J.et al. (2012) Evaluating our ability to predict the structural disruption of RNA by SNPs.BMC Genomics,13, S6.
Rocca-Serra,P.et al. (2011) Sharing and archiving nucleic acid structure map-ping data.RNA,17, 1204–1212.
Rouskin,S.et al. (2014) Genome-wide probing of RNA structure reveals active unfolding of mRNA structures in vivo.Nature,505, 701–705.
Rowles,T.A. (2013) Power to the people: does Eterna signal the arrival of a new wave of crowd-sourced projects?.BMC Biochem.,14, 26.
Russell,R.et al. (2002a) Rapid compaction during RNA folding.Proc. Natl. Acad. Sci. U. S. A.,99, 4266–4271.
Russell,R.et al. (2002b) Exploring the folding landscape of a structured RNA.
Proc. Natl. Acad. Sci. U. S. A.,99, 155–160.
Sabarinathan,R.et al. (2013) RNAsnp: efficient detection of local RNA sec-ondary structure changes induced by SNPs.Hum. Mutat.
Saeys,Y.et al. A review of feature selection techniques in bioinformatics.
Bioinformatics,23, 2507–2517.
Saeys,Y.et al. (2007) A review of feature selection techniques in bioinfor-matics.Bioinformatics, 2007,19.
Sakoe,H. and Chibe,S. (1978) Dynamic programming algorithm optimization for spoken word recognition.IEEE Trans. Acoust. Speech Signal Process, 26, 43–49.
Salari,R.et al. (2013) Sensitive measurement of single-nucleotide polymorph-ism-induced changes of RNA conformation: application to disease studies.
Nucleic Acids Res.,41, 44–53.
Sansone,S.A.et al. (2012) Toward interoperable bioscience data.Nat. Genet., 44, 121–126.
Sclavi,B.et al. (1997) Time-resolved synchrotron X-ray ‘footprinting’, a new approach to the study of nucleic acid structure and function: applica-tion to protein-DNA interacapplica-tions and RNA folding.J. Mol. Biol.,266, 144–159.
Siegfried,N.A.et al. (2014) RNA motif discovery by SHAPE and mutational profiling (SHAPE-MaP).Nat. Methods,11, 959–965.
Solem,A.C.et al. (2015) The potential of the riboSNitch in personalized medi-cine.Wiley Interdiscip. Rev. RNA,6, 517–532.
Takamoto,K.et al. (2004) Principles of RNA compaction: insights from the equilibrium folding pathway of the P4-P6 RNA domain in monovalent cat-ions.J. Mol. Biol.,343, 1195–1206.
Tian,S. et al. (2014) High-throughput mutate-and-map rescute elevates SHAPE-directed RNA structure and uncovers excited states. RNA,20, 1815–1826.
Treuille,A. and Das,R. (2014) Scientific rigor through videogames.Trends Biochem. Sci.,39, 507–509.
Waldispuhl,J. and Reinharz,V. (2015) Modeling and predicting RNA three-dimensional structures.Methods Mol. Biol.,1269, 101–121.
Wan,Y.et al. (2012) Genome-wide measurement of RNA folding energies.
Mol. Cell,48, 169–181.
Wan,Y.et al. (2014) Landscape and variation of RNA secondary structure across the human transcriptome.Nature,505, 706–709.
Xue,S.et al. (2015) RNA regulons in Hox 50UTRs confer ribosome specificity to gene regulation.Nature,517, 33–38.
Yoon,S.et al. (2011) HiTRACE: high-throughput robust analysis for capillary electrophoresis.Bioinformatics,27, 1798–1805.
![29H,31H Tetrabenzo[b,g,l,q]porphin](data:image/gif;base64,R0lGODlhAQABAIAAAP///wAAACH5BAEAAAAALAAAAAABAAEAAAICRAEAOw==)