Executive functions and the
v
-6-to-
v
-3 fatty acid ratio: a
cross-sectional study
1,2Kelly W Sheppard3,4and Carol L Cheatham3,5*
3Department of Psychology and Neuroscience, University of North Carolina at Chapel Hill, Chapel Hill, NC;4Center for Biobehavioral Health, The Research
Institute at Nationwide Children’s Hospital, Columbus, OH; and5Nutrition Research Institute, University of North Carolina at Chapel Hill, Kannapolis, NC
ABSTRACT
Background:Thev-6 (n–6) to v-3 (n–3) fatty acid (FA) ratio (n–6:n–3 ratio) was previously shown to be a predictor of executive function performance in children aged 7–9 y.
Objective: We aimed to replicate and extend previous findings by exploring the role of the n–6:n–3 ratio in executive function performance. We hypothesized that there would be an interaction between n–3 and the n–6:n–3 ratio, with children with low n–3 performing best with a low ratio, and those with high n–3 performing best with a high ratio. Design:Children were recruited on the basis of their consumption of n–6 and n–3 FAs. The executive function performance of 78 children aged 7–12 y was tested with the use of the Cambridge Neuropsychological Test Automated Battery and a planning task. Participants provided blood for plasma FA quantification, and the caregiver completed demographic and activity questionnaires. We investigated the role of the n–6:n–3 ratio in the entire sample and separately in children aged 7–9 y (n= 41) and 10–12 y (n= 37). Results:Dietary and plasma n–6:n–3 ratio and n–3 predicted per-formance on working memory and planning tasks in children 7–12 y old. The interaction between dietary n–6:n–3 ratio and n–3 pre-dicted the number of moves required to solve the most difficult planning problems in children aged 7–9 y and those aged 10– 12 y, similar to results from the previous study. There was also an interaction between the plasma n–6:n–3 ratio and n–3 predicting time spent thinking through the difficult 5-move planning problems. The n–6:n–3 ratio and n–3 predicted executive function perfor-mance differently in children aged 7–9 y and in those aged 10–12 y, indicating different optimal FA balances across development. Conclusions:The n–6:n–3 ratio is an important consideration in the role of FAs in cognitive function, and the optimal balance of n–6 and n–3 FAs depends on the cognitive function and developmental period studied. This trial was registered at clinicaltrials.gov as NCT02199808. Am J Clin Nutr2017;105:32–41.
Keywords: fatty acids, executive functions, middle childhood, CANTAB, Electric Maze Task
INTRODUCTION
Scientists increasingly have come to understand the impor-tance of the ratio of n–6 to n–3 fatty acids (FAs)6 to cognitive function (1–6). In particular, cognitive functions subserved by the hippocampus and frontal cortex, such as memory and
executive functions, are sensitive to imbalances in the n–6:n–3 ratio because of the presence of high n–6 and n–3 FAs (7), as well as the role of n–6 and n–3 in neurotransmitter concentra-tions (8, 9), receptor density and function (10, 11), and neuronal growth (12, 13) in those brain areas. The n–6 and n–3 FAs compete for metabolic resources; thus, an imbalance of n–6 and n–3 FAs in the diet decreases the products of one or another of the FA metabolic pathways (14–18). It has been found that providing a balanced n–6:n–3 ratio leads to similar concentra-tions of n–6 and n–3 FAs in the brain, whereas providing an imbalanced n–6:n–3 ratio produces deficiencies in n–3 FAs, regardless of the amount of specific FAs in the diet (19).
Deficits in n–3 FAs have been linked to poor spatial working memory (20, 21) and olfactory discrimination and learning (22, 23) in rodent models, but results of studies with n–3 supplementation in humans have been mixed (24, 25). It is possible that attention to the n–6:n–3 ratio would reveal more consistent results in supplemen-tation studies. It is known that supplementing infant formula with n–6 and n–3 is more likely to produce scores that either match a breastfed reference or outperform a DHA-only group (26–28). High n–6:n–3 ratios have been shown to negatively affect working memory (29) and learning (30) performance in rodents, and to predict worse planning performance in middle childhood (1). Im-portantly, the cognitive functions observed (memory and executive functions) in these investigations of the n–6:n–3 ratio are subserved by the frontal cortex and hippocampus.
1This work was funded by monies granted to CLC from the University of
North Carolina at Chapel Hill (UNC-CH) Nutrition Research Institute, and to KWS through a Sigma Xi Grants in aid of Research grant, a Dashiell Dissertation Start-Up Grant from the UNC-CH Psychology and Neurosci-ence Department, a predoctoral fellowship from the UNC-CH Center for Developmental Science (NICHD T32-HD07376), and a Dissertation Com-pletion Fellowship from the UNC-CH Graduate School.
2
Supplemental Tables 1 and 2 are available from the “Online Supporting Material” link in the online posting of the article and from the same link in the online table of contents at http://ajcn.nutrition.org.
*To whom correspondence should be addressed. E-mail: carol_cheatham@ unc.edu.
6
Abbreviations used: CANTAB, Cambridge Neuropsychological Test Auto-mated Battery; EMT, Electric Maze Task; FA, fatty acid; FADS, fatty acid desaturase; SOC, Stockings of Cambridge; SWM, Spatial Working Memory test.
Received July 6, 2016. Accepted for publication October 18, 2016. First published online November 16, 2016; doi: 10.3945/ajcn.116.141390.
With the present study (NCT02199808), we sought to replicate and extend previous findings (1). The higher-order cognitive functions collectively known as executive functions develop from early childhood into adulthood (31, 32), and executive functions such as working memory, inhibitory control, and planning are linked to math and reading abilities (33, 34). Executive functions require coordination of neuronal communication, and the cortical resources used change with development (35). Therefore, we posited that the nutrient support required for optimal development would also change. We previously showed an interaction between n–3 intake and the n–6:n–3 ratio when predicting performance on working memory and planning tasks in children aged 7–9 y (1). With the present study, we sought to replicate these findings in children aged 7–9 y with the use of the same cognitive task [Cambridge Neuropsychological Test Automated Battery (CANTAB)] and a newly developed validated planning task (36). As an extension, we also tested the n–6:n–3 ratio and n–3 hypothesis in older children (aged 10–12 y) to determine whether there were differences in the optimal balance of n–6 and n–3 FAs during the development of executive function abilities. As a further extension, plasma FAs were quantified.
METHODS
Participants
Seventy-eight children aged 7–12 y were recruited from the southeastern United States. Children were excluded if they had any developmental delays, such as diagnoses of attention-deficit/ hyperactivity disorder, autism spectrum disorder, or fetal alcohol spectrum disorder. Fifty-one percent of participants were fe-male, with 92% identifying as Caucasian, 4% identifying as
African American, 1% identifying as Asian, and 3% identifying as mixed race. Nine percent of the sample self-identified as Hispanic or Latino. A high percentage (67%) of mothers had at least a college degree. The descriptive statistics for the sample are shown in Table 1. Parents provided written consent, and children provided written assent to participate in the study. The procedures were approved by and conducted in accordance with the ethical standards of the University of North Carolina at Chapel Hill’s institutional review board. Data collection began April 2014 and ended August 2015.
Study design
Screening
All children were screened for n–6 and n–3 FA intake with the use of 24-h diet recalls. We demonstrated in a previous study (1) that there were significant differences between children with low and high ratios relative to low and high intake of n–3 FAs. How-ever, a limitation of the previous study was that a disproportionate number of children consumed mean n–3 diets compared with high or low n–3 diets (e.g., only 6 children consumed a high n–3 diet, whereas 57 consumed a mean n–3 diet). To recruit a sample that better represented different consumption patterns, participants were recruited on the basis of their underlying n–6:n–3 intake ratios (high, mean, and low) and n–3 intake (high, mean, and low); we undersampled the more common diets to achieve a better balance between diet types. Cutoffs were determined by calculating tertile splits from the previous sample, and were checked against the current sample once sufficient participants had been screened. The flowchart for recruitment, screening, and inclusion in the final
TABLE 1
Participant characteristics1
Entire sample Children 7–9 y of age Children 10–12 y of age
Participants,n 78 41 37
Age, y 9.561.63 8.160.78 10.9760.75
Female 51.28 (40) 52.5 (21) 50 (19)
Breastfed (exclusively) 46.05 (35) 43.59 (17) 48.65 (18)
Mixed-fed 37.18 (29) 39.02 (16) 35.14 (13)
Formula-fed (exclusively) 18.42 (14) 20.51 (8) 16.22 (6) Maternal education
Less than high school diploma 1.33 (1) 0 2.78 (1)
High school diploma 21.33 (16) 23.08 (9) 19.44 (7)
Some college 10.67 (8) 12.82 (5) 8.33 (3)
College degree 42.67 (32) 43.59 (17) 41.67 (15)
Master’s degree 22.67 (17) 20.51 (8) 25 (9)
Professional degree 1.33 (1) 0 2.78 (1)
Physical activity (C-PAQ), min/d
Vigorous activity 47.9637.24 43.63634.36 52.92640.31 Moderate activity 94.51665.79 97.16663.32 91.57669.21
Light activity 11.82614.66 11.21614.81 12.5614.66
Sedentary time 386.836204.73 371.596193.7 403.776217.84 Plasma n–6:n–3 ratio 11.6862.34 11.5562.63 11.8761.96
Plasma n–6,mmol 4.9661.19 4.8961.41 5.0660.8
Plasma n–3,mmol 0.4460.14 0.4560.17 0.4460.1
Dietary n–6:n–3 ratio 9.7563.17 9.6863.21 9.8463.15 Dietary n–6 intake, g 13.3865.24 13.1665.27 13.6365.26
Dietary n–3 intake, g 1.4960.71 1.560.8 1.4860.6
1
laboratory visit is shown inFigure 1. The mean dietary n–6:n–3 ratios and n–3 intake for the participants are shown in Table 1 (Supplemental Table 1shows individual FAs).
Diet recalls were conducted with the use of common 4-pass methodology as described previously (37). Each participant and a caregiver who was aware of the child’s diet over the 24-h period were called 3 times to discuss what he or she had eaten the day before the phone call. The diet recalls occurred on 2 weekdays and 1 weekend day to obtain the best snapshot of a participant’s typical week. Data collection was guided by and entered into the Nutrition Data System for Research 2014, de-veloped by the Nutrition Coordinating Center, University of Minnesota, Minneapolis, Minnesota. The primary researcher who collected cognitive performance data remained unaware of FA group status. One hundred fifty-two children were screened to obtain the 78 in the final sample. G*Power was used to
de-termine that 75 participants were required to achieve $80%
power for the planned analyses based on the medium effect size (Cohen’sf2= 0.28) found in the previous study (1).
Behavioral testing
CANTAB.The CANTAB consists of standardized measures of cognitive function that have been computerized and a touch-screen instrument that automatically stores data as the partici-pants go through the test battery. The CANTAB offers several benefits: many tests can be done with minimal equipment, lan-guage ability does not skew results, and minimal reading and instructions are required. The tests chosen for this study were based on studies testing executive function that included children 7–12 y of age (38). The Motor Task and Reaction Time Task were used to ensure that participants could appropriately interact with the screen and to establish a baseline for participation; they were not included in the analyses. The tests providing outcome data are outlined below.
Stockings of Cambridge. Stockings of Cambridge (SOC) is a spatial planning task analogous to the Tower of London. Participants saw 2 sets of colored balls in “stockings” on the screen. The goal was to move the balls in the bottom set to look exactly like the balls displayed in the top set. There are rules that govern how the participants can move the balls. Participants were instructed to consider how to make the bottom screen look like the top screen before making any moves. The test started with pat-terns that only required 3 moves and then increased to 5 moves.
Spatial Working Memory.The Spatial Working Memory (SWM) is a working memory and planning task that incorporates a heuristic strategy. Participants saw boxes on the screen, each of which contained a blue token. Once a blue token was found, the box remained on the screen so that, to be successful, participants also had to remember which boxes had contained a blue token previously so as not to search there again. The test started with 4 boxes and increased to 8 boxes.
Paired Associates Learning. Paired Associates Learning is a spatial memory task requiring participants to identify where
FIGURE 1 Flowchart of participant recruitment, screening, and inclu-sion in the laboratory visit and analyses.
they have seen patterns on the screen. Participants were first shown a screen with 6 boxes. The boxes revealed patterns in random order. During the test trial, participants indicated, from memory, the location of each pattern. The number of patterns increased from 2 to 8 across the task.
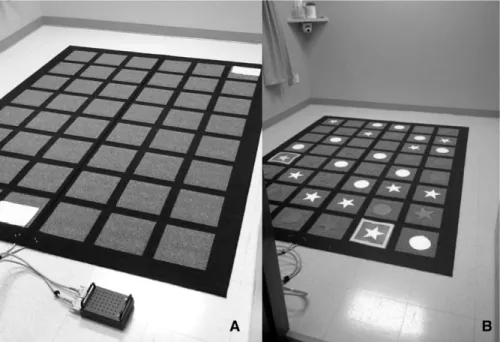
The Electric Maze Task. The Electric Maze Task (EMT) is a recently developed and validated measure of planning (36) that consists of a black carpet of 638 gray squares connected to a control box (Figure 2A). The researcher placed pegs in the control box to mark the correct path across the platform. Any square not marked as correct emitted a beeping sound if touched. Participants made their way across the platform while working out which squares were correct. Each time participants stepped on an incorrect square (signaled by beeping), they were required to back out of the maze and start again. The starting and ending squares were marked with light blue outlines so that participants always knew the goal and where to start again if they stepped on an incorrect square.
The paths were designed to alter the working memory and inhibitory control demands of the EMT. For working memory, the number of steps required to solve the maze began at 6 and was increased to 8, thereby increasing how much information must be held in mind to successfully complete the maze. To measure inhibitory control, a path design similar to the dimensional change card sort, a well-established measure of inhibitory control (39, 40), was used. Red and yellow stars and circles were placed on the maze squares (Figure 2B). The colored shapes appeared to be randomly distributed, but were carefully placed to create mazes made of only one color (red or yellow) or only one shape (star or circle). Participants were told that they were playing either the color game or the shape game, in turn (counter-balanced). In the color game, the children made their way across the platform while stepping only on shapes of a single color (randomly assigned either red or yellow). They completed both
6- and 8-step mazes with the color game rules. In the shape game, they made their way across the mat while stepping only on stars or circles. In this way, children had to inhibit a previous set of rules to successfully complete all mazes, and the inhibitory control demands were held constant while the working memory demands were increased. Participants completed a total of 4 mazes, and the starting game (color or shape) and starting location (1 of the 2 possible starting squares) were counter-balanced across participants.
Blood samples
Each participant provided a small blood sample with the use of a finger prick at the end of the cognitive testing session. One hundred microliters of whole blood was collected in lithium heparin tubes. The blood samples were immediately centrifuged at 48C for 10 min at 20003g, and 50 mL plasma was portioned by aliquot into tubes that were immediately stored in a2808C freezer until analysis. For FA quantification, plasma lipids were extracted with the use of a modification of the method by Bligh and Dyer (41). Lipids were transmethylated to methyl esters for gas chromatography with the use of the method described by Tacconi and Wurtman (42). FA identification and quantification was performed by injecting 1mL sample (1:20 split injection) on an Agilent 7890A gas chromatograph with flame ionization
detector and Agilent HP-88 (100 m30.25 mm30.2 um) under
conditions modified from previously described methods (43). FAs were identified according to retention time with the use of a methyl ester external standard mix and quantified against the internal standard.
Covariates
The caregiver provided information on general family de-mographics, including parental occupation and education, family
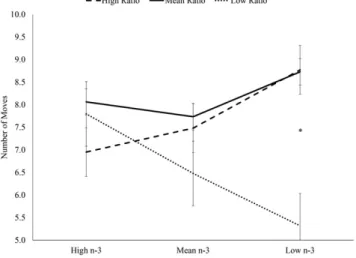
FIGURE 3 Interaction between dietary n–6:n–3 ratio and n–3 predict-ing mean moves required to solve the 5-move Stockpredict-ings of Cambridge planning problems in children aged 7–9 y. There was a significant main effect of ratio group [F(9, 27) = 3.68;P,0.05] and a ratio group by n–3 group interaction [F(3, 27) = 2.98;P,0.05], but no main effect of n–3 group [F(3, 27) = 2.63;P.0.05]. *Significant differences between the low ratio, low n–3 group (n= 2) and both the high ratio, low n–3 group (n= 7) and mean ratio, low n–3 group (n= 4). There were no significant differences between any other groups (high ratio, high n–3,n= 2; high ratio, mean n–3, n= 6; mean ratio, high n–3,n= 7; mean ratio, mean n–3,n= 6; low ratio, high n–3,n= 5; and low ratio, mean n–3,n= 2).
income, and mode of infant feeding. The caregiver also completed a questionnaire to capture the child’s regular physical activity. On the Child Physical Activity Questionnaire, the respondent esti-mated the total number of minutes the child spent across the previous 7 d engaged in activities common to children. These estimates were then summed as vigorous activity (e.g., soccer), moderate activity (e.g., swimming for fun), light activity (e.g., walking), and sedentary time (e.g., doing homework).
Data reduction and statistical analyses
Outcome variables from the CANTAB tasks were automatically calculated by the CANTAB software. Participants were videotaped while completing the EMT, and the videos were analyzed with Noldus EthoVision 8.5 software (44). Errors were coded online by the researcher, and the latency and distance measurements were automatically calculated by Noldus. Decisions regarding which outcome measures to include in the models were based on the previous study (1) for the CANTAB data and on the validation of the EMT (36) for the maze data. The n–6:n–3 ratio and n–3 intake were previously found to correlate with time spent thinking through the most difficult planning and working memory prob-lems: less time was related to improved performance (making fewer errors). Performance on the EMT was validated previously with error and latency measures from standardized planning and working memory problems on the CANTAB.
Plasma n–6 and n–3 were calculated by adding all measured n–6 FAs together and all measured n–3 FAs together. The n–6:n–3 ratios were calculated as the sum of plasma n–6 divided by the sum of plasma n–3. The appropriateness of covariates, such as BMI, breastfeeding in infancy, maternal education, physical activity, and age, was assessed with 1-factor ANOVA testing and from the literature. Maternal education was included in all models as a proxy for socioeconomic status and quality of pa-rental interactions. Age in months was also included as a co-variate when analyzing the entire sample.
Analyses were all completed with the use of SAS version 9.4. Data were assessed for violations of assumptions, such as
normality of distribution, homogeneity of variance, and outliers. No violations were found. In addition, no issue with multicollinearity
was found (see Supplemental Table 2 for correlation table).
First, multivariate ANOVAs were conducted with the use of the dietary n–6:n–3 ratio and n–3 groups to replicate previous findings (1), and Tukey post hoc tests were used to compare significant differences between groups. Then, data were sub-jected to a multivariable regression to determine the relation between the plasma n–6:n–3 ratio, plasma n–3, and measures of executive function. Models were analyzed across the entire sample and by age group (children aged 7–9 y and those aged 10–12 y) to extend our understanding of the importance of the ratio. PROC CALIS was used with full information maximum likelihood and Levenberg-Marquadt optimization to handle data missing as a result of refusals, low sample volume, and equipment failures (45). These data were determined to be missing at random, because no observed variable significantly predicted missingness.
RESULTS
Dietary FAs
In replicating previous findings, there were no significant in-teractions between the dietary n–6:n–3 ratio and n–3 intake when the sample was evaluated as a whole. In children aged 7–9 y, there was a significant interaction between dietary n–6:n–3 ratio and n–3 in-take predicting the number of moves required to solve the most difficult 5-move SOC planning problems (P ,0.05) (Figure 3). Specifically, the group with low n–6:n–3 ratio and low n–3 intake per-formed significantly better (required fewer moves) than the groups with high n–6:n–3 ratio and low n–3 intake and mean n–6:n–3 ratio and low n–3 intake. In children aged 10–12 y, there was also a sig-nificant interaction between dietary n–6:n–3 ratio and n–3 intake predicting the number of moves required to solve the most difficult 5-move SOC planning problems (P,0.05) (Figure 4). However, among older children, the group with low n–6:n–3 ratio and high n–3 intake performed significantly better than the group with high n–6:n–3
TABLE 3
Regression predicting between errors made on the 6-box Spatial Working Memory problems1
Estimate6SE T P
Entire sample (n= 78)
Intercept 43.9610.76 4.08 ,0.0001 n–6:n–3 Ratio 20.2360.52 20.45 0.65 Plasma n–3,mmol 27.1969.1 20.79 0.43 Age, mo 20.1860.03 25.19 ,0.0001 Maternal education 20.3960.39 21.0 0.32 Children aged 7–9 y (n= 41)
Intercept 16.85612.65 1.33 0.18
n–6:n–3 Ratio 0.3860.67 0.57 0.57 Plasma n–3,mmol 3.66611.36 0.32 0.75 Maternal education 20.5960.57 21.04 0.3 Children aged 10–12 y (n= 37)
Intercept 48.79618.94 2.58 0.01
n–6:n–3 Ratio 21.560.98 21.52 0.13 Plasma n–3,mmol 253.82617.5 23.08 0.002 Maternal education 20.0360.57 20.05 0.96
1Entire sample,R2= 0.28; children aged 7–9 y,R2 = 0.04; children
aged 10–12 y,R2= 0.37.
TABLE 2
Regression predicting between errors made on the 8-box Spatial Working Memory problems1
Estimate6SE T P
Entire sample (n= 78)
Intercept 65.48620.99 3.12 0.002
n–6:n–3 Ratio 1.960.97 1.96 0.05
Plasma n–3,mmol 20.9618.48 1.13 0.26 Age, mo 20.3660.06 25.71 ,0.0001 Maternal education 21.7760.68 22.62 0.01 Children aged 7–9 y (n= 41)
Intercept 9.7613.42 0.72 0.47
n–6:n–3 Ratio 3.0460.56 5.45 ,0.0001 Plasma n–3,mmol 44.55610.61 4.2 ,0.0001 Maternal education 22.0460.72 22.84 0.005 Children aged 10–12 y (n= 37)
Intercept 47.67641.9 1.14 0.26
n–6:n–3 Ratio 0.4562.21 0.2 0.84
Plasma n–3,mmol 240.94643.01 20.95 0.34 Maternal education 20.9961.06 20.93 0.35
1
ratio and high n–3 intake. Similar to the previous study, the children aged 7–9 y performed best on the most difficult planning problems with balanced intake (low ratio and low n–3). In extending these results to older children, children aged 10–12 y performed best with unbalanced intake, specifically high n–3 intake and a low n–6:n–3 ratio, implying greater importance of n–3 in these older children.
Plasma FAs
All ages
Generally, lower n–6:n–3 ratios and plasma n–3 predicted better performance when the sample was analyzed as a whole. The n–6:n–3 ratio predicted the number of times a participant erroneously searched in a box in which a token had already been found (between errors) during the most difficult 8-box SWM problems (P,0.05) (Table 2). Lower ratios predicted the in-cidence of fewer between errors on the most difficult problems, but the ratio did not predict the between errors made on the
simpler 6-box SWM problems (Table 3) or the time spent
searching for tokens (Table 4). The n–6:n–3 ratio and plasma n–3 (P, 0.05) (Table 5) predicted the number of moves re-quired to solve the most difficult 5-move SOC planning prob-lems. Lower ratios and plasma n–3 were associated with fewer moves required to solve the problems, which is indicative of better planning. The n–6:n–3 ratio predicted time spent thinking through the 5-move SOC problems (P,0.05) (Table 6), with lower ratios predicting less time spent thinking through the problems. There was also an interaction between the n–6:n–3 ratio and plasma n–3 predicting the time spent thinking through the 5-move SOC problems (P,0.05) (Figure 5). Children with lower plasma n–3 (1 SD below the mean) and mean plasma n–3 solved 5-move problems faster when they also had lower ratios. Children with higher plasma n–3 performed similarly regardless of their n–6:n–3 ratios. The n–6:n–3 ratio and plasma n–3 pre-dicted the repetitive errors made by participants on the 8-step EMT mazes (P,0.05) (Table 7). A repetitive error was coded each time the participant immediately returned to a square
already found to be incorrect. Lower ratios and lower plasma n–3 were associated with fewer repetitive errors made on the 8-step mazes.
Younger children (7–9 y of age)
The results for the children aged 7–9 y were very similar to the results for the entire sample. Lower n–6:n–3 ratios and plasma n–3 generally predicted better planning and working memory performance. The n–6:n–3 ratio and plasma n–3 predicted the number of between errors made on 8-box SWM problems
(P , 0.05) (Table 2). Lower n–6:n–3 ratios and plasma n–3
were associated with making fewer between errors. Neither the n–6:n–3 ratio nor plasma n–3 were related to the number of between errors made on the 6-box SWM problems (Table 3) or time spent searching for tokens in younger children (Table 4). The n–6:n–3 ratio predicted both the number of moves and time spent thinking through the 5-move SOC problems (P,0.05) (Tables 5 and 6). Plasma n–3 also predicted the number of moves re-quired to solve the 5-move SOC problems (P,0.05) (Table 5). Lower ratios and plasma n–3 were associated with better per-formance (fewer errors and less time spent thinking through problems). Lower ratios predicted fewer errors made on the 6-step EMT mazes (P,0.05) (Table 8), and lower ratios and plasma n–3 predicted fewer repetitive errors made on the 8-step
EMT mazes (P,0.05; Table 7).
Older children (10–12 y of age)
The roles of the n–6:n–3 ratio and plasma n–3 concentrations in working memory and planning performance were different for children aged 10–12 y from those for children aged 7–9 y. Higher plasma n–3 was generally associated with better per-formance on simpler tasks, and there were overall fewer findings with more difficult tasks. For instance, there were no associa-tions between the n–6:n–3 ratio or plasma n–3 and performance on the SOC planning task. Plasma n–3 predicted the number of
between errors made on 6-box SWM problems (P , 0.05)
TABLE 4
Regression predicting mean time to last response on the 8-box Spatial Working Memory problems1
Estimate6SE T P
Entire sample (n= 78)
Intercept 63,206617,275 3.66 0.0003 n–6:n–3 Ratio 243.816892.13 20.05 0.96 Plasma n–3,mmol 1221615,590 0.08 0.94 Age, mo 2108.56649.56 22.19 0.03 Maternal education 2583.446552.07 21.06 0.29 Children aged 7–9 y (n= 41)
Intercept 54,884616,738 3.28 0.001 n–6:n–3 Ratio 2102.636917.94 20.11 0.91 Plasma n–3,mmol 16,525614,689 1.12 0.26 Maternal education 211396703.05 21.62 0.11 Children aged 10–12 y (n= 37)
Intercept 45,245627,068 1.67 0.09 n–6:n–3 Ratio 321.9861387 0.23 0.82 Plasma n–3,mmol 256,715625,275 22.24 0.02 Maternal education 889.576809.01 1.1 0.27
1Entire sample,R2= 0.08; children aged 7–9 y,R2 = 0.14; children
aged 10–12 y,R2= 0.47.
TABLE 5
Regression predicting moves required to solve 5-move Stockings of Cambridge problems1
Estimate6SE T P
Entire sample (n= 78)
Intercept 6.5461.88 3.48 0.001
n–6:n–3 Ratio 0.2360.1 2.31 0.02
Plasma n–3,mmol 4.3961.69 2.7 0.01
Age, mo 20.0160.01 22.14 0.03
Maternal education 20.1160.08 21.24 0.22 Children aged 7–9 y (n= 41)
Intercept 5.0361.76 2.86 0.004
n–6:n–3 Ratio 0.3960.08 4.75 ,0.0001 Plasma n–3,mmol 4.8561.51 3.22 0.001 Maternal education 20.2460.1 22.51 0.01 Children aged 10–12 y (n= 37)
Intercept 4.7563.97 1.2 0.23
n–6:n–3 Ratio 0.0460.21 0.19 0.85 Plasma n–3,mmol 5.9764.01 1.49 0.14 Maternal education 20.0460.12 20.32 0.75
1
(Table 3), with higher n–3 predicting fewer errors. Neither the n–6:n–3 ratio nor plasma n–3 predicted between errors on the more difficult 8-box SWM problems in older children. Plasma n–3 predicted time spent searching for tokens on 8-box SWM problems (P ,0.05) (Table 4), with higher plasma n–3 asso-ciated with less time spent searching. Plasma n–3 predicted the total errors made on the 6-step EMT mazes, with higher n–3 predicting fewer errors made (P,0.05) (Table 8). Similar to the entire sample and children aged 7–9 y, both the n–6:n–3 ratio and plasma n–3 predicted repetitive errors made on the 8-step EMT mazes, with lower n–6:n–3 ratios and plasma n–3 pre-dicting fewer errors made (P,0.05) (Table 7).
DISCUSSION
Previous research has produced mixed results on the role of FAs in cognitive function in childhood (46–49). Studies that focused on cognitive functions subserved by the hippocampus and frontal cortex have been more likely to find effects of n–3 FAs on performance (48, 49), whereas studies including global measures have often reported no effects (46, 47). In addition, the effects found are often small, possibly because n–3 FAs are often studied without consideration of n–6 FAs, despite the shared metabolic pathway and complementary roles in neuronal structure and function. In the present study, we replicated pre-vious findings (1) of the interaction between the dietary n–6:n–3 ratio and n–3 intake predicting performance on difficult plan-ning tasks in children aged 7–9 y. Balanced dietary ratios and n–3 predicted better planning performance, particularly when participants consumed low n–6:n–3 ratios and low n–3. We also extended the model to children aged 10–12 y, but we found that unbalanced dietary ratios and n–3 predicted better planning performance. The older children performed best with low ratios and high n–3 intake.
We further tested models that used plasma concentrations of FA and, again, found differences between children aged 7–9 y and children aged 10–12 y. Lower plasma n–6:n–3 ratios
predicted better planning and working memory performance, par-ticularly in younger children. Lower plasma n–3 predicted better performance in younger children on the most difficult trials and tasks, but predicted worse performance in older children on simpler trials and tasks. These differences may be due to the differences in brain development occurring in children aged 7–9 y and children aged 10–12 y. In addition, there was an in-teraction between the plasma n–6:n–3 ratio and plasma n–3 predicting the time spent thinking through the most difficult planning problems. Children with low plasma n–3 performed best with low ratios, whereas children with higher n–3 intake performed similarly regardless of the ratio. This interaction was similar to that found in children aged 7–9 y with the dietary n–6:n–3 ratio and n–3 in the previous study (1), and the slight difference likely reflects the inclusion of older children who had relations between the n–6:n–3 ratio and plasma n–3 and executive functions that were different from those of younger children.
In models with both dietary and plasma FAs, there were only interactions between the n–6:n–3 ratio and n–3 predicting the performance on the most difficult 5-move planning problems. The 5-move problems required considerable working memory to hold in mind all the moves required and the ability to step outside the problem (50, 51) to see the counterintuitive moves needed to solve the problems in the fewest number of moves. These counterintuitive moves require considerable cognitive flexibility, which when combined with the requisite working
memory capacity, explains why,50% of adults can solve the
FIGURE 5 Simple slope graph of the interaction between the n–6:n–3 ratio and plasma n–3 predicting mean subsequent thinking time on the 5-move Stockings of Cambridge problems for the entire sample. The slopes for low plasma n–3 (1 SD below the mean,n= 3,T= 4.38,P,0.05) and mean plasma n–3 (n= 21,T= 2.49,P,0.05) were significant, and both groups solved planning problems more quickly with lower n–6:n–3 ratios. The slope for high plasma n–3 was not significant (n = 3, T=20.25, P .0.05), indicating no difference across n–6:n–3 ratios. The main effect of the plasma n–6:n–3 ratio [T(27) = 3.62; P,0.05], the main effect of plasma n–3 [T(27) = 2.85;P,0.05], and their interaction [T(27) =22.66;P,0.05] were all significant. Data for the simple slope analysis were obtained from the covariance matrix generated from the regression model.
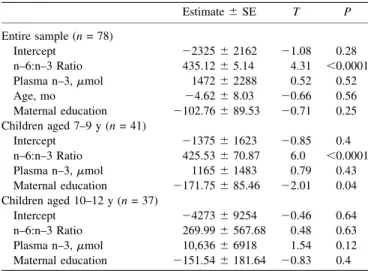
TABLE 6
Regression predicting the mean subsequent thinking time when solving 5-move Stockings of Cambridge problems1
Estimate6SE T P
Entire sample (n= 78)
Intercept 2232562162 21.08 0.28 n–6:n–3 Ratio 435.1265.14 4.31 ,0.0001 Plasma n–3,mmol 147262288 0.52 0.52
Age, mo 24.6268.03 20.66 0.56
Maternal education 2102.76689.53 20.71 0.25 Children aged 7–9 y (n= 41)
Intercept 2137561623 20.85 0.4 n–6:n–3 Ratio 425.53670.87 6.0 ,0.0001 Plasma n–3,mmol 116561483 0.79 0.43 Maternal education 2171.75685.46 22.01 0.04 Children aged 10–12 y (n= 37)
Intercept 2427369254 20.46 0.64 n–6:n–3 Ratio 269.996567.68 0.48 0.63 Plasma n–3,mmol 10,63666918 1.54 0.12 Maternal education 2151.546181.64 20.83 0.4
1Entire sample,R2= 0.59; children aged 7–9 y,R2 = 0.79; children
5-move problems in the minimum number of moves (52). This flexibility is also likely best supported by a combination of n–6 and n–3 FAs that supports different elements of neuronal structure and function (10, 53–55). The children in this study who had low plasma n–3 required a lower ratio to quickly think through these most difficult problems. A high ratio with low n–3 intake represents unbalanced n–6 and n–3, which has been shown in rats and cells to result in deficiencies in cognitive performance and n–3 FAs (14, 15, 19, 30).
With the use of both dietary FAs and plasma FAs, there were opposite results with children aged 7–9 y and children aged 10– 12 y. In general, the children aged 10–12 y performed best on executive function tasks with higher plasma n–3. This difference in older children could reflect developmental changes associated with entering puberty. Puberty brings with it considerable brain growth that could be supported best with more n–3 FAs. n–3 FAs support neurite growth in the frontal cortex and hippocampus (12, 56), and DHA has been found to affect monoamine neu-rotransmission during puberty in rats (57). Monoamine neuro-transmission has been shown to be affected by hormones (58, 59), but also by n–6 and n–3 FAs (10, 60, 61). Children aged 7– 9 y who, for the most part, have not entered puberty, would not necessarily require greater n–3 to support their brain develop-ment, whereas children aged 10–12 y would require greater n–3. Thus, the balance of n–6 and n–3 FAs required to optimally support cognitive development and subsequent function changes with development.
The effects of higher plasma n–3 in children aged 10–12 y were also most evident with simpler working memory and planning tasks, possibly reflecting the use of spatial memory capacity, and, therefore, the hippocampus, to solve these prob-lems. The hippocampus accretes more n–3 than the frontal cortex (14, 15); thus, hippocampal-based tasks likely will best be supported by more n–3. Less flexibility is required for the simpler problems, and the joint roles of n–6 and n–3 FAs are less obvious for these simpler tasks. In addition, the interaction be-tween the dietary n–6:n–3 ratio and n–3 indicated that specifically
low n–6:n–3 ratios and high n–3 intake predicted the best performance on the more difficult problems. Assessment of cognitive flexibility revealed the role of both n–6 and n–3 FAs, but the optimal balance was quite different in younger and older children. In all models, the inclusion of the n–6:n–3 ratio re-sulted in more robust findings in the present study than when n–3 FAs are studied in isolation, as has been found in other studies (1, 29). The importance of n–6 and n–3 FAs to cognitive function is best understood in terms of the balance between the 2 FA families. The optimal balance will be determined by both developmental stage and the cognitive function of interest.
The present study has a few limitations. First and foremost, data on pubertal stages were not collected. From our results, it appears that a measure of hormones, or at a minimum a ques-tionnaire on pubertal development, would have aided in our interpretation of the results. Future studies should consider pu-berty as a variable. Also, in this study, we measured a child’s cognitive abilities at a single time point; the use of a longitudinal design in future studies would further clarify optimal n–6 and n–3 FAs with respect to developmental change. Focus on in-dividual development is also highly recommended in terms of personalized nutrition. It is well known that single nucleotide polymorphisms in genes [fatty acid desaturase (FADS) 1 and
FADS2] that code for rate-limiting desaturases can limit the enzymes available during the different metabolic steps, which may ultimately affect the production of the longer-chain FAs (62, 63). Genetic differences between the children in the present study are unknown, and further research should incorporate genetic information before making any recommendation about individual FA intake.
In summary, the present study provided support for the im-portance of the n–6:n3 ratio to cognitive function in children 7–12 y old. It also demonstrated the need to study the optimal balance of n–6 and n–3 FAs across development as the needs of the developing and reorganizing brain change with age. The results also mirrored findings in cell and animal models that demonstrate both the importance of the balance of n–6 and n–3
TABLE 8
Regression predicting the total errors made on 6-step Electric Maze Task problems1
Estimate6SE T P
Entire sample (n= 78)
Intercept 1.6262.44 0.07 0.51
n–6:n–3 Ratio 0.2260.11 1.9 0.06
Plasma n–3,mmol 0.162.17 0.05 0.96
Age, mo 20.0260.01 22.42 0.02
Maternal education 0.0160.08 20.16 0.87 Children aged 7–9 y (n= 41)
Intercept 21.5162.87 20.53 0.6
n–6:n–3 Ratio 0.3760.13 2.86 0.004 Plasma n–3,mmol 3.0962.78 1.1 0.27 Maternal education 20.1360.14 20.94 0.35 Children aged 10–12 y (n= 37)
Intercept 4.2562.63 1.61 0.11
n–6:n–3 Ratio 20.0860.13 20.6 0.55 Plasma n–3,mmol 27.7962.48 23.13 0.002 Maternal education 0.0960.08 1.16 0.25
1
Entire sample,R2= 0.26; children aged 7–9 y,R2 = 0.31; children aged 10–12 y,R2= 0.46.
TABLE 7
Regression predicting repetitive errors made on 8-step Electric Maze Task mazes1
Estimate6SE T P
Entire sample (n= 78)
Intercept 22.162.03 21.03 0.3
n–6:n–3 Ratio 0.3860.09 4.23 ,0.0001 Plasma n–3,mmol 8.0961.5 5.41 ,0.0001
Age, mo 20.0260.1 22.45 0.01
Maternal education 20.1660.09 21.9 0.06 Children aged 7–9 y (n= 41)
Intercept 24.1762.26 21.85 0.07 n–6:n–3 Ratio 0.5160.1 4.91 ,0.0001 Plasma n–3,mmol 8.561.74 4.88 ,0.0001 Maternal education 20.2660.13 22.0 0.05 Children aged 10–12 y (n= 37)
Intercept 27.0462.86 22.47 0.01 n–6:n–3 Ratio 0.3760.14 2.76 0.01 Plasma n–3,mmol 11.8962.81 4.23 ,0.0001 Maternal education 20.1260.09 21.33 0.18
1Entire sample,R2= 0.49; children aged 7–9 y,R2 = 0.59; children
FAs and the need to focus on tasks subserved by the hippo-campus and frontal cortex. Tasks subserved by the hippohippo-campus, a brain area known to accrete considerable n–3, were more af-fected by n–3 status, particularly in children aged 10–12 y whose brains were likely going through a pubertal growth spurt. Tasks requiring the frontal cortex, a brain area that accretes a more even balance of n–6 and n–3, were more affected by the n–6:n–3 ratio and the interaction between the n–6:n–3 ratio and n–3. The more difficult tasks that required high degrees of flexibility were also more likely to be affected by the ratio, particularly in the younger children who would have found those tasks to be the most demanding. The present study provides direction for future research on the role of FAs in cognitive function, with particular emphasis on understanding the relevant developmental stages and using the consequent age-appropriate cognitive assessments.
We thank Andrea L Armer and L Grant Canipe III for their assistance categorizing participants into dietary groups.
The authors’ responsibilities were as follows—KWS: conducted the study with CLC oversight; CLC: had primary responsibility for the final content; and KWS and CLC: designed the study together, analyzed the data, wrote the paper, and read and approved the final manuscript. Neither author re-ported a conflict of interest related to the study.
REFERENCES
1. Sheppard KW, Cheatham CL. Omega-6 to omega-3 fatty acid ratio and higher-order cognitive functions in 7- to 9-y-olds: a cross-sectional study. Am J Clin Nutr 2013;98:659–67.
2. Yehuda S. Omega-6:omega-3 ratio and brain–related functions. In: Simopoulos AP, Cleland LG, editors. Omega-6:omega-3 essential fatty acid ratio: the scientific evidence. Basel (Switzerland): Karger, 2003. p. 37–56.
3. Yehuda S, Rabinovitz S, Mostofsky DI. Essential fatty acids are me-diators of brain biochemistry and cognitive functions. J Neurosci Res 1999;56:565–70.
4. Hoffman DR, Boettcher JA, Diersen–Schade DA. Toward optimizing vision and cognition in term infants by dietary docosahexaenoic and arachidonic acid supplementation: a review of randomized controlled trials. Prostaglandins Leukot Essent Fatty Acids 2009;81:151–8. 5. Sabel KG, Strandvik B, Petzold M, Lundqvist-Persson C. Motor,
mental and behavioral developments in infancy are associated with fatty acid pattern in breast milk and plasma of premature infants. Prostaglandins Leukot Essent Fatty Acids 2012;86:183–8.
6. Lassek WD, Gaulin SJ. Linoleic and docosahexaenoic acids in human milk have opposite relationships with cognitive test performance in a sample of 28 countries. Prostaglandins Leukot Essent Fatty Acids 2014;91:195–201.
7. Martinez M. Tissue levels of polyunsaturated fatty acids during early human development. J Pediatr 1992;120:S129–38.
8. Chalon S, Delion–Vancassel S, Belzung C, Guilloteau D, Leguisquet A-M, Besnard J-C, Durand G. Dietary fish oil affects monoaminergic neurotransmission and behavior in rats. J Nutr 1998;128:2512–9. 9. Delion S, Chalon S, Guilloteau D, Lejeune B, Besnard J-C, Durand G.
Age-related changes in phospholipid fatty acid composition and monoaminergic neurotransmission in the hippocampus of rats fed a balanced or an n–3 polyunsaturated fatty acid-deficient diet. J Lipid Res 1997;38:680–9.
10. Zimmer L, Delpal S, Guilloteau D, Aioun J, Durand G, Chalon S. Chronic n–3 polyunsaturated fatty acid deficiency alters dopamine vesicle density in the rat frontal cortex. Neurosci Lett 2000;284:25–8. 11. du Bois TM, Deng C, Bell W, Huang XF. Fatty acids differentially affect serotonin receptor and transporter binding in the rat brain. Neuroscience 2006;139:1397–403.
12. Calderon F, Kim HY. Docosahexaenoic acid promotes neurite growth in hippocampal neurons. J Neurochem 2004;90:979–88.
13. Auestad N, Innis SM. Dietary n–3 fatty acid restriction during gestation in rats: Neuronal cell body and growth-cone fatty acids. Am J Clin Nutr 2000;71:312S–4S.
14. Jumpsen JA, Lien EL, Goh YK, Clandinin MT. During neuronal and glial cell development diet n–6 to n–3 fatty acid ratio alters the fatty acid composition of phosphatidylinositol and phosphatidylserine. Bio-chim Biophys Acta 1997;1347:40–50.
15. Jumpsen J, Lien EL, Goh YK, Clandinin MT. Small changes of dietary (n–6) and (n–3)/fatty acid content ratio alter phosphatidylethanolamine and phosphatidylcholine fatty acid composition during development of neuronal and glial cells in rats. J Nutr 1997;127:724–31.
16. Harnack K, Andersen G, Somoza V. Quantitation of alpha-linolenic acid elongation to eicosapentaenoic and docosahexaenoic acid as af-fected by the ratio of n6:n3 fatty acids. Nutr Metab (Lond) 2009;6:8. 17. Gibson RA, Neumann MA, Lien EL, Boyd KA, Tu WC. Docosahex-aenoic acid synthesis from alpha-linolenic acid is inhibited by diets high in polyunsaturated fatty acids. Prostaglandins Leukot Essent Fatty Acids 2013;88:139–46.
18. Bourre JM, Picotti M, Dumont O. Delta-6 desaturase in brain and liver during development and aging. Lipids 1990;25(6):354–6.
19. Li D, Weisinger HS, Weisinger RS, Mathai M, Armitage JA, Vingrys AJ, Sinclair AJ. Omega 6 to omega 3 fatty acid imbalance early in life leads to persistent reductions in DHA levels in glycerophospholipids in rat hypothalamus even after long-term omega 3 fatty acid repletion. Prostaglandins Leukot Essent Fatty Acids 2006;74:391–9.
20. Moriguchi T, Greiner RS, Salem N. Behavioral deficits associated with dietary induction of decreased brain docosahexaenoic acid concentra-tion. J Neurochem 2000;75:2563–73.
21. Salem N, Moriguchi T, Greiner RS, McBride K, Ahmad A, Catalan J, Slotnick B. Alterations in brain function after loss of docosahexaenoate due to dietary restriction of n–3 fatty acids. J Mol Neurosci 2001;16:299–307. 22. Greiner RS, Moriguchi T, Hutton A, Slotnick B, Salem N. Rats with low levels of brain docosahexaenoic acid impaired performance in olfactory-based and spatial learning tasks. Lipids 1999;34:S239–43. 23. Greiner RS, Moriguchi T, Slotnick B, Hutton A, Salem N. Olfactory
discrimination deficits in n–3 fatty acid-deficient rats. Physiol Behav 2001;72:379–85.
24. Cheatham CL, Colombo J. n–3 Fatty acids and cognitive and visual acuity development: methodologic and conceptual considerations. Am J Clin Nutr 2006;83(Suppl):1458S–66S.
25. Simmer K, Patole SK, Rao SC. Longchain polyunsaturated fatty acid supplementation in infants born at term. Cochrane Database Syst Rev 2011;(12):CD000376.
26. Birch EE, Hoffman DR, Castaneda YS, Fawcett SL, Birch DG, Uauy RD. A randomized controlled trial of long-chain polyunsaturated fatty acid supplementation of formula in term infants after weaning at 6 wk of age. Am J Clin Nutr 2002;75:570–80.
27. Willatts P, Forsyth JS, DiModugno MK, Varma S, Colvin M. Effect of long-chain polyunsaturated fatty acids in infant formula on problem solving at 10 months of age. Lancet 1998;352:688–91.
28. Scott DT, Janowsky JS, Carroll RE, Taylor JA, Auestad N, Montalto MB. Formula supplementation with long-chain polyunsaturated fatty acids: are there developmental benefits? Pediatrics 1998;102(5):e59. 29. Grundy T, Toben C, Jaehne EJ, Corrigan F, Baune BT. Long-term
omega-3 supplementation modulates behavior, hippocampal fatty acid concentration, neuronal progenitor proliferation and central TNF-alpha expression in 7 month old unchallenged mice. Front Cell Neurosci 2014;8:399.
30. Ikemoto A, Ohishi M, Sato Y, Hata N, Misawa Y, Fujii Y, Okuyama H. Reversibility of n–3 fatty acid deficiency-induced alerations of learning behavior in the rat: level of n–6 fatty acids as another critical factor. J Lipid Res 2001;42:1655–63.
31. Conklin HM, Luciana M, Hooper CJ, Yarger RS. Working memory performance in typically developing children and adolscents: behav-ioral evidence of protracted frontal lobe development. Dev Neuro-psychol 2007;31:103–28.
32. Pelphrey KA, Reznick JS. Working memory in infancy. Adv Child Dev Behav 2003;31:173–227.
33. Bull R, Espy KA, Senn TE. A comparison of performance on the Towers of London and Hanoi in young children. J Child Psychol Psychiatry 2004;45:743–54.
36. Sheppard KW, Cheatham CL. Validation of the Electric Maze as a measure of planning. J Cogn Dev (in press).
37. Baxter SD, Hardin JW, Guinn CH, Royer JA, Mackelprang AJ, Smith AF. Fourth-grade children’s dietary recall accuracy is influenced by retention interval (target period and interview time). J Am Diet Assoc 2009;109:846–56.
38. Luciana M, Nelson CA. Assessment of neuropsychological function through use of the Cambridge Neuropsychological Testing Automated Battery: performance in 4- to 12-year-old children. Dev Neuropsychol 2002;22:595–624.
39. Zelazo PD. The development of conscious control in childhood. Trends Cogn Sci 2004;8:12–7.
40. Zelazo PD, Frye D, Rapus T. An age-related dissociation between knowing rules and using them. Cogn Dev 1996;11:37–63.
41. Bligh EG, Dyer WJ. A rapid method of total lipid extraction and pu-rification. Can J Biochem Physiol 1959;37:911–7.
42. Tacconi M, Wurtman RJ. Rat brain phosphatidyl-N,N–dimethylethanolamine is rich in polyunsaturated fatty acids. J Neurochem 1985;45:805–9. 43. Lemaitre RN, King IB, Patterson RE, Psaty BM, Kestin M, Heckbert
SR. Assessment of trans-fatty acid intake with a food frequency questionnaire and validation with adipose tissue levels of trans-fatty acids. Am J Epidemiol 1998;148:1085–93.
44. Noldus LPJJ, Spink AJ, Tegelenbosch RAJ. EthoVision: a versatile video tracking system for automation of behavioral experiments. Be-hav Res Methods Instrum Comput 2001;33:398–414.
45. Allison PD. Handling missing data by maximum likelihood. Pro-ceedings of the SAS Global Forum 2012 Conference; 2012 Apr 22–25, Cary, NC. SAS Institute Inc, 2012.
46. Bakker EC, Ghys AJ, Kester AD, Vles JS, Dubas JS, Blanco CE, Hornstra G. Long-chain polyunsaturated fatty acids at birth and cog-nitive function at 7 y of age. Eur J Clin Nutr 2003;57:89–95. 47. Helland IB, Smith L, Blomen B, Saarem K, Saugstad OD, Drevon CA.
Effect of supplementing pregnant and lactating mothers with n–3 very-long-chain fatty acids on children’s IQ and body mass index at 7 years of age. Pediatrics 2008;122:e472–9.
48. Baym CL, Khan NA, Monti JM, Raine LB, Drollette ES, Moore RD, Scudder MR, Kramer AF, Hillman CH, Cohen NJ. Dietary lipids are differentially associated with hippocampal-dependent relational mem-ory in prepubescent children. Am J Clin Nutr 2014;99:1026–32. 49. Cheatham CL, Nerhammer AS, Asserhoj M, Michaelsen KF, Lauritzen
L. Fish oil supplementation during lactation: effects on cognition and behavior at 7 years of age. Lipids 2011;46:637–45.
50. Zelazo PD, Frye D. Cognitive complexity and control: II. The de-velopment of executive function in childhood. Curr Dir Psychol Sci 1998;7:121–8.
51. Lezak MD. The problem of assessing executive functions. Int J Psychol 1982;17:281–97.
52. Luciana M, Nelson CA. The functional emergence of prefrontally-guided working memory systems in four- to eight-year-old children. Neuropsychologia 1998;36:273–93.
53. Richards DA, Bliss TVP, Richards CD. Differential modulation of NMDA-induced calcium transients by arachidonic acid and nitric oxide in cultured hippocampal neurons. Eur J Neurosci 2003;17:2323–8. 54. Fang YJ, Zhou MH, Gao XF, Gu H, Mei YA. Arachidonic acid
mod-ulates Na+ currents by non–metabolic and metabolic pathways in rat cerebellar granule cells. Biochem J 2011;438:203–15.
55. Ahmad A, Murthy M, Moriguchi T, Salem N, Greiner RS. A decrease in cell size accompanies a loss of docosahexaenoate in the rat hippo-campus. Nutr Neurosci 2002;5:103–13.
56. Innis SM, De La Presa Owens S. Dietary fatty acid composition in pregnancy alters neurite membrane fatty acids and dopamine in new-born rat brain. J Nutr 2001;131:118–22.
57. Weiser MJ, Wynalda K, Salem N Jr., Butt CM. Dietary DHA during development affects depression–like behaviors and biomarkers that emerge after puberty in adolescent rats. J Lipid Res 2015;56:151–66. 58. Rubinow DR, Schmidt PJ, Roca CA. Estrogen–serotonin interactions: implications for affective regulation. Biol Psychiatry 1998;44:839–50. 59. Epperson CN, Wisner KL, Yamamoto BY. Gonadal steroids in the
treatment of mood disorders. Psychosom Med 1999;61:676–97. 60. Delion S, Chalon S, Herault J, Guilloteau D, Besnard J-C, Durand G.
Chronic dietary alpha-linolenic acid deficiency alters dopaminergic and serotoninergic neurotransmission in rats. J Nutr 1994;124:2466–76. 61. Zimmer L, Vancassel S, Cantagrel S, Breton P, Delamanche S, Guilloteau
D, Durand G, Chalon S. The dopamine mesocorticolimbic pathway in affected by deficiency in n–3 polyunsaturated fatty acids. Am J Clin Nutr 2002;75:662–7.
62. Xie L, Innis SM. Genetic variants of the FADS1 FADS2 gene cluster are associated with altered (n–6) and (n–3) essential fatty acids in plasma and erythrocyte phospholipids in women during pregnancy and in breast milk during lactation. J Nutr 2008;138:2222–8.