LEXICAL SHIFTS IN THE ENGLISH OF SOUTHEASTERN NORTH CAROLINA
Kayleigh Estella Reyes
A thesis submitted to the faculty at the University of North Carolina at Chapel Hill in partial fulfillment of the requirements for the degree of
Master of Arts in the Linguistics Department.
Chapel Hill 2015
© 2015
ABSTRACT
Kayleigh Estella Reyes: Lexical Shifts in the English of Southeastern North Carolina
(Under the direction of David Mora-Marin)
The aim of this study is to describe changes in lexical items
elicited from residents of New Hanover County, North Carolina between 1937 and 2015. Lexical shifts are evaluated in relation to generation,
education, and locality. An important secondary goal of this study is to explore the idea that changes in participants’ opinions of Southern dialects relates to the change in lexical preference. The original
hypothesis for this study expected to find the lexical items used in 2015 to be markedly different from the lexical items in 1937. Furthermore, it was assumed that participants with negative opinions of Southern dialects would be more likely to differentiate themselves from their Southern peers in lexical usage.
Data analyzed come from three sources: 1937 elicitations conducted for the Linguistic Atlas of Mid-South Atlantic States, 1990 recordings collected by Ellen Johnson, and 2015 data collected specifically for this thesis through in-person interviews in which participants were given a list of lexical items to identify and from an online survey that asked participants to identify a smaller set of lexical items. Both experiments from 2015 also collected demographic information and participants'
shows the most variability is home across all demographic breakdowns. Data was analyzed in three groupings. The first analysis included the 1937, 1990, and 2015 responses to twelve lexical items given by twelve participants. For analysis, participants were sorted by generation,
education, and locality. The second analysis involves only the 2015 responses from the in-person New Hanover country residents for the same twelve lexical items analyzed in the first grouping as well as the responses to twenty four other distinct lexical items. The participants again were sorted by generation, education and locality. The final data analysis was done looking only at the online participants sorted by region and language attitudes. New Hanover county residents were compared to residents from the rest of the Southeastern US and from the rest of the US and abroad.
The findings of this full study show that not only has lexical usage changed across generations in New Hanover County, but the trends in
ACKNOWLEDGEMENTS
TABLE OF CONTENTS
LIST OF TABLES……… ix
LIST OF FIGURES……….……… xii
LIST OF ABBREVIATIONS……….…… xiii
CHAPTER 1: BACKGROUND AND EXPLANATION……….…… 1
Introduction……… 1
Literature Review……… 3
CHAPTER 2: DATA ANALYZED……… 6
1937 Dataset……… 6
1990 Dataset……… 7
2015 Dataset……… 8
Online Study……… 8
In-person Study……… 14
Recruitment……… 16
CHAPTER 3: PARTICIPANTS……… 18
In-person Study……… 18
Participants and Communities……… 18
Participant Comparisons……… 24
Wilmington 2015……… 27
Online Study……… 31
CHAPTER 4: RESPONSES……… 32
In-person Responses: Tri-Study……… 32
In-person Responses: Wilmington 2015……… 35
CHAPTER 5: ANALYSIS AND RESULTS……… 39
In-person Analysis: Tri-Study……… 39
Comparisons across Recording Sets……… 49
In-person Analysis: Wilmington 2015……… 55
Online Study……… 67
CHAPTER 6: DISCUSSION……… 75
Discussion……… 75
CHAPTER 7: CONCLUSIONS……… 84
Conclusions……… 84
Errors and Complications……… 85
Future Research……… 86
APPENDIX 1: IN-PERSON STUDY FLYER……… 89
APPENDIX 2: ONLINE STUDY FLYER……… 90
APPENDIX 3: PARTICIPANT CONSENT FORM……… 91
APPENDIX 4: WILMINGTON 2015 RESPONSES……… 92
APPENDIX 5: TRI-STUDY COMPARISON CHARTS……… 96
APPENDIX 6: WILMINGTON 2015 COMPARISON CHARTS……… 104
LIST OF TABLES
Table 1. Lexical Item Stimuli……… 11
Table 2. Historical Generation……… 19
Table 3. Fixed Generation……… 20
Table 4. Categorical Generation……… 20
Table 5. Recorded Age Distributions……… 21
Table 6. True Education……… 22
Table 7. Categorical Education……… 22
Table 8. Table of Participants……… 23
Table 9. Tri-Study Participants……… 25
Table 10. Comparison of Tri-Study Participants……… 25
Table 11. Comparison of All Participants……… 26
Table 12. Generational Breakdown……… 27
Table 13. Wilmington 2015 Participants……… 27
Table 14. Wilmington Fixed Generation Breakdown……… 28
Table 15. Wilmington Historical Generation Breakdown……… 29
Table 16. Wilmington Households……… 30
Table 17. Responses from 1937 Participants……… 33
Table 18. Responses from 1990 Participants……… 34
Table 19. Responses from 2015 Participant……… 34
Table 20. Twelve Token Analysis……… 35
Table 21. Extra Token Analysis……… 35
Table 22. Lexical Items with Variation……… 39
Table 23. Tri-Study Fixed Generation……… 40
Table 24. Tri-Study Fixed Generation Responses……… 40
Table 26. Tri-Study Historical Generation Responses……… 42
Table 27. Tri-Study Historical Generation Variability……… 44
Table 28. Tri-Study Fixed Education……… 46
Table 29. Tri-Study True Education……… 46
Table 30. Tri-Study Education Lexical Shifts……… 46
Table 31. Tri-Study Education Variability……… 47
Table 32. Tri-Study Locality……… 48
Table 33. Tri-Study Locality Responses……… 48
Table 34. Tri-Study Primary Responses……… 49
Table 35. Tri-Study Primary Variability……… 50
Table 36. Tri-Study Primary 1937/1990 Sample to Whole…….……… 51
Table 37. Tri-Study Primary and Secondary 1937/1990 Sample to Whole………… 52
Table 38. Tri-Study Primary Full Sample to Whole……… 53
Table 39. Tri-Study Primary and Secondary Full Sample to Whole……… 54
Table 40. Wilmington 2015 Lexical Variability……… 55
Table 41. Wilmington 2015 Education and Generation……… 56
Table 42. Wilmington 2015 Education Twelve Token Variability……….……… 57
Table 43. Wilmington 2015 Education Extended Token Variability……… 58
Table 44. Wilmington 2015 Generation Twelve Token Variability……… 60
Table 45. Wilmington 2015 Generation Extended Token Variability……… 61
Table 46. Wilmington 2015 Locality……… 62
Table 47. Wilmington 2015 Locality Twelve Token Variability……… 63
Table 48. Wilmington 2015 Locality Extended Token Variability……… 64
Table 49. Wilmington 2015 Language Attitudes.……… 66
Table 50. Online Response Regional Variability.……… 67
Table 51. Online Regional Variability ‘skunk’……… 68
Table 52. Online Regional Language Attitudes……… 69
Table 53. Online Wilmington Responses……… 69
LIST OF FIGURES
LIST OF ABBREVIATIONS
LAMSAS Linguistic Atlas of Mid-South Atlantic States W Wilmington Region
CHAPTER 1: BACKGROUND AND INTRODUCTION
Introduction
What is a southern accent? For the average American, a southern accent is a way of speaking that reflects a lifestyle that differentiates a small regionalized group from the rest of the country. From the
viewpoint of a sociolinguist, a southern accent is a collection of
phonological features and processes associated with a particular region. What the average American may define as an accent, a linguist would refer to more distinctly as a dialect. The key difference in terminology comes from the fact that dialect refers not just to the phonological features commonly focused on, but also the variety in word use, or lexical
variation.
When asked to define a southern accent or dialect, participants noted everything from “drawn out and long vowels/diphthongs” to “…a
certain twang on words…” and “slower [speech] pace”; though overwhelmingly the most common response was “we use different words”.1 Despite the common recognition of distinctive word use, this idea of lexical variation in the southern dialect is not currently a popular topic in sociolinguistic
research nor is the relationship between lexical variation and social stigma; current linguistic research has focused on how the phonetic
production of phonemes in the southern accent vary from the standard; most notably there is the extensive research on the Southern Vowel Shift.
The idea of nonstandard dialects, such as a southern dialect, being more negatively evaluated than the standardized dialect is not a new one. Nor is the idea that our prejudices towards these dialects are shaped by social stigmas taught to us through our parents, peers, school system, and media outlets. What is not commonly addressed is how these prejudices shape a speaker’s personal acquisition of the nonstandard dialect common to their region. Beyond this is the idea that shifting public opinions across generations can influence the prevalence of nonstandard features, including lexical items, being acquired. Does the change in social stigma over time affect the southern dialect and prevalence of lexical items? Collecting data on language and dialect attitudes, when linked with major events happening in the region over the period of 74 years, can help explain the variations seen in lexical item choices between groups.
I propose the following MA thesis to address this gap in research. Building off of two studies, Ellen Johnson’s evaluation of lexical
variation between 1930 and 19902, and the original Linguistic Atlas of the Middle and South Atlantic States (LAMSAS)3, I propose a two part experiment that will provide lexical item and language attitude data in an attempt to evaluate the variation in southern dialectal features from 1930 to 2015. The speakers evaluated for this thesis will be from two regions included in the original LAMSAS study and revisited in the study by Johnson: New Hanover County and Brunswick County in North Carolina. By structuring the experiment as a generational study with speakers ranging in age from 18 to 99, the data collected will allow a clear view of language change over a
2 Johnson, Ellen. Lexical Change and Variation in the Southeastern United States, 1930-1990. Tuscaloosa: University of Alabama Press, 1996.
period of time for the particular regions addressed. The primary goal of this thesis is to describe and explain any variations in lexical usage by speakers in the southeastern-most North Carolina counties from 1930 to 2015. The secondary goal is to evaluate any connections between shifts in public opinions and shifts in lexical usage.
What follows is a review of the relevant literature regarding
Southern dialects and stigmatized language. Chapter 2 presents information on the data analyzed for this study including data sources, experiment designs, and recruitment information. A complete list and description of participants is included in chapter 3. Chapter 4 contains a summary of responses for each analysis while chapter 5 shows the analysis of the results. Chapter 6 includes a discussion of the findings as well as well as a brief summary of errors and complications encountered. The final chapter, chapter 7, rounds out this paper with conclusions and future directions for this line of research.
Literature Review
An important place to start in the research of the southern dialect is in defining the term “dialect” itself. Chambers4 distinguishes the term “dialect” from “accent” by stating that accent refers to a speaker’s
pronunciation and a variety of a language which is
phonetically/phonologically different from other varieties, whereas a dialect refers to a variety that is grammatically and lexically distinct as well. This distinction is not readily recognized outside of the
linguistic community; for the average American, accent and dialect are used interchangeably. In interactions with the participants of this study the two terms may be used in place of one another, but during analysis the tendency will be to refer to it properly as a southern dialect.
It has long been understood that the average American can
distinguish differences in the English spoken around them and label them as belonging to distinct dialects. These dialects can be geographically or socially defined based on the opinions of speakers of dialects outside of that region.5 In the United States there is the belief that there is a standardized dialect speakers should aspire to and a number of lesser non-standard dialects that should be avoided.6 Research has shown that even speakers raised in a nonstandard dialect tend to have the opinion that
nonstandard dialects are bad and pass those feelings on to their children.7 When talking about nonstandard dialect discrimination, it is easy to see that the southern American dialect is one of the most stigmatized. Perceptual studies of American English dialects show southern dialects as consistently being ranked lowest in their usage of “correct” or acceptable speech.8 In general, people tend to view dialects, like the southern
dialect, that contain marked grammatical features, such as the structures previously deemed less “correct”, as more negative than dialects that do not contain socially stigmatized structures.9 These opinions on dialects often stem more from peoples’ opinions related to the group of people they associate the dialect with, rather than with the actual features of the
5 Feagin, Crawford. “Southern White in the English Language Community” Allen, Harold B and Michael D Linn. Dialect and Language Variation. Orlando, Fla.: Academic Press, 1986. Page 259-283.
6 Wolfram, Walt and Ralph Fasold. “Social Dialects and Education” Pride, JB. Sociolinguistic Aspects of Language Learning and Teaching. Oxford: Oxford University Press. Page 185-212.
7 Labov, Williams. 1965. Stages in the acquisition of Standard English. In Social dialects and language learning. Chamoaign, IL: National Council of Teachers of English.
8 Hartley, Laura. “A View from the West: Perceptions of U.S. Dialects by Oregon Residents” Preston, Dennis. Handbook of Perceptual Dialectology. Philadelphia: John Benjamins Publishing Company. 1999. Page 315-332.
dialect itself.10 This stigma is reinforced by stereotypes in media through popular television shows and movies that use nonstandard dialects for evil or stupid characters.11
10 Preston, Dennis R. 2004. Language with an attitude. In J.K. Chambers, Peter Trudgill, and Natalie Schilling-Estes (eds.), The Handbook of Language Variation and Change. Oxford: Blackwell Publishing, 40-66.
CHAPTER 2: DATA ANALYZED
1937 Dataset
In 1937, Guy Lowman traveled to the three southeastern-most counties in North Carolina to interview native English speakers. These recordings were collected as part of the research conducted for the Linguistic Atlas of the Mid-South Atlantic States (LAMSAS) on lexical usage that extended across 276 communities, corresponding to counties12. 75 communities were visited in North Carolina, including the two southeastern most counties: New Hanover County and Brunswick County. A total of six participants were interviewed in these three regions with two residing in Brunswick County and four in New Hanover County.
Lowman elicited lexical items and syntactic constructions through the use of specific work sheets that contained over 700 questions. These thirty four worksheets, including topics ranging from numerals and farm crops to weather and social life, were used in every region for the duration of the LAMSAS study. Responses and commentary given by
participants were written by hand, in both traditional English orthography and IPA in notebooks kept by Lowman. These notebooks, and the ones kept by other LAMSAS interviewers, are currently the property of University of Georgia and have been partially uploaded to an online database13.
12 Kretzschmar, William A. Handbook of the Linguistic Atlas of the Middle and South Atlantic States. Chicago, Ill.: University of Chicago Press, 1993.
This thesis makes use of the participant information and responses available in the online database for LAMSAS. While hundreds of people were interviewed for this study, my interest lies in the six people interviewed by Lowman in the Wilmington, North Carolina area. The data available for this sample in the online database are sparse and incomplete, a fact that will be discussed and accounted for during the later sections on analysis. 1990 Dataset
Following in the footsteps of Guy Lowman, Ellen Johnson returned to thirty of the original LAMSAS communities and interviewed thirty-nine new participants. Using a shortened version of the original work sheets, that only contained 150 questions, Johnson was able to collect roughly 1,402 lexical variants14. These variants were compared against the 1,007 variants found for the same 150 questions during the 1930s LAMSAS interviews.
Whereas Lowman relied on in-depth transcriptions, Johnson had the benefit of recording her interviews, allowing her to return later to do her
analysis.
For her study, Johnson focused on finding participants that roughly matched the age, gender, and regional distributions found in the LAMSAS data, but in some cases this was not possible. While Lowman interviewed six participants across the two southeastern-most counties, Johnson only interviewed four participants with one being from New Hanover County and three from Brunswick County.
Johnson’s research, summarized and explained in Lexical Change and Variation in the Southeastern United States, 9130-1990, contains in-depth comparisons between the two datasets and provides thought-provoking
insight into lexical language change. Her appendix contains totals of all
responses given for the 150 questions, but does not provide regional breakdowns or responses for each participant. The online database that contains the LAMSAS data also contains the original recordings done by Johnson, although they do not have transcriptions for these recordings. For this thesis, the recordings from the four participants from Brunswick County and New Hanover County are used to collect responses for each of the 150 questions.
2015 Dataset
Online Study
The online study conducted for the present research project contains three sections: a demographic survey, a lexical naming task, and a
language attitude survey. Using a survey-hosting service called Survey Monkey, I have created a twenty-nine page and forty-four question survey. The survey was designed to take less than thirty minutes to complete. A progress bar appears at the top of each page to tell the participant how much of the experiment is left to complete. The experiment begins with an introduction screen that explains the three components of the survey and simple instructions on how to proceed. At the start of each component section the participant is shown a screen with complete details on how to complete the task. Participants are not able to move between tasks or pages; once a page is completed it cannot be viewed again or changed.
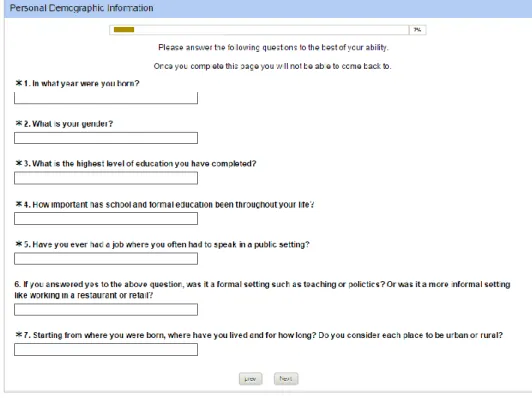
The personal background section collects details on key variables related directly to the participants. The following image, Figure 1, shows the exact screen participants are shown during this section of the
experiment. In order to properly categorize participants, the first three questions ask for age, gender, and education level. The responses to the fourth question, on the importance of formal education, and the fifth question, on public speaking, will later be analyzed along with the language attitude responses to compare against any trends seen with lexical usage. The seventh question asks the participants to list the areas in which they have lived and their opinion on whether the location is urban or rural. While both the 1937 and 1990 recordings use the urban vs. rural rating provided in census data to sort the participants, this study uses the participants’ perceptions of locality to aid in the analysis of the language attitude responses.
The second demographic section, shown in Figure 2, asks for the participants to provide information about their family background.
Question eight requires the participants to rank their interactions with certain groups of people to provide a basis for the age group that
possibly had the most influence on their language. The formatting allows for multiple groups to be ranked in the same position; i.e. the
participant could have interacted most with both their parents and their siblings while having little to no interaction with their classmates and adults outside their family. The last three questions ask for the
education level of the participant’s guardians, the languages spoken in the home, and description of the guardian’s English, as possible variables to influence lexical usage.
Figure 2. Family Demographic Section
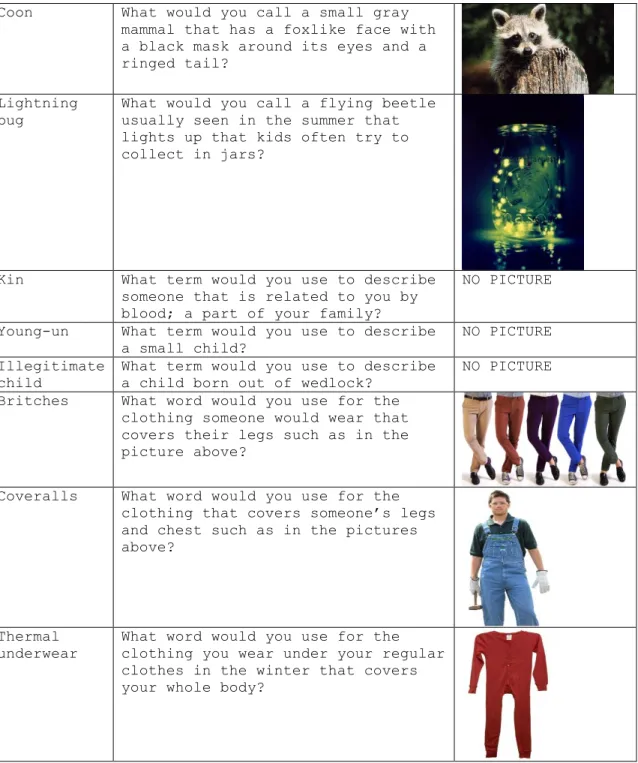
participants are shown a sentence on screen and in some cases a picture corresponding to a lexical item. Participants are instructed to identify the item on screen and if they do not know what something is, or do not have a specific word or phrase for what is shown they will be instructed to say as much. There is no character count for responses so participants are encouraged to add comments and explanations. The items targeted are either general phrases or individual lexical terms that fall into the category of food, people, animals, and clothes. The following table shows each lexical item targeted, the sentence describing the item, and an example which may be a sample frame sentence or a picture if applicable.
Lexical Item Descriptive Sentence Example Pitching a
fit
What phrase would you use to
describe the actions of a child who did not get what they wanted at the store and starts crying and
screaming to get their way?
Tommy is so
spoiled he always __________ if he doesn’t get what he wants.
Putting on airs
What phrase would you use to
describe the actions of someone that is acting haughty, pretentious or displaying their own importance or wealth?
Jessica always goes around ___________ like she is the Queen of England. Lollygag What phrase would you use to
describe the actions of someone that is avoiding work or acting lazy and dawdling?
Sara is so lazy she is always __________ and takes forever to get her work done. In a bad way What phrase would you use to
describe someone that is very sick and unable to do things they
normally do?
Bobby has been coughing for weeks and the doctors say he
-___________. Coon’s age What phrase would you use to
describe something that has taken a very long time?
We’ve been waiting _________________ for our food. Hoecake What would you call a small cake
Snow cream What would you call a dessert made by pouring sweetened cream or condensed milk over fresh snow?
Scrapple What would you call scraps of pork or other meat stewed with cornmeal and shaped into loaves for slicing and frying?
Piccalilli What would you call a relish made of chopped cabbage, peppers, onions, and spices?
Hush puppies What would you call small fired balls of dough made from cornmeal and onion?
Fatback What would you call a strip of fat from the back of hog that is usually dried and salted and used to season vegetables like collard greens?
Lima beans What would you call the small greenish white flat beans that are often boiled?
Polecat What would you call a small mammal with distinctive black-and-white stripped fur that squirts a bad smelling musk when threatened?
Possum What would you call a small rat like animal with a thin hairless tail that is known for eating out of trashcans?
Varmit What would you use as a general term for a troublesome wild animal?
NO PICTURE Critter What would you use as a general term
for a small animal?
Coon What would you call a small gray mammal that has a foxlike face with a black mask around its eyes and a ringed tail?
Lightning bug
What would you call a flying beetle usually seen in the summer that lights up that kids often try to collect in jars?
Kin What term would you use to describe someone that is related to you by blood; a part of your family?
NO PICTURE
Young-un What term would you use to describe a small child?
NO PICTURE Illegitimate
child
What term would you use to describe a child born out of wedlock?
NO PICTURE Britches What word would you use for the
clothing someone would wear that covers their legs such as in the picture above?
Coveralls What word would you use for the clothing that covers someone’s legs and chest such as in the pictures above?
Thermal underwear
What word would you use for the clothing you wear under your regular clothes in the winter that covers your whole body?
Table 1. Lexical Item Stimuli
on how much they can write. The following is a list of all language attitude questions asked:
(a) How would you describe the way you speak? Do you have an accent, speech disorders, or any unique features?
(b) Do you identify as a Southern speaker? (c) How would you describe a southern dialect? (d) How would you describe Southerners in general?
(e) How do you think most Americans currently feel about Southerners and Southern dialects?
(f) Do you think peoples’ opinions of Southerners and
Southern dialects has changed since you were growing up? If yes, how so?
(g) As you were growing up, what Southerners (fictional or real) were well known or famous? What were these people like? What did you think of them?
(h) Have you or anyone you know been discriminated against in a social or academic setting due to the way they spoke English? If so, please describe what happened. (i) Do you ever actively try to change the way you sound in
certain settings? If so, please explain when and why.
Six of the questions in this section ask for participants’ specific opinions on Southerners and Southern dialects. The primary goal of these questions, and the other questions in this section, is to analyze any potential relationships between personal opinions and lexical usage. A secondary goal of this question set is to track changes in public opinion across regions and generations.
In-person Study
An in-person study can build off of the basic lexical items and opinions elicited in the online study to provide a fuller picture. With an in-person component there is a greater ability to gather more data and more interpretive justification for the data. The in-person study also contains a component not possible in the online study; an in-depth conversation. The conversation component will allow for a variety of
provide explanations or extra information while answering questions in the lexical items section. While the amount and quality of this information may not reach the level of the information that could be provided during an in-depth conversation, it will be a useful supplement to the basic lexical information.
The in-person study is broken into two tasks, occasionally completed on separate days. The in-person experiment begins with an explanation of what is about to happen, after which the participant is offered a consent form to sign should they agree to take part in the study. The consent form is included in the appendix for reference. Once the participants have signed the consent form, the voice recorder will be switched on to collect all responses as well as questions and comments. There is no rush for the participant to finish the surveys or the naming task, and extra time may be taken to discuss interesting topics brought up from the participants’ answers. The first task begins with the participant taking the same survey given to the online participants.
Following the completion of the online study, the participant is asked to complete a second lexical naming task that includes terms not analyzed in the online study. The target lexical items are elicited orally as responses to descriptor sentences; there is no visual component for this naming task. Categories for this task include: rooms and furniture, weather terms, foods, kinship terms, illness and death, school-related terms, and animals. All lexical items for this task are taken from
For the second task the participants are asked to have an informal conversation with the researcher. The recording begins as soon as the participant arrives and has made themselves comfortable and the recorder is only turned off when: all conversation topics have been discussed, when conversation falters, when the participant has to leave, or when the
allotted time has come to an end.
The conversation topics are randomly picked before the conversation begins from three main categories: family, food, and childhood. The family category provides lexical items for marriage, death, illness, kinship terms, and items related to childbirth. The food category targets
agriculture, animals, and cooking. The last category on childhood should elicit terms for education and social structures in the family and in the community. While each conversation will be started from a category, the interviewer never interrupts natural conversation even if it goes off topic.
Recruitment
Participants for the in-person study are all native English speakers recruited from the Raleigh, Wilmington, and Chapel Hill area. All
participants interviewed have been born, raised, or lived most of their lives in one of these three areas. While the recruitment included three cities, the final analysis of data focuses solely on the participants from the Wilmington area as they overlap directly with the New Hanover and Brunswick County regions from the 1937 and 1990 datasets.
Facebook. There were two flyers and postings; one specifically for the online study that included my email and a link to the survey, and another specifically for the in-person study, which only included my email. As far as compensation goes, in-person participants had the option to receive $16 upon completion of the experiment while online participants did not
receive compensation.
CHAPTER 3: PARTICIPANTS
In-person Study
Throughout the LAMSAS study, hundreds of people were interviewed. In 1990, Ellen Johnson, using a smaller sample of the regions explored in LAMSAS, collected responses from 39 participants. The 2015 recordings collected specifically for this thesis provided an additional 14
participants. While a multitude of participants were available, only 20 are discussed in this study. The reasoning for exclusion of particular participants, as well as the demographic breakdown of the ones selected, is outlined in the following sections.
Participants and Communities
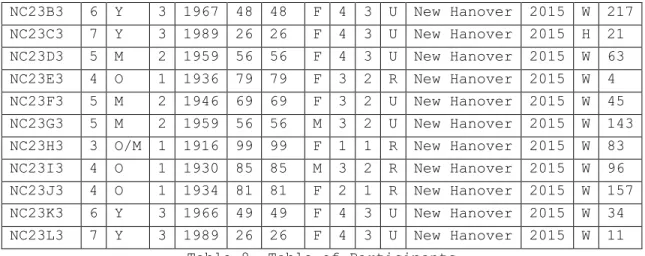
Table 8, labeled as Table of Participants, is coded to contain information regarding the identity of each participant, the circumstances of the interview, and the sociocultural characteristics for each
participant. What follows is an explanation of each Column in the Table of Participants.
Following the guidelines of the original LAMSAS study, column A contains an ID number for each participant comprised of three variables. Participants are identified by a two-letter state abbreviation, a
community number, and a letter/number pair. The two-letter state
Hanover County are marked 23. The final letter/number pair can be divided into the letters A-L to mark the order in which the participants were interviewed and the numbers 1-3 to mark which set of recordings the participant was included in.
With these classifications, ID number NC24B2 would refer to the second participant from Brunswick County in North Carolina that was interviewed during the second set of recordings. Deviations from the
standard ID number are found in three participants: NC23C1!, NC23D1!, and NC24N2. The inclusion of an exclamation point in the ID number was used in the original LAMSAS study to distinguish “cultivated participants” who could be classified as speakers “…whose speech reflected superior
education and elevated social standing in their communities.” At the time of the secondary recordings, by Ellen Johnson, this classification was no longer used, though the exclamation point is retained in these ID numbers to aid researchers when going between LAMSAS worksheets and publications. For ID number NC24N2, the letter N is used to identify an African-American participant from a community.
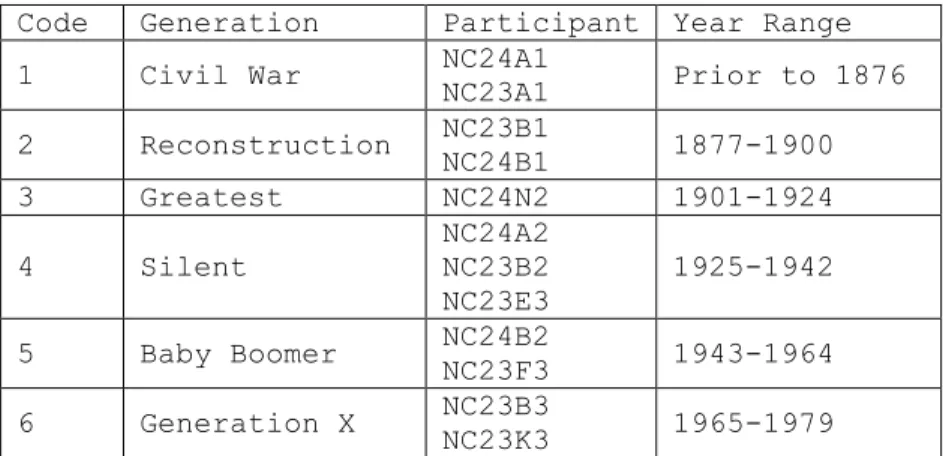
Column B corresponds to Historical Generation. Participants were assigned a number to denote membership in one of seven generations based on historical context. Table 2 below serves as a key for understanding generation assignment.
Code Generation Year Range 1 Civil War Prior to 1876 2 Reconstruction 1877-1900 3 Greatest 1901-1924
4 Silent 1925-1942
5 Baby Boomer 1943-1964 6 Generation X 1965-1979 7 Millennials 1980 and beyond
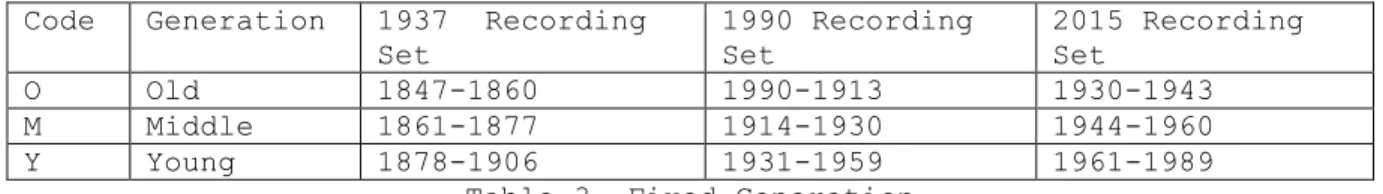
The fixed generation category, column C, is a modified version of the “age” category created by Ellen Johnson and has three options, Old, Middle, and Young, calculated from the participants birth year; table 3 shows these categories. The year ranges for the first two recording sets are taken almost exactly as stated from Johnson’s study, while the year ranges for the third recording set were decided upon following the style of the existing criteria. For each recording set, the Old category spans 13 years, the Middle spans 16, and the Young spans 28. The birth year of every participant is included in one of the three categories assigned to their recording group except in the case of NC23H3, an outlier from the 2015 recording set born in 1916. NC23H3’s birth year is before the start of the Old category for her recording set, but due to the limited data elicited during her interview, she may be grouped with either the 3rd recording set Old generation or the 2nd recording set Middle generation.
Code Generation 1937 Recording Set
1990 Recording Set
2015 Recording Set
O Old 1847-1860 1990-1913 1930-1943
M Middle 1861-1877 1914-1930 1944-1960
Y Young 1878-1906 1931-1959 1961-1989
Table 3. Fixed Generation
Column D showed categorical generation; this column is a numerical version of the Fixed Generation column to aid in analysis. Table 4 below shows each category with its numerical marker.
Code Generation 1937 Recording Set
1990 Recording Set
2015 Recording Set
1 Old 1847-1860 1990-1913 1930-1943
2 Middle 1861-1877 1914-1930 1944-1960
3 Young 1878-1906 1931-1959 1961-1989
Table 4. Categorical Generation
point during the interview process. For the participants that did not have an explicit birth year, the year was calculated using the reported age at the time of interview and the year in which the interview took place. Therefore, participant NC23B1 who was 46 at the time of recording in 1937 was estimated to have been born around 1891. Estimated birth years do not interfere with the results, as participants are further categorized by generation criteria.
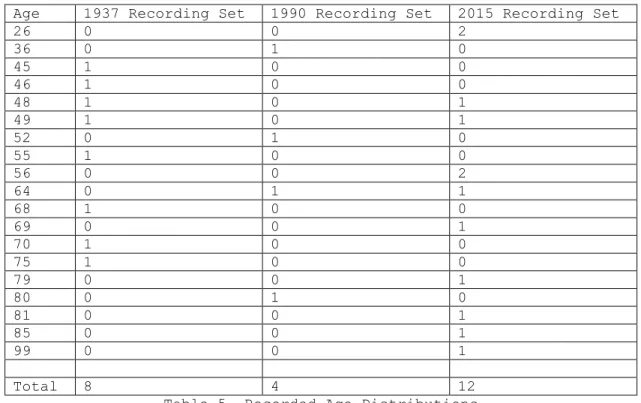
All participants provided either their age at the time of interview or the year in which they were born; this information is contained in column F. The number of participants at any particular age is summarized below in table 5 for each recording set.
Age 1937 Recording Set 1990 Recording Set 2015 Recording Set
26 0 0 2
36 0 1 0
45 1 0 0
46 1 0 0
48 1 0 1
49 1 0 1
52 0 1 0
55 1 0 0
56 0 0 2
64 0 1 1
68 1 0 0
69 0 0 1
70 1 0 0
75 1 0 0
79 0 0 1
80 0 1 0
81 0 0 1
85 0 0 1
99 0 0 1
Total 8 4 12
Table 5. Recorded Age Distributions
The Current Age column, column G, is an estimate of each
current age is used simply to establish comparisons for the generational data.
All participants self-identified as either Male or Female at some point during their interview; this information is stored in column H.
Column I related to true education and is shown in Table 6. Using a simplified version of the levels of education outlined by Kurath in the LAMSAS study, participants were assigned a number related to the amount of school they had completed. In some cases, especially for the older
participants, the exact level of schooling could not be determined and was therefore estimated using information gathered during the biographical interview.
Code Education Level
1 Did not complete Elementary School 2 Completed Elementary but not High
School
3 Completed High School but not College 4 Completed College
Table 6. True Education
The Categorical Education differs from the True Education in that the numbers are specific to the recording set as opposed to being
relatable across years. The following chart, Table 7, shows the classifications and their criteria contained in column J.
Code 1937 Recording Set
1990 Recording Set
2015 Recording Set
1 Did not attend or complete
Elementary School
Did not attend or complete High School
Did not attend or complete High School
2 Did not attend or complete High School
Did not attend or complete College
Did not attend or complete College 3 High School
Graduates
Column L related to region and locality. Both the LAMSAS and Johnson participants were grouped as either urban or rural based on US Census criteria that designated urban areas as having a population greater than 2500. For the 2015 recordings, the participants were asked if they
considered their hometown to be urban or rural to determine locality. Participants were taken from three recording years: 1937, 1990, and 2015. The recordings done in 1937 were completed by Guy Lowman as part of the original LAMSAS dataset. The 1990 recordings were collected by Ellen Johnson, and the 2015 recordings were done by Kayleigh Reyes. Column M is labeled for the year of each recording.
Column N contains race information. Participants who identified themselves as being White are marked with W, African-American participants are marked as B, and Hispanic participants are marked H.
The final column, column O, is the alternative ID code for
participants. Participants from the 2015 recording set were originally referred to by a numerical code which was converted to the ID style in column A at the time of analysis. Their original ID code is included here in column O to provide a means with which to analyze the 2015 data
properly.
A B C D E F G H I J K L M N O
NC23B3 6 Y 3 1967 48 48 F 4 3 U New Hanover 2015 W 217 NC23C3 7 Y 3 1989 26 26 F 4 3 U New Hanover 2015 H 21 NC23D3 5 M 2 1959 56 56 F 4 3 U New Hanover 2015 W 63 NC23E3 4 O 1 1936 79 79 F 3 2 R New Hanover 2015 W 4 NC23F3 5 M 2 1946 69 69 F 3 2 U New Hanover 2015 W 45 NC23G3 5 M 2 1959 56 56 M 3 2 U New Hanover 2015 W 143 NC23H3 3 O/M 1 1916 99 99 F 1 1 R New Hanover 2015 W 83 NC23I3 4 O 1 1930 85 85 M 3 2 R New Hanover 2015 W 96 NC23J3 4 O 1 1934 81 81 F 2 1 R New Hanover 2015 W 157 NC23K3 6 Y 3 1966 49 49 F 4 3 U New Hanover 2015 W 34 NC23L3 7 Y 3 1989 26 26 F 4 3 U New Hanover 2015 W 11
Table 8. Table of Participants
Participant Comparisons
In total, the responses from 20 participants are discussed in this study. The participants and their responses are analyzed in two ways; the first is a tri-study comparison in which the participants from 2015 are compared to the participants from 1937 and 1990. The second comparison discussed focuses solely on the participants recorded in 2015.
The goal of this tri-study comparison is to assess the differences in lexical usage over a seventy-eight year period. When Ellen Johnson compared her 1990 data to the data found in 1937, she attempted to find participants whose ages were within ten years of the 1937 participants at the time of recording. In order to make clear comparisons between the 1937, 1990, and 2015 data, only the 2015 participants that matched the age range of the previous studies are analyzed. This means that four
participants from 2015 were compared against the original eight. A breakdown of all participants analyzed across the three studies is
A B C D E F G H I J K L M N O NC23A1 1 O 1 1862 75 153 M 1 1 R New Hanover 1937 W - NC23B1 2 Y 3 1891 46 124 F 2 2 R New Hanover 1937 W - NC24A1 1 M 2 1867 70 148 F 1 1 R Brunswick 1937 W - NC24B1 2 Y 3 1892 45 123 M 3 3 R Brunswick 1937 W - NC23B2 4 Y 3 1938 52 77 F 3 2 U New Hanover 1990 W - NC24A2 4 M 2 1926 64 89 M 2 1 R Brunswick 1990 W - NC24B2 5 Y 3 1954 36 61 M 3 2 R Brunswick 1990 W - NC24N2 3 O 1 1910 80 105 F 2 1 R Brunswick 1990 B - NC23B3 6 Y 3 1967 48 48 F 4 3 U New Hanover 2015 W 217 NC23E3 4 O 1 1936 79 79 F 3 2 R New Hanover 2015 W 4 NC23F3 5 M 2 1946 69 69 F 3 2 U New Hanover 2015 W 45 NC23K3 6 Y 3 1966 49 49 F 4 3 U New Hanover 2015 W 34
Table 9. Tri-Study Participants
A comparison of the participants analyzed across the three studies in shown in Table 10. Only the basic variables (gender, true education, race, categorical generation, and locality) are compared here. Potential interactions between these variables are not discussed in depth, but may be touched upon during analysis.
Variables 1937 Dataset 1990 Dataset 2015 Dataset
Female (F) 3 2 3
Male (M) 1 2 1
College Graduate - - 2
High School Graduate
1 2 2
Elementary School 1 2 -
Less than Elementary
2 - -
Black (B) - 1 -
White (W) 4 3 4
Hispanic (H) - - -
Old
1847-1860/1900-1913/1930-1943
1 1 1
Middle
1864-1876/1916-1928/1946-1958
1 1 1
Young
1881-1901/1931-1959/1961-1989
Rural (R ) 4 3 1
Urban (U) - 1 3
Total 4 4 4
Table 10. Comparison of Tri-study Participants
While comparing a total of twelve participants, four from each of the three datasets, may seem like a small number, I believe it to be a large enough sample to provide useful information. Looking at the small sample allows the final analysis to be compared to the larger study, of the 30 counties by Johnson, in order to relate the results to the larger population. Table 11 provides details of the full participant comparisons including the ones not analyzed for this study.
Variables 1937
Dataset
1990 Dataset
2015 Dataset
Female (F) 18 18 10
Male (M) 21 21 3
College Graduate - 9 7
High School Graduate 8 18 4
Elementary School 15 12 2
Less than Elementary 16 - -
Black (B) 6 6 1
White (W) 33 33 11
Hispanic (H) - - 1
Old 1847-1860/1900-1913/1930-1943
12 11 4
Middle 1864-1876/1916-1928/1946-1958
13 15 4
Young 1881-1901/1931-1959/1961-1989
14 13 5
Rural (R ) 30 25 4
Urban (U) 9 14 9
Table 11. Comparison of All Participants
The twelve participants also provide a nice sample of historical generations to add to the interpretation of findings. Table 12 shows the distribution of participants across the historical generations with only the Millennials Generation unaccounted for in this dataset.
Code Generation Participant Year Range 1 Civil War NC24A1
NC23A1 Prior to 1876 2 Reconstruction NC23B1
NC24B1 1877-1900 3 Greatest NC24N2 1901-1924 4 Silent
NC24A2 NC23B2 NC23E3
1925-1942
5 Baby Boomer NC24B2
NC23F3 1943-1964 6 Generation X NC23B3
NC23K3 1965-1979 Table 12. Generational Breakdown
Wilmington 2015
The primary goal of this secondary comparison is to explore generational changes in lexical usage. The secondary goal is to track changing public opinions and social stigma related to the Southern
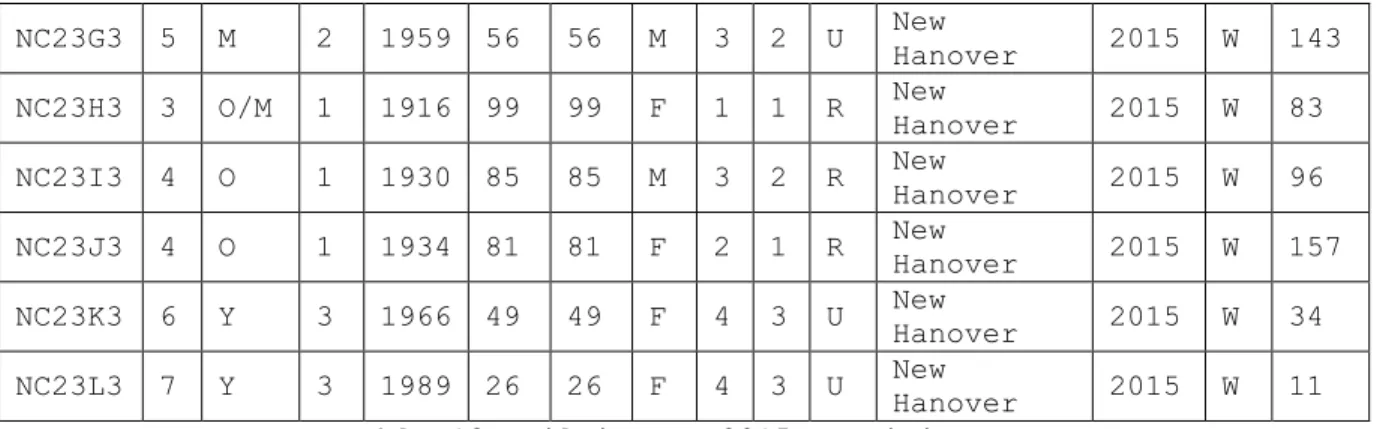
American dialect. What follows in table 13 is a summary of the demographic information related to the twelve 2015 New Hanover County participants.
A B C D E F G H I J K L M N O
NC23A3 5 M 2 1951 64 64 F 4 3 U New Hanover 2015 W 522 NC23B3 6 Y 3 1967 48 48 F 4 3 U New
Hanover 2015 W 217 NC23C3 7 Y 3 1989 26 26 F 4 3 U New
Hanover 2015 H 21 NC23D3 5 M 2 1959 56 56 F 4 3 U New Hanover 2015 W 63 NC23E3 4 O 1 1936 79 79 F 3 2 R New Hanover 2015 W 4 NC23F3 5 M 2 1946 69 69 F 3 2 U New
NC23G3 5 M 2 1959 56 56 M 3 2 U New Hanover 2015 W 143 NC23H3 3 O/M 1 1916 99 99 F 1 1 R New
Hanover 2015 W 83 NC23I3 4 O 1 1930 85 85 M 3 2 R New
Hanover 2015 W 96 NC23J3 4 O 1 1934 81 81 F 2 1 R New Hanover 2015 W 157 NC23K3 6 Y 3 1966 49 49 F 4 3 U New Hanover 2015 W 34 NC23L3 7 Y 3 1989 26 26 F 4 3 U New
Hanover 2015 W 11 Table 13. Wilmington 2015 Participants
Twelve participants were recorded in the New Hanover County area during the 2015 round of recordings. Unlike the previous two studies, the number of female participants outnumbered the male participants with ten females and only two males. This gender division, while making it
difficult to compare the sample to the general population, provides an interesting variable with which to explore trends in lexical usage. The recordings taken in New Hanover County in 2015 also show the most
diversity, in regards to age, out of the three recording sets analyzed. The 1937 recordings only showed a difference of 30 years between the oldest and youngest participants and the 1990s recordings only showed a difference in 44 years, while the 2015 recordings had a 73 year gap between the oldest and youngest. Even accounting for NC23H3, the outlier born in 1926, the gap from the second oldest participant to the youngest participant spans 59 years. This recording set also provides an even division, 4 each, of participants across the Fixed Generation markers, as seen in table 14.
Fixed Generation Time Period Number of Participants
Old 1930 - 1943 4
Middle 1944 - 1960 4
Young 1961 - 1989 4
Total 12
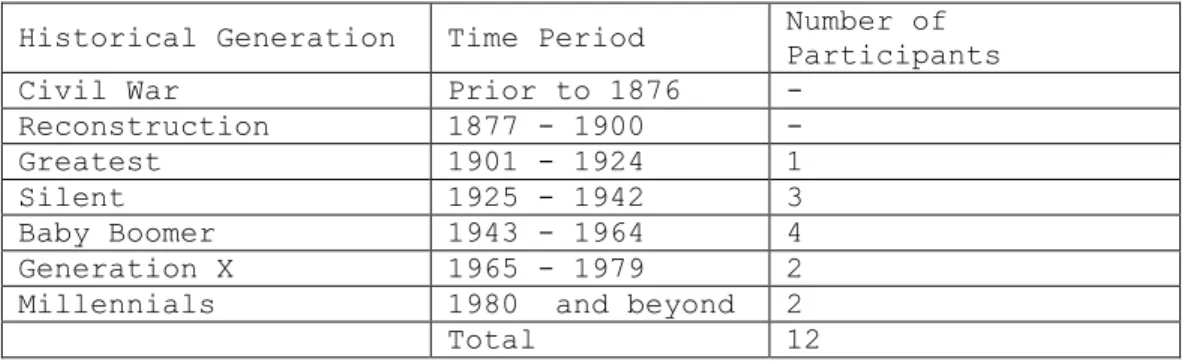
In regards to Historical Generation, shown in table 15, while the 2015 recording set does not contain any participants from the oldest two generations, Civil War and Reconstruction, it does contain at least one participant from each of the remaining five generations.
Historical Generation Time Period Number of Participants
Civil War Prior to 1876 -
Reconstruction 1877 - 1900 -
Greatest 1901 - 1924 1
Silent 1925 - 1942 3
Baby Boomer 1943 - 1964 4
Generation X 1965 - 1979 2 Millennials 1980 and beyond 2
Total 12
Table 15. Wilmington Historical Generation Breakdown
One additional subset analysis which should be explored further, involves ten family members. These participants can be grouped into the following family tree, figure 3 (subscript b is used to mark biological relation to the oldest family member):
Figure 3. Wilmington Family Tree
NC23H3
bNC23E3
bNC23B3
bNC23C3
bNC23F3
NC23K3
bNC23J3
b+ NC23I3
NC23D3
All four generations have lived the majority of their lives in the New Hanover County area; for at least the past forty years, their houses have been within ten minutes of each other. Contact between the
generations is frequent; they often gather for Sunday dinners, holidays, weekly shopping trips, and weekend outings. The family can be split further into three groups based on where they live and who they interact with most. Household One is comprised of NC23E3, NC23B3, and NC23C3, who have lived together in the same house for the entirety of NC23C3’s life and the majority of NC23B3’s life. Household Two includes NC23F3 and NC23K3. Household Three has been established in the same area for almost the last forty years and includes NC23H3, NC23J3, NC23I3, NC23D3, and NC23L3. Along with region and interaction, the households also differ in their opinions on Southern dialects. Household One has the most negative opinions on Southern dialects and the strongest desire to sound “educated” and “well off” whereas Household Three has the strongest connection to the Southern dialect and the most positive opinions. Household Two is midway between Household One and Three in most aspects. Each Household Group is described in table 16 below.
Household
Group Household 1 Household 2 Household 3
Members
NC23E3 NC23B3 NC23C3
NC23F3 NC23K3
NC23H3 NC23J3 NC23I3 NC23D3 NC23L3 Fixed
Generation Range
Old, Middle, and
Young Middle and Young
Old, Middle, and Young
True Education
Range 3 and 4 3 and 4 1, 2, 3, and 4
Southern Dialect Opinions
Online Study
The online study conducted as part of the 2015 data collection may provide further support for the divergence of the Wilmington area sample from the rest of the Southeastern United States region. Out of a total of two hundred and thirty two participants in the online study, thirty four people were from the Wilmington area, fifty four were from the
Southeastern US region, and one hundred and forty four participants were from various locations across the globe. In the cases where participants listed themselves as having lived in multiple areas, their regional marker matched the area in which they had lived the longest. A full list of all participants and their responses is included in the appendix.
A comparison is first carried out by looking at all participants from all regions who answered the online survey to see how lexical choice varies across region. After which lexical choice is analyzed related to language attitudes. In order to further explore the claim that the
CHAPTER 4: RESPONSES
In-person Responses: Tri-Study
The data available from the 1937 LAMSAS study are sparse. All four 1937 participants selected for the tri-study analysis have a limited number of responses available in the online database; of those, only twelve tokens overlapped with token elicited in the 1990 and 2015
recordings. Those tokens correspond to the following questions from the LAMSAS worksheets:
(1) What would you call a large piece of furniture that two or more people would sit on in the (living room, sitting room, parlor, etc.)?
(2) What would you call the ledge above the fireplace that you can set things on?
(3) What would you call a larger piece of furniture for you clothes that has drawers on bottom and cabinet doors on top that you use to store clothes?
(4) What would you call the horizontal boards on the outside of wooden house that slightly overlap each other?
(5) When you make your bed - what is the last thing that goes on top? What do you call the top covering you sleep under?
(6) What would you call the things that hang in windows that you pull down to keep out the light?
(7) If the sky starts filling with clouds like it is about to rain you might say ____.
(8) If you get a lot of rain falling all at once you would say _____.
(9) What do you call a storm with heavy rain, thunder, and lightning?
(10) What would you call a dish baked in the oven made from fruit and some kind of topping made with flour and sugar?
(11) What name do you have for a long thin-bodied insect with two pairs of shiny brightly colored wings? They usually hover around damp places and eat mosquitos
(12) What would a man call the woman he is married to?
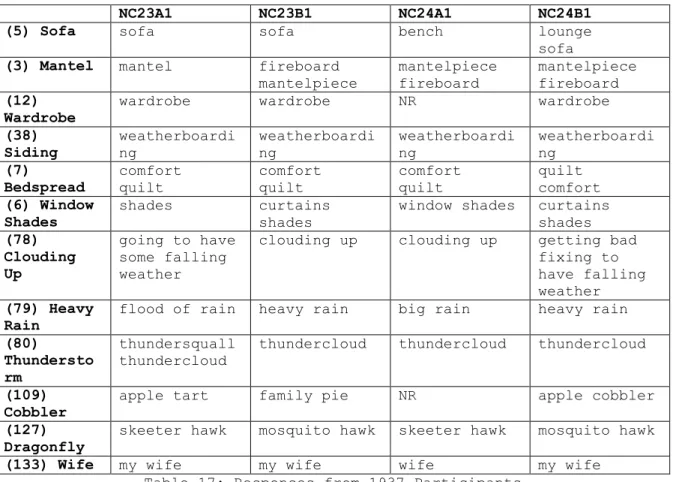
participants provided more than one response for a given token, the responses are listed in the order the participant gave them. In the instances in which a participant did not have a word for a token, even after the interviewer suggests one, the response is coded NR (no
response). A blank spot in the chart means the token has not been found in the recordings transcribed; this pertains mostly to the 1990 recordings by Ellen Johnson. As there is no written record of participant responses for the 1990 data, the responses included here are taken by listening to the recordings hosted on the online LAMSAS database. These recordings are not properly labeled and tokens are never elicited in the same order or with the same frame sentence, making the recognition of specific tokens
difficult.
NC23A1 NC23B1 NC24A1 NC24B1
(5) Sofa sofa sofa bench lounge
sofa
(3) Mantel mantel fireboard
mantelpiece
mantelpiece fireboard
mantelpiece fireboard (12)
Wardrobe
wardrobe wardrobe NR wardrobe
(38) Siding
weatherboardi ng
weatherboardi ng
weatherboardi ng
weatherboardi ng
(7)
Bedspread
comfort quilt
comfort quilt
comfort quilt
quilt comfort (6) Window
Shades
shades curtains shades
window shades curtains shades (78)
Clouding Up
going to have some falling weather
clouding up clouding up getting bad fixing to have falling weather (79) Heavy
Rain
flood of rain heavy rain big rain heavy rain (80)
Thundersto rm
thundersquall thundercloud
thundercloud thundercloud thundercloud
(109) Cobbler
apple tart family pie NR apple cobbler (127)
Dragonfly
skeeter hawk mosquito hawk skeeter hawk mosquito hawk
(133) Wife my wife my wife wife my wife
NC23B2 NC24A2 NC24B2 NC24N2
(5) Sofa couch couch couch
(3) Mantel mantel mantelpiece mantel mantelpiece
(12) Wardrobe armoire NR wardrobe rack
(38) Siding siding
sideboards
(7) Bedspread bedspread
quilt coverlet
quilt quilt
spread
blanket spread (6) Window
Shades
shades shutters curtains
blinds shades (78) Clouding Up stormy storm coming scuds a building thunderhead blustery (79) Heavy Rain gulley washer cloudburst downpour NR (80) Thunderstorm
thunderstorm storm thunderstorm
electric storm
(109) Cobbler cobbler cobbler
(127) Dragonfly
mosquito hawk
mosquito hawk mosquito hawk dragonfly
(133) Wife wife wife
Table 18: Responses from 1990 Participants
NC23B3 NC23E3 NC23F3 NC23K3
(5) Sofa sofa
loveseat
setee couch loveseat
(3) Mantel mantel mantel mantel mantel
(12) Wardrobe armoire cabinet wardrobe armoire
(38) Siding wooden boards ledge siding siding
(7) Bedspread duvet comforter bedspread comforter
(6) Window Shades shutters blinds shades curtains
blinds shades blinds (78) Clouding
Up
looks stormy cloudy storm moving in storm is rolling in (79) Heavy Rain torrential rain downpour flood pouring rain downpour (80) Thunderstorm
thunderstorm thunderstorm storm thunderstorm
(109) Cobbler cobbler cobbler cobbler pie
(127) Dragonfly
NR NR NR dragonfly
(133) Wife spouse wife wife wife
In-person Responses: Wilmington 2015
Not including the overlapping questions from the online study, a total of fifty tokens were elicited from almost all Wilmington
participants. Participant NC23H3 is not included in this sample due to the fact that she was unable to do any tasks that did not involve pictures. These fifty tokens include the twelve analyzed for the tri-study and were sorted into five categories: animals, house, family, weather, and
illness/death. While a complete list of responses is provided in the
appendix, two charts have been included here as an example. Table 20 shows responses to the 12 tokens analyzed for the tri-study while Table 21 shows responses to tokens shown to have variations; both tables shown are the generational analysis.
Old Middle Young
(5) Sofa setee 2 couch 1 couch 3 sofa 1 couch 2 sofa 1 loveseat 1 (3) Mantel
mantel 3 mantel 4 mantel 3
hearth 1 (12)
Wardrobe
cabinet 1 high boy 1 armoire 1 wardrobe 3 vanity 1 wardrobe 1 armoire 3 (38) Siding ledge 1 clapboards 1 siding 1 siding 2 clap boards 1 lap siding 1
siding 2 panels 1
wooden boards 1 (7) Bedspread comforter 1 spread 2 bedspread 3 blanket 1 comforter 2 blanket 1 duvet 1 (6) Window Shades shades 2 blinds 1 blinds 3 curtains 1 shades 2 blinds 1 shutters 1 (78) Clouding Up
stormy day 2 cloudy 1
clouding up 2 looks like a cloud is coming 1
storm moving in 1
looks stormy 1 its about to storm 1
overcast 1
feels like a storm rolling in 1
(79) Downpour
downpour 2 flood 1
downpour 2 pouring rain 1 sky fell in 1
downpour 2
torrential rain 1 pouring 1
(80)
Thunderstorm
thunderstorm 3 thunderstorm 2 bad storm 1
thunderstorm 4 (109)
Cobbler
cobbler 3 cobbler 3 dessert 1
cobbler 2 pie 1
(127) Dragonfly
mosquito hawk 2 NR 1 dragonfly 2 NR 2 dragonfly 3 NR 1 (133) Wife wife 1 old lady 1
wife 3 honey 1
wife 3 honey 1 Table 20. Twelve token Analysis
Old Middle Young
Mom momma 3 momma 1
mom 3
mom 3 mommy 1
Dad daddy 2
dad 1
daddy 3 dad 1
daddy 3 father 1 Grandmother grandmother 1
grandma 1 grandmomma 1
grandma 4 grandmother 2 grandma 2 Grandfather grandfather 1
grandpa 1 granddaddy 1 granddaddy 1 grandpa 3 grandfather 3 granddaddy 1
Favors favors 1
looks like 1 is like 1
resembles 1 strongly resembles 1 favors 1 looks like 1
looks just like 1
looks like 3
Young’un adolescent 2 juvenile 1 teenager 1 youth 1 children 1 adolescent 1 adolescent 1 teenagers 1 children 1 teens 1 Courting courting 3 dating 3
date 1
dating 4
Mutt mongrel 1
mutt 2
mutt 3 sooner 1
dog 2 mutt 2 Overcast cloudy 1
gloomy day 2
cloudy 4 overcast 1 dreary 1
about to storm 1 gray day 1
Coffin coffin 1
casket 2
casket 4 casket 2 coffin 2 Cemetery cemetery 2
mausolieum 1
cemetery 3 cemetery plot 1
cemetery 4 Funeral graveside
service 1 burial 1 NR 1 graveside ceremony 1 funeral 3 funeral service 1 funeral 1 graveside service 1 wake 1
Vomit vomit 1
throw up 2
vomit 2 throw up 2
vomit 3 throw up 1 Dresser dresser 1
dresser drawers 1
chest of drawers 1
chest of drawers 2
dresser 2
dresser 3
chest of drawers 1
Dish cloth dish towel 1 wash rag 2
dish cloth 3 wash rag 1
Dish rag dish rag 1 towel 1
drying towel 1
dish rag 1 dish towel 3
dish cloth 3 dish rag 1 Caddycornered cattycornered 1
caddycornered 1 caddicornered 1 diagonally 1 catecornered 1 caddycornered 1 caddycornered 2 catticornered 1 cadicornered 1 Skillet frying pan 2
pan 1
frying pan 2 pots 1
pan 1
frying pan 1 cast iron 1 pot 1
pots 1 Carriage bassinette 1
walker 1 stroller 1 carriage 1 stroller 2 walker 1 carriage 1 stroller 2 walker 1 Barnyard pen 1
barnyard 2 barnyard 2 pasture 1 NR 1 barnyard 1 pasture 1 field 1 paddock 1 Green onion onion 3 onion 2
turnip 1 wild onion 1
onion 2
green onion 1 potato 1
Chicken hen 1
turkey 1 duck 1 chicken 2 birds 1 hen 1 chicken 4
Died died 1
passed on 1 kicked the bucket 1 died 3 kicked the bucket 1 died 1 pushing up daisies 1
bit the bullet 1 Stranger new lady 1
stranger 2
stranger 2 new comer 1 new person
stranger 3 new person 1
Junk junk 2
trash 1
junk 4 junk 3
trash 1 Table 21. Extra Token Analysis
Online Responses
The large amount of data collected from the online study overs a multitude of possible routes for analysis. For the purposes of this study, only two sets of information are analyzed; lexical items and language attitudes. In order to provide further support linking the findings from the in-person analysis, seven of the lexical items asked in the online study were also elicited during the original LAMSAS interviews in 1937, and again by Ellen Johnson in 1990. While the responses from the
comparison of the Southeastern region done by Johnson can be compared to the Southeastern region sampled in the 2015 online study. These seven lexical items were: cornbread, fatback, lima beans, skunk, lightening bug, relatives, and pants.
Each online participant was categorized as having a positive,
negative, or descriptive attitude towards Southerners and Southern dialect determined based on participants’ answers to multiple questions in the final section of the survey. The descriptive rating was given to
CHAPTER 5: ANALYSIS AND RESULTS
In-person Analysis: Tri-Study
Initial analysis of the twelve tokens gathered across the three recording sets showed clear signs of variation across multiple variables. These findings are presented and explained below as well as their relation to the initial findings by Ellen Johnson. Only select comparisons are shown below, but complete comparisons for all variables and tokens are provided in the appendix.
Variations and complete lexical changes were evaluated with regard to to five variables: locality, fixed generation, historical generation, fixed education, and true education. While there are occasional examples of overlap across variables, each provides an interesting look into what facilitates lexical change. Table 22 below shows tokens that showed change across variables; these results are calculated using only the primary and preferred response from each participant.
Locality Fixed Generation
Historical Generation
Fixed Education
True Education
dragonfly dragonfly dragonfly dragonfly
thunderstorm thunderstorm thunderstorm window
shades
window shades
window shades
siding siding
wardrobe wardrobe wardrobe wardrobe
mantel mantel mantel mantel
bedspread bedspread clouding up
wife
Fixed Generation refers to a numerical value 1-3 that ranks each participant within their own recording set as (1) oldest group, (2) middle group, and (3) youngest group. Table 23 illustrates how the twelve
participants were grouped across the fixed generation variable and Table 24 shows the comparison between group responses.
1 (oldest group) 2 (middle group) 3 (youngest group) NC23A1 NC24N2 NC23E3 NC24A1 NC24A2 NC23F3 NC23B1 NC24B1 NC24B2 NC23B2 NC23K3 NC23B3 Table 23. Tri-Study Fixed Generation
Old Middle Young
(5) Sofa setee 1 blank 1 sofa 1 bench 1 couch 1 loveseat 1 sofa 2 couch 2 lounge 1 (3) Mantel mantel 2 mantelpiece 1 mantle 2
mantel piece 1
mantel 4 mantelpiece 1 fireboard 1 (12) Wardrobe cabinet 1 wardrobe 1 rack 1 NR 2 wardrobe 1 armoire 3 wardrobe 3 (38) Siding ledge 1 weatherboarding 1 blank 1 siding 1 weatherboarding 1 blank 1 siding 2 weatherboarding 2 wooden boards 1 blank 1 (7) Bedspread comforter 1 blanker 1 comfort 1 bedspread 1 quilt 1 comfort 1 duvet 1 comforter 1 bedspread 1 quilt 2 comfort 1 (6) Wimdow Shades shades 2 curtains 1 blinds 1
window shades 1 shutters 1 shades 2 shutters 1 curtains 2 blank 1 (78) Clouding up cloudy 1 blustery 1 going to have falling weather 1
storm moving in 1 clouding up 1 scuds a building 1
storm rolling in 1
looks stormy 1 stormy 1
blank 1
clouding up 1 getting bad 1 (79)
Heavy Rain
downpour 1 flood of rain 1 NR 1
pouring rain 1 big rain1 cloudburst 1
downpour 1
blank 1 (80)
Thunderstorm
thunderstorm 2 thundersquall 1
storm 2
thundercloud 1
thunderstorm 3 thundercloud 2 blank 1
(109) Cobbler
apple tart 1 blank 1 cobbler 1
cobbler 1 NR 1 blank 1
pie 1 cobbler 3 family pie 1 apple cobbler 1 (127)
Dragonfly
skeeter hawk 1 blank 1
NR 1
skeeter hawk 1 mosquito hawk 1 NR 1
mosquito hawk 4 dragonfly 1 NR 1
(133) Wife
wife 1 my wife 1 blank 1
wife 3 wife 2
my wife 2 blank 1 Table 24. Tri-Study Fixed Generation Responses
The old and middle generations each have three members, one from each recording set, while the youngest group contains the remaining six participants with two being from each recording set. As expected from the larger number of participants, the younger group contains more
variability, on average, in terms of lexical choice than the other two generations. Though, comparing the fixed generation findings to the
findings from the historical generations, the variability from the younger group may better be contributed to the generation variable itself as
opposed to the number of members in that category. Looking at this category, while there is more variability in responses seen in the youngest generation group, only one of the twelve items shows lexical change across the three datasets. This lexical change is seen in the token thunderstorm where the oldest generation most often refers to it as
responses: armoire (said three times) and wardrobe (said three times). Because both armoire and wardrobe were given as the primary response with the same frequency, it is not possible to assign one as the most used term for the youngest generation group and therefore not possible to assess the variation between groups.
While it is not possible to evaluate the variation between these generation groups, when the variable is expanding to historical generation a clearer pattern emerges. Historical generation refers to the actual generation value for each participant and creates the following division seen in Table 25:
Civil War Reconstruction Greatest Silent Baby Boomers
Gen X NC24A1
NC23A1
NC23B1 NC24B1
NC24N2 NC24A2 NC23B2 NC23E3
NC24B2 NC23F3
NC23B3 NC23K3 Table 25. Tri-Study Historical Generation
With this division, not only are the participants are more evenly distributed, but the generations here also correspond to specific years and time frames. This allows for a better understanding of lexical
preferences over a concrete period of time. Table 26 provides a response breakdown for each generational group.
Civil War Reconstruc tion
Greatest Silent Baby Boomer
Generati on X (5)
Sofa
sofa 1 bench 1
sofa 1 lounge 1
blank 1 couch 2 setee 1
couch 2
loveseat 1
sofa 1 (3)
Mantel
mantel 1 mantelpiec e 1
fireboard 1
mantelpiec e 1
mantelpi ece 1
mantel 2 mantelpi ece 1
mantel 2
mantel 2
(12) Wardrobe
wardrobe 1 NR 1
wardrobe 2 rack 1 armoire 1
cabinet 1
NR 1
wardro be 2