E
SSAYS ONI
MPERFECT ANDD
YNAMICC
OMPETITIONWilliam Edwin Watkins
A dissertation submitted to the faculty of the University of North Carolina at Chapel Hill in par-tial fulfillment of the requirements for the degree of Doctor of Philosophy in the Department of
Economics.
Chapel Hill 2019
Approved by:
Brian McManus
Gary Biglaiser
Peter Norman
Jonathan Williams
c 2019
ABSTRACT
WILLIAM EDWIN WATKINS: Essays on Imperfect and Dynamic Competition. (Under the direction of Brian McManus)
This dissertation studies issues of imperfect and dynamic competition taking as motivation strategic interaction in the United States paper industry. The components of this work focus on both theoretical and empirical issues that arise in asymmetric oligopoly markets more generally.
The first chapter considers that when consumers recycle a good, the future supply of interme-diate inputs increases. If some of the inputs are used to manufacture a good that competes with the original good, the initial seller faces an incentive to reduce its supply to limit this source of future competition. I illustrate this incentive in a model of dynamic oligopoly, and test the predictions using data from the US paper industry between 1973 and 1993. I find that firms decrease quan-tity in response to policy changes that increase competition from firms using the recycled input. I then use the model to illustrate two implications: (i) the response to strategic incentives may lead antitrust authorities to underestimate the exercise of pre-merger market power, and horizon-tal mergers let firms internalize their effects on future competition, resulting in a greater supply reduction post-merger; and (ii) the policy trade-off between reducing harms from pollution and reducing the exercise of market power under oligopoly is sharper when firms respond to dynamic incentives.
ACKNOWLEDGMENTS
This dissertation benefited greatly from the time and guidance of many people during my time at the University of North Carolina. First, my advisor Brian McManus who was always willing to give me feedback particularly in framing my work to focus on the key question. He also taught me how to be a better economist in my research, teaching and interaction with other researchers.
My other committee members: Gary Biglaiser, Peter Norman, Jon Williams and Andy Yates, all provided helpful and timely guidance during the dissertation. These insights brought up in these discussions have illuminated topics for future research that grew out of the projects that compose this dissertation. The committee members also provided valuable guidance focusing the discussion of the underlying economic incentives and information on further opportunities for professional development.
Various other members of the UNC community helped me along the way. In particular, my classmates were sources of strength in classes, research, and life outside of academia. I value the benefit of interacting with intelligent researchers who were also going through the process of generating new economic ideas. Other members of the UNC Economic faculty provided helpful discussions of both the projects in the dissertation and other skills necessary for succeeding in research. Members of the UNC Applied Microeconomic research group provided early feedback on the project that was helpful for pitching the work to a more general audience.
TABLE OF CONTENTS
LIST OF TABLES . . . viii
LIST OF FIGURES . . . ix
1 The Dynamic Effects of Recycling on Oligopoly Competition: Evidence from the US Paper Industry . . . 1
1.1 Introduction . . . 1
1.2 Industry Background and Data . . . 8
1.2.1 Paper Industry Background . . . 8
1.2.2 Mill Level Data . . . 9
1.2.3 Market Level Data . . . 12
1.3 A Theoretical Model of Dynamic Oligopoly Competition . . . 16
1.3.1 Model Set Up . . . 16
1.3.2 Analysis of Firm Incentives . . . 18
1.3.3 Extensions to the Theoretical Model . . . 22
1.3.4 Implications for Policy Makers . . . 23
1.3.5 Model Assumptions and Discussion . . . 26
1.4 An Empirical Model of Primary Firm Response to Dynamic Incentives . . . 28
1.4.1 Empirical Specification of Firm Behavior . . . 28
1.4.2 Identification . . . 31
1.4.3 Primary Quantity Response . . . 33
1.4.4 Primary Best Response . . . 35
1.5.1 Simulation Motivation and Setup . . . 37
1.5.2 Results and Discussion of Simulations . . . 39
1.6 Conclusion . . . 47
2 Price Leadership and the Limit of Asymmetric Cournot Competition . . . 49
2.1 Introduction . . . 49
2.2 Model Set-Up . . . 51
2.2.1 Illustration of Result . . . 53
2.3 Markets with Many Leaders . . . 55
2.4 Endogenous Market Structure . . . 58
2.4.1 Free Entry . . . 58
2.4.2 Discussion . . . 60
2.5 Conclusion . . . 62
A Appendix . . . 64
LIST OF TABLES
1.1 Mill level summary statistics . . . 11
1.2 Product level concentration . . . 15
1.3 Likelihood a subsidy law is enacted . . . 32
1.4 Primary firm quantity supplied regressions . . . 33
1.5 Primary firm best response regressions . . . 36
A.1 Timing and level of subsidy laws . . . 72
A.2 Company level summary statistics . . . 73
A.3 Reycled input input-output table . . . 73
A.4 Price regressions . . . 74
A.5 Estimation of recycling rate . . . 74
A.6 Relationship between recycling rate and stock of recycled paper . . . 74
A.7 Relationship between recycling and tipping fees . . . 75
A.8 Regional summary statistics . . . 75
LIST OF FIGURES
1.1 Supply trends by paper product . . . 10
1.2 Paper supply and recycling trends . . . 12
1.3 Share of paper covered by subsidy over time . . . 13
1.4 Consumer recycling trends . . . 14
1.5 Markup simulations . . . 39
1.6 Merger exercise: Primary quantity . . . 41
1.7 Merger exercise: Consumer surplus . . . 42
1.8 Subsidy exercise: Primary quantity . . . 44
1.9 Recycling exercise: Primary quantity . . . 45
1.10 Recycling exercise: Total quantity . . . 46
2.1 Comparative Statics: Free-Entry Model . . . 59
A.1 Concentration exercise . . . 72
A.2 Merger exercise: Total supply . . . 76
A.3 Tax exercise: Primary quantity . . . 77
A.4 Depreciation exercise: Primary quantity . . . 78
A.5 Illustration of dynamic markup . . . 78
A.6 Illustration of dynamic best response . . . 79
CHAPTER 1
THE DYNAMIC EFFECTS OF RECYCLING ON OLIGOPOLY COMPETITION: EVIDENCE FROM THE US PAPER INDUSTRY
1.1 Introduction
A firm with market power may forgo current profits to alter future competition.1 When con-sumers recycle a good, the future supply of intermediate inputs increases. If some of these inputs are used to create a good that competes with the initial good, this intertemporal link creates an incentive for the original producer to reduce supply below the optimal static level to limit future competition. In markets with many original sellers, a supply reduction by one of these firms also benefits the others in the future. Therefore, firms face a weaker incentive to reduce supply in an oligopoly than in a market with a single original seller.
The US paper industry provides a natural setting to study the dynamic effects caused by recy-cling on oligopoly competition. This industry includes two types of strategic firms: primary firms that produce only from virgin wood, and secondary firms that produce only from recycled paper. Between 1970 and 2015 the consumer paper recycling rate increased from 25% to 67%, resulting in a significant increase in the availability of the recycled input to the secondary firms. This in-crease in recycling changed the competitive landscape with the percentage of total paper supplied by primary firms declining from 76% in 1970 to 48% in 2015.
My analysis proceeds in 3 steps. First, I develop a theoretical model of dynamic oligopoly competition with a recyclable good and use this model to generate empirically testable hypotheses. I then use data on the US paper industry to test whether primary firms reduce their quantity supplied in response to incentives created by increased competition from secondary firms. Finally, I use the
1Shapiro (1989) and Besanko, Doraszelski, and Kryukov (2017) discuss a wide range of models that feature this
model to illustrate and quantify the implications of the model’s incentives on equilibrium outcomes of policy interventions.
I illustrate the strategic incentives faced by firms using a dynamic oligopoly model that captures key features of the US paper industry. The key assumptions of the model are: (i) primary firms are harmed by secondary firms’ supply, and (ii) an increase in one period’s quantity supplied lowers secondary firms’ future marginal costs. The combination of these forces causes primary firms to reduce quantity supplied below the levels that static, strategic incentives would imply.2 When there
are multiple primary firms in a market, an individual firm bears the full opportunity cost, in terms of forgone profits, of reducing its supply in a given period. However, all primary firms share the benefit of softer future competition. This externality between primary firms weakens the incentive for an individual primary firm to reduce quantity supplied relative to the previous literature in which only a single primary firm sold new goods in the market.
To test the hypotheses of the model, I construct a unique dataset on each paper mill in the United States operating between 1973 and 1993. These data let me both identify mills as either primary or secondary, and calculate these mills’ quantity supplied. These two pieces of information let me match the empirical outcome to the theoretical predictions. I also collect information on government policies, demand and cost factors, and data on regional recycling markets. These variables let me account for other factors that more fully describe supply behavior. Finally, I control for technological differences that existed across paper products during this sample period that made the intensity of secondary competition differ across products in my empirical specification.
I organize the data such that the fundamental unit of observation is a primary firm manufactur-ing a specific paper product in a given state and year. My regression specifications use variables that influence the intensity of competition from the secondary firms as the key covariates of interest, and I take the primary firm’s quantity supplied as the outcome of interest. I test the hypotheses of the model by investigating (i) whether firms respond to more intense competition from secondary
2Fudenberg and Tirole (1984) provide a taxonomy of dynamic incentives that my model fits into. In particular, (i)
firms in the contemporaneous period, and (ii) whether primary firms account for the intertempo-ral link between current supply and more intense future competition when strategically setting quantity.
I use several key sources of variation in the empirical analysis. The first source comes from state subsidies for secondary firms. These subsidies incentivize secondary firms to increase supply, making these firms more intense competitors. A primary firm should respond to this increased competition by reducing its current supply. The enactment of these subsidies varied over time and across states in response to time varying electorate preferences for environmental regulation. I also exploit variation in the stock of recycled inputs. An increase in the stock directly decreases secondary firms’ costs and should lead to a strategic reduction in primary quantity supplied. The final source of variation comes from the consumer, paper recycling rate, which differs over time and across regions. This rate responds to the opportunity cost of not recycling faced by the consumers in each market. As the recycling rate increases, the future stock of recycled paper increases for any given current supply, which lowers secondary firms’ future marginal costs. A strategic, forward-looking primary firm must decrease its supply by a greater amount in the current period to achieve the same amount of competition softening as a firm observing a lower rate. Therefore, primary firms’ response to changes in the recycling rate provide variation in dynamic incentives.
only respond to static incentives.
I use the model to study the interaction between dynamic incentives and policy design through a series of simulation exercises. For each exercise, I compare the solution of the dynamic model to an alternative model in which firms behave myopically. I motivate these exercises using changes in the paper industry that occurred during the sample period. The paper industry experienced a wave of horizontal consolidation with the top four firms’ market share increasing from 20% to 51%. This change in market structure motivates an exploration of the incentives for and equilibrium effects of horizontal mergers in markets with dynamic incentives. I first simulate the model to study primary firm markups and market concentration, and I compare the difference in these measures for the case in which firms are forward-looking and myopic. The second set of simulations consider equilibrium outcomes of an exogenous merger between primary firms in the model. The last set of exercises focus on environmental policy towards the US paper industry. State and local governments implemented several kinds of policies during the period aimed at the policy goal of limiting environmental damages from primary production. I simulate a range of policies that illustrate how the equilibrium outcome of different methods of influencing firms’ behavior are affected by the dynamic, strategic incentives.
this setting. Because antitrust authorities that ignore the dynamic effects will also underestimate the exercise of market power pre-merger, the authority will be more likely to approve mergers than if it accounted for the dynamics. Because the antitrust authorities focused on the static, competitive incentives during this time period, my model suggests the horizontal merger policy may have been too permissive towards this industry during the sample.3
Horizontal mergers let primary firms internalize the competition softening effect of a supply reduction. In my simulations, this internalization results in a long run reduction in supply that is 25% greater in the dynamic relative than in the myopic model. Therefore, standard antitrust analysis also underestimates anti-competitive behavior by ignoring the internalization of the dy-namic competition softening incentive. In the long run, the quantity reduction by the merged firms successfully raises the secondary firms’ input costs, leading the primary firms to exercise greater market power in the long run. Consumer surplus decreases by a 25% greater amount in the long run in the dynamic model.
I also simulate government policies to study the effectiveness of these policies in shifting pro-duction away from the more environmentally damaging primary propro-duction. Exercises that impose the subsidy observed in the empirical setting show these policies are more effective at reducing pri-mary supply in the dynamic model. The greater reduction occurs because pripri-mary firms recognize the subsidy makes competition from secondary firms more intense in both the current and fu-ture periods. Thus, forward-looking primary firm reduces current supply to partially offset fufu-ture competition. I show that increasing the recycling rate can be a more effective policy in reducing primary supply. Doubling the recycling rate leads to a short run reduction of primary quantity by 19% in the dynamic model but does not affect the myopic model. The difference between the mod-els is that increasing the recycling rate makes it more difficult for the primary firms to soften future competition. Therefore, the primary firm must decrease its current supply by a greater amount in a given period to soften future competition and forgoes more profits. In response to both policy
3“the post-acquisition HHI is well below the critical level...the evidence herein fails to establish that the
exercises, the total quantity supplied decreases by a greater amount in the dynamic model because of the primary firms’ strategic response. The result of these exercises suggest that policy can more effectively eliminate the environmental harms from production when firms are strategic and forward-looking. However, the strategic supply reduction by primary firms result in a contraction of total supply and greater exercise of market power.
My work contributes to several strands of literature. My theoretical model relates to work used to study the dynamic supply problem of Alcoa based on the famous antitrust ruling of Judge Learned Hand in United States v. Alcoa (1945). These models generate similar intertemporal sup-ply incentives as created by durable goods and resale markets.4 Gaskins (1974), Swan (1980), and Martin (1982) consider models in which a dominant firm producing from virgin inputs competes against a competitive fringe that recycles the good. I differ by considering multiple primary firms and allowing secondary firms to exercise market power. The modeling extension lets me analyze the how dynamic incentives interact with changes in market structure.
Several other authors have developed models that explore the dynamic effects of recycling on oligopoly competition. Their work focus on the primary firm’s foreclosure incentive (Hollander and Lasserre (1988) and Samba (2017)) or assume firms can commit to supply paths (Gaudet and Long (2003) and Sourisseau, Beir, and Ha-Huy (2017)). My work differs by focusing on competition softening incentives without assuming firms can commit to strategies, which lets me study endogenous responses to policy changes.5
I also contribute to the analysis of the incentives for and equilibrium effects of horizontal mergers by focusing on how the dynamic incentives caused by recycling interact with mergers. I find the dynamic externality between primary firms make horizontal mergers between these firms more likely, with or without impacts on marginal costs as in Perry and Porter (1985) and Salant,
4The result that a monopolist creates its own competition by selling a durable good creating a dynamic pricing
problem was proposed in Coase (1972). Other important contributions to this literature include Stokey (1981), Bulow (1982), Bulow (1986), and Gul, Sonnenschein, and Wilson (1986). See Waldman (2007) and the references therein for a survey of this literature.
5Belleflamme and Ha (2018) is the closest model to mine although they only let oligopoly competition occur in the
Switzer, and Reynolds (1983) respectively. The post-merger quantity reduction is also greater in my setting suggesting that mergers are more harmful to consumers, so standard merger evaluation that ignores this channel can be too permissive.6 Designing merger policy to deal with these dynamic effects is still a relatively new area of study. Nocke and Whinston (2010) and Nocke and Whinston (2013) study policy with endogenous mergers, and Gowrisankaran (1999) studies how dynamic mergers affect other dynamic outcomes. In comparison to these papers, I focus on the incentives for and equilibrium impact of exogenous mergers under a specific dynamic incentive to illustrate the consequences of ignoring dynamics.
Researchers have also explored the effect of recycling on firm behavior with either a domi-nant firm or perfect competition. Suslow (1986) provides an empirical study of Alcoa’s supply problem based on the previous theoretical literature. Sigman (1995) examines how different pol-icy instruments affect equilibrium outcomes in the competitive lead battery industry. I consider how strategic behavior interacts with environmental policy in a dynamic setting. This extension is necessary to think about the interaction between strategic incentives and policy designed to limit environmental harms.7
My work also contributes to the analysis of competition in the US paper industry. Pesendorfer (2003) and Christensen and Caves (1997) focus on cost synergies from horizontal mergers and whether mills use capacity expansion announcements as cheap talk, respectively. Hervani (2005) studies the newsprint industry. He provides evidence that secondary firms have market power in purchasing recycled inputs but only considers static incentives.
Finally, the theoretical incentives I identify relate to analysis of competition across markets. I study a case in which firms’ strategic incentives are influenced by competitive concerns over time. My model is a specific example of the framework developed by Bulow, Geanakoplos, and Klemperer (1985) and Fudenberg and Tirole (1984). I use recycling as a new channel to generate
6Farrell and Shapiro (1990) and Whinston (2007) provide a more detailed discussion of the welfare impacts of
horizontal mergers. These authors’ results illustrate how accounting for gains from firms not involved in the merger may be large enough to counteract the loss in consumer surplus.
7By considering dynamics I also illustrate a dynamic version of the trade-off between eliminating environmental
these strategic incentives in a dynamic oligopoly.
The rest of the paper is organized as follows. I provide a discussion of the data and industry in section 1.2. Section 1.3 discusses the theoretical model and derives the implication of the model. In section 1.4, I develop, estimate and discuss the empirical specifications. Section 1.5 setups and discusses the results of the simulation exercises. I conclude in section 2.5.
1.2 Industry Background and Data
1.2.1 Paper Industry Background
Firms in the paper industry manufacture a collection of products. I follow industry sources and divide final products into mutually exhaustive categories such that within each category the good is homogeneous.8 Production takes place at mills that transform the necessary intermediate input, pulp, into paper. Production capacity is limited by the mill’s number of paper machines, which are the key piece of capital equipment needed to create paper. Industry sources report that mills must incur a large, sunk cost to purchase new machines or expand capacity. These sunk costs provide incentives for mills to operate near full capacity and represent a significant barrier to entry.
Two sources of pulp combined to account for 99% of all inputs during my sample period. The first is virgin wood. Firms harvest timber and then apply heat and chemicals to turn virgin wood into pulp. The second source is recycled paper. This paper is collected from consumers and transformed back into pulp by combining the paper with water and chemicals.
The amount of inputs needed to produce a product differs depending on which type of pulp the mill uses. Farla, Blok, and Schipper (1997) surveyed paper mills across developed countries and found that primary mills required between 2.5 and 6 gigajoules of electricity per ton of paper manufactured while secondary mills required approximately 1.4 gigajoules per ton of paper. Ince (1993) also estimated differences in labor intensity with a ton of newsprint requiring 0.46 labor hours at a primary mill but only 0.13 labor hours at a secondary mill.
The paper industry also generates several kinds of environmental damages. This industry ac-counted for approximately 15% of US industrial energy usage in 2001 (US Department of Energy,
8Ince, Li, Zhou, Buongiorno, and Reuter (2001) provide a detailed discussion of the similarities and differences
2005). Hence, some of the harms from production arise from damages associates with this en-ergy usage. Producing from secondary inputs instead of primary inputs is estimated to greatly reduce this energy usage.9 The chemicals used to manufacture paper also harm water quality and are regulated under the Clean Water Act (1972). Finally, paper made up the plurality of tonnage in municipal solid waste (MSW) facilities (Franklin Associates, 1988). Government agencies dis-cussed how policies aimed at both encouraging the use of secondary paper and increasing recycling provided an added benefit of limiting harms originating from MSW facilities.10
1.2.2 Mill Level Data
I combine two mill-level datasets to study the effects of recycling on oligopoly competition. The first is the Lockwood Post Directory (LP), an industry source that collected annual data from each paper mill operating in the US. This information includes the mill’s paper capacity level, the location of the mill, specific capital equipment owned at the mill, the corporate owner of the mill, and other information. The second source comes from United States Department of Agriculture’s Forest Product Laboratory (FPL). The FPL data provides the specific paper product manufactured at each mill, and the share of each product produced from primary and secondary inputs. I collect data from these sources each year between 1973 and 1993.11
I create my sample of 546 mills by matching mills between the two data sources. This process drops approximately 300 mills from the LP dataset. The mills excluded from the sample are composed of two specific types of mills. The first are 40 pulp mills that did not manufacture paper so did not compete in the relevant product market. The second set of excluded mills manufactured construction board. FPL did not collect data on input usage from these mills, so I was unable to construct a measure of input usage for these mills. Construction board is intended for long-life cycles and is mainly sold to the construction industry. In comparison, the paper products included in the sample are sold for a single use to households and businesses. Therefore, the
9A special report on recycling estimated that producing paper from recycled instead of virgin inputs reduced energy
usage by 40%. The Economist, “The truth about Recycling” June 7th2007.
10See EPA (1988) and OTA (1989) for a more detailed discussion of these issues.
time horizon and demand characteristics differ significantly between these types of mills. The construction board industry also experienced significant exit over this sample period, creating an issue for isolating the dynamic effects created by recycling from other dynamic incentives.12
Primary firms accounted for the majority of supply over the sample period. A similar pattern holds at the mill level with primary mills averaging 450 tons of paper per day while secondary mills averaging 125 tons per day.13 Most primary production occurred at vertically integrated
mills while secondary mills purchased inputs from independent wholesalers. Plant and Steiker (1978) suggests that vertical integration created returns to scale in primary production providing an efficiency advantage. Integration along the supply chain also let primary firms eliminate successive monopolization for inputs creating a further cost advantage.
1000
2000
3000
4000
5000
Tons/day
1975 1980 1985 1990 1995
YEAR
Supply Recycled Supply Virgin
0
5000
10000
15000
Tons/day
1975 1980 1985 1990 1995
YEAR
Supply Recycled Supply Virgin
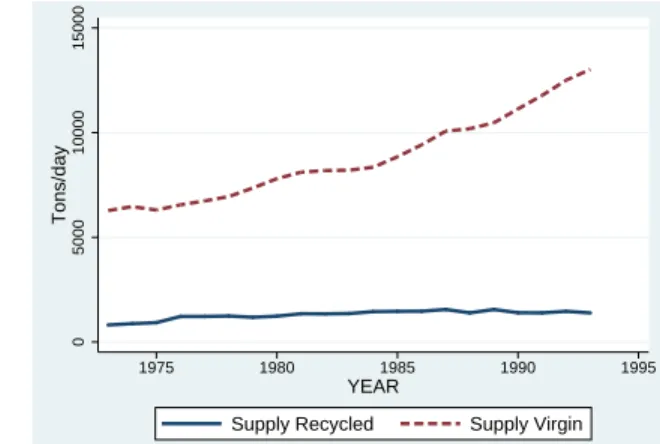
Figure 1.1: Difference in supply by input used between final product categories. Cardboard boxes (Left) and Printing Paper (Right).
A further source of heterogeneity in the paper industry comes from consumers’ preference for primary products arising from aesthetic qualities of the products.14 For example 21.1% of
cardboard boxes were manufactured from secondary inputs in 1975 while only 6.7% of printing paper was. These differences also exist over time with Figure 1.1 showing that the supply was flat
12A third of the construction paper mills manufactured roofing materials, which used asbestos based inputs. These
mills experience a large, negative demand shock as the health risks of asbestos became widely understood.
13This difference in capacity also holds across the distribution of capacity with the likelihood that a given mill uses
primary inputs increases as the capacity of the mill increases.
14For example consumers care about the brightness of printing paper, a characteristic that primary inputs are better
or declining for primary cardboard boxes but increasing for primary printing paper. In comparison, these trends are reversed for the secondary supply of these two paper products. Ince (1993) showed that the technological ability to produce paper from recycled input also differed across products. For example, the technology to transform recycled cardboard boxes into new cardboard was in widespread use while it was impossible to transform used tissue paper into new tissues during this period. These technological differences create cross-sectional variation in competition across products. An increase in current supply by primary firms for which this technology exists leads to a direct increase in future competition while this channel does not exist for firms not exposed. Thus, the dynamic, strategic incentives differs for similar firms that produce different finished products.
Table 1.1: Mill-Product Level Summary Statistics
Product Share Primary Avg. Capacity (tons) Share West Share Midwest Share Northeast #Mills Obs
Coated Freesheet 95% 306 5.6% 46.7% 26.1% 37 645
Coated Groundwood 100% 482 2.8% 38.1% 41.2% 21 360
Kraft Paper 70.7% 358 19.1% 11.2% 15.1% 42 597
Newsprint 75.1% 695 37.4% 8.8% 9.9% 29 476
Tissue Paper 38.3% 139 15.2% 22.6% 45.5% 123 1979
Uncoated Freesheet 85.5% 259 8.7% 36% 35.9% 122 2187
Uncoated Groundwood 88.7% 248 11.6% 24.4% 51.2% 27% 347
Special Paper 89.6% 96 4.6% 24.8% 51.3% 74 1398
Corrugating Medium 44.6% 333 18.7% 30.8% 14.3% 88 1245
Linerboard 64.4% 722 24.4% 15.7% 3.1% 84 1263
Solid Bleached Board 100% 726 11.8% 0% 0% 26 474
Recycled Paperboard 0% 143 10.2% 31.8% 38.6% 176 3078
Note:All calculations at the product-mill level. Share of primary calculated calculated from FPL data. For
approximately 80% of these observations, the mill level and product level are the same. I adjust the remaining observations using the share of each product manufactured as weights.
Table 1.1 provides summary statistics at the product-mill level for paper capacity, the share of production using primary inputs, and the share of mills in each region of the country.15 These statistics illustrate that the aggregate trends also hold at the product level because products that use a greater share of primary inputs also have greater capacity. For most goods, the majority of production at a given mill comes from primary inputs. There are exceptions for which secondary accounts for the majority of the share of production such as corrugating medium and tissue paper.
15In the Appendix, I reproduce this table using the firm-product category as the unit of observation. The average
Regional differences also exist across product categories. For example, most tissue paper mills (45.5%) are located in the Northeast while the rest of the tissue paper mills are relatively evenly spread across the other regions. This regional variation provides differences in demand, cost and features of the recycling market that influence supply incentives.
1.2.3 Market Level Data
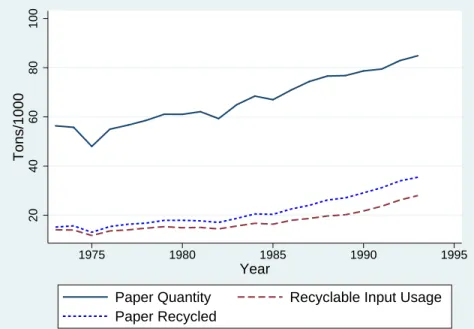
I next discuss trends in the recycling market that help provide variation in firms’ supply in-centives. The amount of paper recycled increased from 15.2 million tons in 1973 to 35.5 million tons in 1993 while the tons of recycled paper used as secondary inputs at paper mills increased from 14.1 million to 28 million.16 The total supply of paper increased from 65 million tons to 91.6 million tons over this time frame. Figure 1.2 illustrates the evolution of these time series.
20
40
60
80
100
Tons/1000
1975 1980 1985 1990 1995
Year
Paper Quantity Recyclable Input Usage Paper Recycled
Figure 1.2: Total Paper Usage, Amount of Paper Recycled and Use of Recycled Inputs by Paper Mills over Time
The share of paper produced from secondary inputs varied over the sample; however, this share was essentially flat between 1973 and 1981, changing from 25% in 1973 to 24% in 1981. Starting in 1981, state governments began implementing policy aimed at shifting production to secondary
16The total amount of paper recycled continued to increase after my sample period; however, the usage of the
firms. The share of paper produced from secondary inputs increased to 34% by 1993, Howard and Jones (2016). The timing of the increase in the share of secondary production provides some evidence that policy contributed to the shift in production. The Bureau of Economic Analysis reported that annual state and local government expenditures on paper rose from$546 million to$4 billion over this time frame, illustrating that implementing these policies also involved significant spending.
The major policy enacted during my sample involved subsidizing each ton of secondary paper purchased by the government.17 I document the timing and level of subsidies in Table A.1 in the
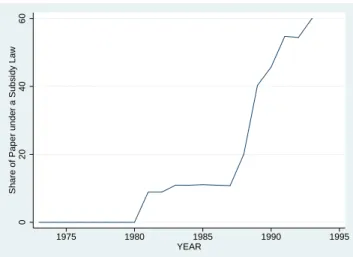
Appendix. New York enacted the first subsidy in 1981 and starting in 1989 there was a rapid increase in states enacting subsidies with 19 subsidies enacted between 1989 and 1993. In Figure 1.3, I illustrate the share of paper produced in states with a subsidy law. This figure illustrates that large increases in the share covered came from both states that produce a large amount of paper, such as New York, and years in which many states enact a law, such as in 1989 when seven states enacted subsidies.
0
20
40
60
Share of Paper under a Subsidy Law
1975 1980 1985 1990 1995
YEAR
Figure 1.3: Share of Paper Covered by State Subsidy Laws over Time
Note:Based on author’s calculation using state subsidy laws, mill level production and share of products from different inputs.
17Secondary firms receive a subsidy proportional to the price the government pays to primary firms in states with
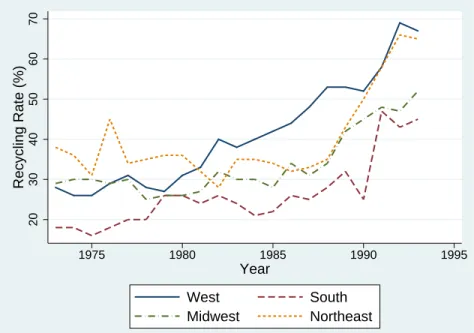
Differences in government policy and the opportunity cost of recycling created variation in the recycling rate across different regions of the US and over time as illustrated in Figure 1.4. Recy-cling became more common over time in all regions. However, the level and trends for recyRecy-cling differ across regions. In markets in which consumers recycle a greater amount the future costs of secondary firms are lower all else equal, so the dynamic supply incentives also depend on these differences in recycling. I also collected other variables that influence recycling such as the time varying opportunity cost of disposing of the good in a landfill, the landfill tipping fee.
20
30
40
50
60
70
Recycling Rate (%)
1975 1980 1985 1990 1995
Year
West South
Midwest Northeast
Figure 1.4: Consumer Recycling Rate over Time and Regions
Appendix, I display the input-output table used to construct the stock for each product.
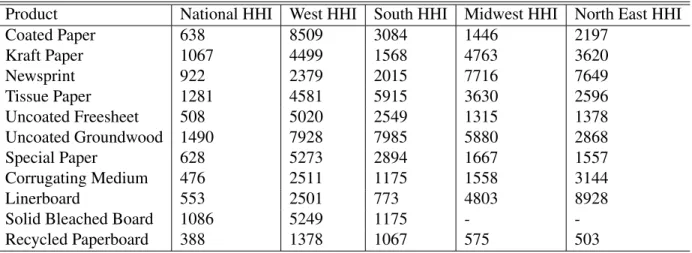
Table 1.2: HHI by Final Product and Region
Product National HHI West HHI South HHI Midwest HHI North East HHI
Coated Paper 638 8509 3084 1446 2197
Kraft Paper 1067 4499 1568 4763 3620
Newsprint 922 2379 2015 7716 7649
Tissue Paper 1281 4581 5915 3630 2596
Uncoated Freesheet 508 5020 2549 1315 1378
Uncoated Groundwood 1490 7928 7985 5880 2868
Special Paper 628 5273 2894 1667 1557
Corrugating Medium 476 2511 1175 1558 3144
Linerboard 553 2501 773 4803 8928
Solid Bleached Board 1086 5249 1175 -
-Recycled Paperboard 388 1378 1067 575 503
Note:All calculations at the product level. Mill level capacity is adjusted for product. Ownership data constructed
from LP.
One concern given the number of firms in the US paper industry is that firms may not be able to affect equilibrium outcomes. If firms instead behave as price takers, then changes in supply comes only from changes in market primitives instead of strategic decisions. To investigate this possi-bility, I calculate the HHI at both the national and regional level. My preferred market definition takes the United States Forestry Service (USFS) regional definitions as the markets. I present the results of these specifications in Table 1.2. At the national level the market is relatively unconcen-trated but within regions concentration is higher. For example the Uncoated Freesheet market is unconcentrated at the national level but is significant to highly concentrated in each region using the definitions in the Horizontal Merger Guidelines (2010).18
To provide empirical justification for the regional market definition, I calculate shipment flows using the Public Micro Data from the 2012 Commodity Flow Survey (CFS).19 At least 70% of
shipments of paper originating at a mill in a specific region goes to a consumer within the same
18I return to the issue of firm concentration in section 1.5. The results in that section suggest that if anything the
observed HHI underestimates the exercise of market power.
19I compared these results to earlier shipment data in the 1967 and 1977 Census of Transportation. The flows for
region. While there are cross-regional shipments, the regional definitions appear reasonable given the shipment data. I report the shipment information along with summary statistics of regional data in the Appendix. These regional definitions also agree with those used by the Federal Trade Commission (FTC) in evaluating horizontal mergers, and industry price reports.20,21
1.3 A Theoretical Model of Dynamic Oligopoly Competition
1.3.1 Model Set Up
I develop a dynamic model of oligopoly competition for a good that consumers recycle. The supply side of the industry is composed of 3 types of firms. The first are primary firms that use virgin intermediate inputs. The second are price-taking recycling wholesalers. Wholesalers collect the good from consumers and transform the recycled good into an intermediate input.22 The final set of firms are secondary firms that purchase the recycled input from the wholesalers. Primary and secondary firms move simultaneously with each firm,i, setting quantityqit∈R+in each periodt. I model the demand side as a representative consumer. This consumer views the good as homogeneous and has inverse demand based on the total quantity supplied,Qt =
P
qit, given by
P(Qt). The consumer does not store the good and makes a myopic purchasing decision.23 I assume the inverse demand function is continuous, decreasing, and concave in total quantity supplied.24
The price of the recycled input in period t depends on both the stock of the recycled input carried over from the previous period, Q¯t−1, and the cost of using other inputs such as labor.
An increase in the stock leads to a shift out in the supply curve of the recycling wholesalers. A
20See the discussion about market boundary definitions in the proposed acquisition of Menasha Corporations’s
corrugated medium assets in Oregon by Weyerhauser in 1980, Federal Trade Commission (1985).
21There are separate reports for the Southeast, Midwest, Southwest, Pacific Northwest, Los Angeles, San Fransisco,
Buffalo, New York and New England these results are slightly finer that what I use in the model.
22The assumption that wholesalers are price takers is not necessary for the result; however, this assumption easies
the explication.
23A dynamic demand model would let consumers base purchase decisions on inventories and the expected price path
of the good. These incentives are not a major concern in the paper industry with most deliveries being “just-in-time” to the consumers.
24This condition can be relaxed to allow for more general demand functions. In particular, the results will hold if
demand is convex provided that for each firm,i,P0(qi +Q−i) +P00(qi+Q−i)qi <0 whereQ−i is the quantity
sufficient condition for an increase in the stock to lower the cost of the recycled input is that the marginal productivity of the other inputs increases in the stock.
There areM ≥ 1primary firms. The cost for a primary firm,m, to supply a unit of the good isCm(qm), and this cost is increasing and convex in the quantity supplied by the firm. There are
N ≥ 1secondary firms. The total cost of a secondary firm, n, to produce a unit of the good is
Cn(qn) = ˜Cn(qn) +R(
PN
j=1qj,Q¯t−1)qn. There are two parts of this cost: (i) the cost of using inputs such as labor, C˜n(qn), and (ii) the cost of using the recycled input R(·)qn. I also assume thatCn(qn)is increasing and convex in the quantity supplied by the firm. As total demand for the recycled input increases, the price of this input increases. This assumption impliesR1 ≥ 0where R1 is the derivative of the recycled input price with respect to the total secondary demand for this
input. The assumption that an increase in the stock of recycled input decreases its price implies thatR2 ≤0. I further assume thatR1,2 ≤0, so the marginal change in input price from an increase
in secondary demand is decreasing in the stock of recycled input. Intuitively, the increase in supply from an increase in the stock has a greater effect than the increase in demand, so the equilibrium input price decreases from a small change in both stock and demand.
After consumers purchase the good in period t, they use and then recycle a share, ψt, of the good. The consumer discards the rest of the good to a landfill. This consumer recycling decision arises from a model of household behavior such as the one considered in Fullerton and Kinnaman (1995). The stock of the recycled input accumulates followingQ¯t=ψtp
PM
i=1qit+ψ
s t
PN
j=1qjt+
(1−δ) ¯Qt−1. The transition includes two terms. First the new inflows into the stock that lets the
recycling rate differ for the two types of firms.25 The stock also evolves based on the portion of the
stock carried over from the previous period that does not depreciate. The flow profit of a firmiis given by
πti(qit, q−it; ¯Qt−1) =P(Qt( ¯Qt−1))qit−Ci(qit).
25This specification lets the actual recycling rate differ to account for the possibility that a portion of secondary
Each firm’s payoff depends on its own action,qit, the actions of other firms, q−it, and the payoff relevant state variable, Q¯t−1. To ensure uniqueness of the equilibrium in the static version of the
game, I assume |πi,i| > Pj6=i|πi,j| ∀i, j, where subscripts denote derivatives with respect to the supply of firm. I define the value of firmirecursively as
Vi( ¯Qt−1) = max
qit
πit(qit, q−it; ¯Qt−1) +βVi( ¯Qt),
whereβ is the common discount rate used by all firms. I assume that firms play a Markov Perfect Equilibrium and use strategies that only depend on the stock and whether the firm is a primary or secondary firm.
1.3.2 Analysis of Firm Incentives
I next use the model to generate empirical predictions for the effect of recycling on firm behav-ior in a dynamic oligopoly. A series of steps establish the result. I first show how firms’ supply strategies change in response to variation in the stock of the recycled input. Then I show how firms’ profits change as the stock changes. I combine these two results to show how the dynamic incentive caused by recycling change firm strategies relative to a model without forward-looking behavior.26
Proposition 1.3.1 As the stock of the recycled input increases, primary (secondary) firms reduce (increase) equilibrium supply.
Proof 1.3.1 I derive the result for the case with a single firm of each type for illustrative purposes. More general results can be derived at the expense of clarity of the proof. Applying the implicit
function theorem to the system of first order conditions gives
π1,1dqm+π1,2dqn+π1,3dQ¯= 0
π2,1dqm+π2,2dqn+π2,3dQ¯= 0
where the partial derivatives are with respect toqm,qn, andQ¯respectively.
Rearranging this expression yields
dqm/dQ¯
dqn/dQ¯
=
π1,1 π1,2
π2,1 π2,2
−1
−π1,3
−π2,3
(1.1)
which exists under the assumption used to ensure uniqueness. π1,3 = 0because the stock has no
direct effect on the primary firm’s profit. Thus,dqm/dQ¯ ≤0becauseπ2,3 ≥0, by the assumptions
on the cost of using the recycled inputs, and because quantities are strategic substitutes.dqn/dQ¯ ≥
0becauseπ1,1 ≤0from the necessary condition for primary firm optimality.
The intuition for this result comes from the strategic substitutability of supply. An increase in the stock of recycled inputs decreases the secondary firm’s marginal cost resulting in a shift out in this firm’s best response function. The primary firm moves down its best response function resulting in a strategic reduction in supply. The result that an increase in recycled inputs makes competition more intense provides the first testable implication of the model.
Proposition 1.3.2 Aggregate supply increases as the stock of recycled input increases.
Proof 1.3.2 Rearranging the expressions used to sign the effect of stock on quantity shows that the
condition required for the result is|π1,1|>|π1,2|in the case with 1 primary and 1 secondary. This
is the condition assumed for uniqueness of the equilibrium.
The intuition behind this result is that secondary firms react directly to the increase in the stock while primary firms only strategically respond. Because the primary firm’s reaction function is relatively flat, the strategic reduction by the primary firm is less than the direct supply increase by the secondary firm.
I next establish how profits change as the stock of recycled inputs increases.
Proposition 1.3.3 Primary firms’ profit decrease as the stock of recycled inputs increases while
Proof 1.3.3 Consider the case of 1 primary and 1 secondary firm. The change in profit from a
increase in the stock of recycled inputs,∆ ¯Q, is
(∆ ¯Q)dπ 1
dQ¯ = (∆ ¯Q)[ ∂π1 ∂q1
dq1 dQ¯ +
∂π1 ∂q2
dq2 dQ¯ +
∂π1 ∂Q¯].
From the first order condition, the first term is zero and the last term is zero because the stock does
not enter the primary firm’s profit directly. Proposition 3.1 establishes the second term is negative.
Thus, the primary firm’s profit decreases as the stock increases.
Similarly the change in profit for the secondary firm is
(∆ ¯Q)dπ 2
dQ¯ = (∆ ¯Q)[ ∂π2 ∂q1
dq1 dQ¯ +
∂π2 ∂q2
dq2 dQ¯ +
∂π2 ∂Q¯].
The first term is positive from proposition 3.1, the second zero from optimality and the third is
positive from the direct effect of stock of secondary profit. Combining these results establishes the
result for the secondary firm.
The intuition for this result is similar to how changes in the stock of the recycled input affect firm supply. Primary firms reduce supply as the stock of the recycled inputs increase while sec-ondary firms increase supply. Primary firms are supplying less, and proposition 3.2 establishes that price decreases. The combination of the price and primary quantity supplied responses result in a lower profit for the primary firm.
With the results for how firms react within a given period established, I next derive how the dynamic incentives further affect firm behavior. For comparison, I consider a model in which the firms do not account for how current supply affects future periods. I term this alternative the myopic model and generate this benchmark by assuming that firms haveβ = 0.
Proposition 1.3.4 Relative to the myopic model, primary firms supply less in the model with dy-namic effects, and secondary firms supply more for any given stock of recycled input.
problems of a firm in the dynamic and myopic models are
max
qit
πit(qit, q−it; ¯Qt−1) +βVi( ¯Qt) (D)
max
qit
πti(qit, q−it; ¯Qt−1). (M)
There exists a vector of strategies q∗ that satisfy optimality for problem (M) for any given stock.
The first order condition for a firm in the dynamic model is
P0(Qt)qit+P(Qt)−Ci0(qit)
| {z }
Static F.O.C.
+ β∂Vi( ¯Qt) ∂qit
| {z }
Dynamic Ef f ect
= 0.
Consider a primary firm solving (D) starting at the optimal supply for (M). At this supply level, the
static F.O.C. equals zero while the dynamic effect is negative. From proposition 3.3, ∂Vi
∂Q¯ ≤0for a
primary firm because ∂π∂Q¯i ≤ 0for a primary firm. Therefore the first order condition of (D) for a
primary firm is negative atq∗.
Consider a decrease in supply by the primary firm to q0i < q∗i. The value of the static F.O.C.
increases because profits are concave. The future stock of the recycled input decreases, so the value
for this firm also increases. Therefore, the first order condition of (D) strictly increases. The firm
can further reduce supply until the first order condition of D returns to zero. A similar argument
establishes that an increase in supply relative toq∗ restores the first order optimality condition for
the secondary firm.
production in the current period their future marginal costs decrease.27
Collecting the results of the theoretical model yields two empirically testable hypotheses. First, an increase in the stock of recycled input increases contemporaneous supply of secondary firms, and primary firms respond by strategically reducing contemporaneous supply. Second, forward-looking primary firms reduce current supply to soften competition in comparison to myopic pri-mary firms.
The strategic incentives identified in this theoretical model also depend on the number of firms in the market. Relative to the dominant firm model that has been previously studied, the oligopoly model introduces three sources of externalities. First, the Cournot externality that each firm does not account for how a reduction in supply affects the profits of other firms, so total quantity sup-plied is greater in an oligopoly relative to a monopoly. Second, there is an externality between secondary firms because when a secondary firm increases input demand the price of the recycled input increases for all these firms. Finally, there is a dynamic externality. If a primary firm de-creases supply in the current period, other primary firms receive the benefit of the softer future competition. This last externality illustrates the strategic reaction to dynamic effects is weaker in the oligopoly model relative to a model with a single primary firm.
1.3.3 Extensions to the Theoretical Model
I discuss several differences from the baseline model introduced above that are important to consider in the empirical analysis below. First, I study how the policy variation used in my empiri-cal application interacts with firms’ incentives. I modify the model so that secondary firms receive a proportional subsidy,s≥0, on each unit sold. The flow profit of a secondary firmj becomes
(1 +s)P(Qt)qjt−C˜j(qjt)−R( N
X
n=1
qnt,Q¯t−1)qjt.
27If secondary production instead reduces the future stock of the recycled input then the incentive for the secondary
Because this policy does not change the sign of πi,j for either type of firm, the strategic supply incentives from the baseline model extend to the model with the subsidy. Therefore, the subsidy policy observed in the data does not change the prediction on the dynamic incentives although the magnitude of firms’ response may change. A similar argument to that used to establish firms’ response to an increase in the stock of the recycled input establishes that primary firms’ supply and profit decrease in response to the introduction of a subsidy. Intuitively, the subsidy increases secondary firms’ marginal revenues and shifts out these firms’ best response functions. This result provides another testable implication that primary firms reduce supply in response to the enactment of subsidies in a market.
In the theoretical model, I assumed that firms supply a single, isolated market. However, in the paper industry transportation costs are low enough that trade between markets occurs when arbitrage opportunities exist across markets. Trade between markets creates a concern because states pay subsidies based on the location of final consumers not the location of mills. In the Appendix, I use a model of regional trade based on Brander (1981) to illustrate that the dynamic effects can also hold in a model that allows strategic firms to trade between markets.
My model also assumes that consumers view primary and secondary products as homogeneous; however, consumer surveys provide evidence that consumers viewed primary goods as higher qual-ity. These preferences create a degree of product differentiation and provide a further source of competition softening. In the Appendix, I show conditions on demand systems exist such that the dynamic effects hold when consumers view goods as differentiated.
The final extension accounts for the interaction between the dynamic effects caused by recycled inputs and capacity constraints. Because capacity constraints limit rivals’ ability to respond to a reduction in supply, the incentive to soften future competition created by recycling is dampened. 1.3.4 Implications for Policy Makers
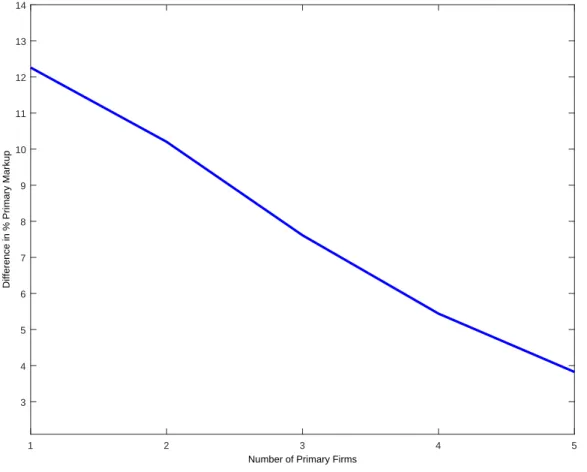
changes in concentration allow for inference on unobserved market power in homogeneous good Cournot models. Using concentration provides a measure of conduct under Cournot competition because there is a one-to-one mapping from the HHI to markups. See Shapiro (1989) for a detailed discussion of this issue.
To see that this relationship changes in the dynamic model, I rewrite the first order condition of a primary firm,i, as
LIi ≡
P −Ci0(qit)
P =
−sit
D
− δ
P
∂Vi( ¯Qt)
∂qit
. (1.2)
The first term on the right hand side gives the standard relationship between a firm’s markup and the share weighted inverse elasticity of demand. Summing over all firms gives the relationship between HHI and markups. From proposition 3.3, the addition of the dynamic term shows that primary firms exercise greater market power when these firms account for dynamic incentives. Thus, using only information on market shares and demand elasticity will lead antitrust authorities to conclude that primary firms are behaving more competitively pre-merger. Because of this underestimate of market power, antitrust authorities are likely to be too permissive in allowing mergers when these dynamic incentives are important.
Another alternative way to illustrate this issue comes from examining the market share of firms for the case in which primary firms have greater market share pre-merger.28 The supply reduction by primary firms, which yields the greater markup discussed above, also reduce their market share and increases secondary firms’ market share. Holding fixed the number of firms, these changes in market shares imply that market share in the model with dynamic effects are a mean-preserving reduction of the shares in the myopic model. Thus, the variance of market shares are lower in the dynamic model. This result implies that the HHI will be lower in the model with dynamic effects than without.29
28This case is more relevant for antitrust authorities for two reasons. First, most industries that feature similar
dynamic incentives are composed of large primary firms and small secondary firms. Second, the dynamic incentives lead to anti-competitive quantity reductions by primary firms and pro-competitive increases by secondary firms.
Antitrust policy makers must also consider the equilibrium effect of horizontal mergers. Be-cause oligopoly competition generates an externality between primary firms for softening future competition, this spillover between firms provides additional incentives for firms to merge. The internalization of the dynamic competition softening incentive leads to a greater reduction of quan-tity post-merger in the dynamic model because these firms now account for the combined firms’ future profits when setting current strategies. Internalizing competition softening provides a further incentive for primary firms to merge in the dynamic model.
The other major policy issue in the paper industry is the effectiveness of different instruments in shifting production towards more environmentally friendly producers. To examine the motivation for these policies, I consider the problem of the social planner. The planner chooses the quantities of the primary and secondary goods accounting for consumer demand, the production technologies and environmental damages created by primary production. I focus on the case in which primary production creates a damage, D(PM
i=1qi) ≥ 0, that is increasing and convex in primary supply. For example this function can represent the damages associated with the greater energy usage by primary mills. The total surplus in periodt, in the case with 1 primary and 1 secondary firm, is
T S(qt1, qt2,Q¯t−1) =
Z q1t+q2t
0
P(s)ds−C1(qt1)−C˜2(qt2)−R(q
2
t,Q¯t−1)−D(qt1). (1.3)
The planner chooses a sequence of primary and secondary supply to solve
∞
X
τ=t
βτ−tT S(q1τ, qτ2,Q¯τ−1)
s.t. Q¯τ =ψτpq
1
τ +ψ
s
τq
2
τ + (1−δ) ¯Qτ−1 and Q¯0 ≥0 given.
incentive to increase secondary supply. The third difference is the planner accounts for the environ-mental damages. Addressing these damages gives the planner an incentive to reduce the primary supply. Therefore, the planner produces a greater quantity than what occurs in the oligopoly, and the planner has an incentive to produce a greater share of the secondary good. Whether the in-centive to address the harms from market power or environmental damages is stronger, and hence which policy instrument is preferred, depends on parameters of the models.
1.3.5 Model Assumptions and Discussion
Several assumptions of the theoretical model merit comment. First, I do not allow the primary firms to collude in the model. Second, I consider the role of allowing strategic secondary firms. Third, the implication of heterogeneous costs are considered. I also discuss whether alternative methods of foreclosure are more profitable than strategic supply. Finally, I discuss how changes in demand over time interact with these incentives.
While I focus on equilibrium behavior that is only a function of the stock in the model, antitrust authorities are also concerned about the ability of firms to collude using strategies that account for the entire history of play. This alternative instead focuses on the subgame perfect equilibrium, and admits trigger strategies with the equilibrium discussed above as the punishment. While the analysis of this situation is beyond the scope of this paper, it is worth noting that the dynamics of the stock process may make collusion easier. That is, when a primary firm cheats on the collusive agreement, the punishment stage of the game begins in a state of the world with a higher stock. For any given discount factor, this fact implies the payoff from deviating is lower than without dynamics. Thus, the model suggests that it may be easier to sustain collusion in the dynamic model.
to limit costs from production, so the expected change involves lower secondary supply. However, secondary firms also have an incentive to increase current supply to influence future competition. Thus, the equilibrium difference between these two models is not clear.
I also discuss which firms have greater incentives to respond to the dynamic incentives when costs are heterogeneous. I illustrate these results following Perry and Porter (1985) by assuming each firm icontrols a different amount ki of the industry capacity. In this specification, I model the cost of a firm i as Ci(qi, ki) = cqi +q2i/2ki. Under this assumption on costs, I can show that a primary firm that holds a greater capacity is more responsive to the dynamic incentives. Intuitively, a firm with greater capacity benefits by a greater amount from softer competition, so this firms dynamic incentive is greater. This cost specification also lets me examine local mergers, such as a reallocation of capital between the firms. There are two main results of interest for local mergers. First, reallocations of share between primary firms from a symmetric setting, results in a reduction in the supply of all firms except the primary firm that increased its share, an overall reduction in equilibrium supply and an increase in equilibrium price. Second, a reallocation of capacity from a secondary to a primary firm increases the supply of all firms accept the one losing capacity, an increase in total supply and a reduction in price. The percentage increase in supply of the larger secondary firm after the reallocation can be greater than the gain of primary firms because of the advantage the secondary firm has in the input market.
In the model, I assume that the only strategic action that a firm can take is to reduce supply. However, an alternative action that these firms can take is to purchase and then either shut down or idle capacity from the secondary firms. To evaluate this possibility, I adopt the specification in the above paragraph and consider the problem faced by a primary firm in this specification. A primary firm will purchase >0units of secondary capacity if and only if
Vi( ¯Qt−1,k)−A()≥Vi( ¯Qt−1,k0).
compare this expressions do not exist, a similar dynamic externality exists, which suggests that this strategy is likely not to hold. Notice, that with multiple primary firms, only the acquiring firm bears the purchase price while the other firms receive the benefit of softer competition.
Finally, I assume that demand is constant over time in the model. Alternatively I can allow the demand intercept to change over time and consider how this affects firms’ dynamic strategy. If firms know that demand will grow (shrink) in the next period, then the firms’ response to the dynamic incentive is stronger (weaker). For the case of growing demand, the primary firms have stronger incentives because the future is relatively more valuable; thus, the opportunity of forgoing profit today is lower leading to a stronger response. A more general model would require speci-fying the firms’ beliefs about the evolution of the demand state; however, it seems intuitive that in low demand states firms’ incentives will be stronger because the future will be more valuable on average.
1.4 An Empirical Model of Primary Firm Response to Dynamic Incentives
1.4.1 Empirical Specification of Firm Behavior
To study the incentives identified in the theoretical model, I take a primary firm,i, producing a final good,j, in state,s, and year,t, as the unit of observation in the empirical specification. I use firm level capacity as the dependent variable. This specification assumes that capacity proxies for the firm’s quantity supplied. The assumption is reasonable in the paper industry because over the sample period aggregate capacity utilization was approximately 90% for each paper product.30
The solution to the model yields an expression for equilibrium supply for firmias:
qit=q(Xit, Subsidyt,Q¯t−1, ∂Vi
∂qit
, ∂V−i ∂q−it
). (1.4)
Equation 1.4 specifies equilibrium quantity as a function of demand and cost parameters,Xit, the subsidy for secondary firms, the stock of the recycled input, and how firms’ current supply affect
30I explore this assumption by regressing price on both aggregate capacity and the capacity utilization rate for each
future payoffs,∂Vi/∂qit.
A complementary method to study the primary firms’ incentive involves studying best response functions. The theoretical model implies that I can specify the best response for a firmias
qitBR =qBR(Xit, Q−it,
∂Vi
∂qit
). (1.5)
This specification lets the increase in competition from secondary firms affect primary quantity supplied through movement along the best response function. Using the best response function assumes the quantity of all other firms,Q−it, enters the problem directly, and that the subsidy and stock variable only affect primary supply by changing total secondary quantity supplied.
I base the empirical test for primary firm responses to the incentives created by recycling on regressions of the following form:
logqijst=αlog ¯Qjst−1+βSubsidyst+γCompj +ζRecyclingst+
ξCCompjRecyclingst+Xijstη+ijst
(1.6)
This regression specification provides an approximation of the theoretical model considered in equation 1.4, and preserves the predicted comparative statics from the theoretical model for the variables of interest. I also include an indicator for exposure to competition from the secondary firm that varies at the product level. Including this variable lets the quantity supplied decision differ based on whether the firm can directly influence the future competition it faces from the secondary sector. I proxy for forward-looking behavior using the current recycling rate. I group the remaining sources of variation into the error termijst.
Subsidy laws represent the first key source of variation in firms’ incentives. These laws in-duce a direct increase in secondary firms’ quantity, and primary firms should strategically react by reducing current quantity supplied. The second source of variation in incentives is the stock of recycled inputs. As the stock increases, secondary firms’ marginal costs decrease, and primary firms react by reducing quantity supplied. The regressions based on equilibrium quantity supplied, equation 1.6, has the subsidy and stock enter the primary firm’s problem directly. In contrast, the regressions based on best response specifications, equation 1.5, has the subsidy and stock only affect primary behavior through their effect on the secondary firms supply. The paper recycling rate provides the final source of variation. An increase in the recycling rate raises the future stock of the recycled input for any total quantity supplied in the current period. Therefore, an increase in the current recycling rate requires that a strategic, forward-looking firm reduces its current quantity supplied by a greater amount to achieve the same amount of competition softening.
The empirical test of the hypothesis that primary firms decrease quantity supplied in response to current competition is that the coefficient on the subsidy indicator, and the coefficient on the current stock of recycled input are negative in equation 1.6. The empirical test of the response to changes in future competition is that the indicator on the interaction between the recycling rate and the indicator for secondary competition is negative. If this coefficient is negative but the coefficient on the recycling rate alone is not, this is evidence that firms are forward-looking. Intuitively, firms exposed to secondary competition have a direct ability to soften competition, so should react to these forward-looking incentives. However, firms that cannot affect future competition should not strategically respond to the changes in recycling rate.
behavior. Finally, I include firm fixed effects to control for unobserved characteristics of firms that result in different quantity supplied.
1.4.2 Identification
Identification of the model’s prediction comes from firm response to exogenous variation that affects strategic supply incentives over time. I require that the unobservable sources of variation are conditionally independent after controlling for the variables in the regression. I discuss the assumptions for identification below.
Theoretical models of the consumer recycling decision such as Fullerton and Kinnaman (1995) show that the recycling rate responds to the opportunity cost of recycling a good. Because this opportunity cost is set to address general concerns with landfill space, the recycling rate is inde-pendent of the time varying unobservables in the firm’s quantity supplied problem.31 I construct the stock variable for each product such that this variable varies across products and over time. This construction also lets me create a variable that includes only the contributions to the stock that come from the supply of other products. I use industry sources to construct an indicator for whether a specific product was exposed to competition from the secondary industry.32 The
def-inition of the indicator is based on both whether the technological ability to manufacture from recycled inputs was in widespread use at the start of the sample period.
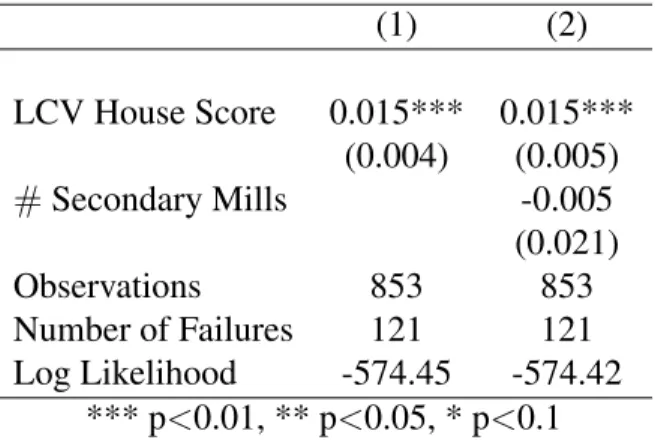
The main threat to identification of the effect of the subsidy laws is that political economy con-cerns led states to enact subsidies based on variables unobserved by the econometrician that also affect firms’ decisions. Because subsidies harm primary firms and benefit secondary firms, firms have incentives to lobby legislatures about the laws, so the outcome of the political process could be correlated with strategic supply decisions. I use a duration model to estimate the probability that a state that has not enacted a subsidy yet passes a law. I use the number of secondary mills in the state, and voters’ preference for environmental policies as variables that affect the decision.
31I run regressions of the recycling rate on the opportunity cost and endogenous measures such as total demand for
these inputs in table 2.5 in the Appendix. I find that the opportunity cost is a significant and positive predictor of the recycling rate but the endogenous measures have no significant effect across specifications.
Table 1.3: Enactment of Subsidy Laws and Environmental Concerns
(1) (2)
LCV House Score 0.015*** 0.015***
(0.004) (0.005)
#Secondary Mills -0.005
(0.021)
Observations 853 853
Number of Failures 121 121
Log Likelihood -574.45 -574.42
*** p<0.01, ** p<0.05, * p<0.1
Note:Results for regressions of survival analysis where failure is the passage of the subsidy law.
I report the results in Table 1.3. In column (1) I only include the League of Conservation Voters (LCV) score as a proxy for environmental friendliness. In column (2), I add the endogenous num-ber of mills. As seen in both columns, states whose voters are more environmentally friendly are more likely to enact a subsidy law at the state level. These voter preferences for more environmen-tal regulation appear an important factor leading to the laws passage, and crucially these scores are not determined by voters’ preferences for regulation of the paper industry specifically. In contrast, the number of secondary paper mills in the state does not appear to explain the passage of the laws. Intuitively if lobbying by paper firms explains whether a subsidy is enacted, then there should be a significant relationship between these variables. Given the results of these specifications, I take the passage of these laws as exogenous in the empirical specification.