R E S E A R C H PA P E R
Environmental optimality, not
heterogeneity, drives regional and local
species richness in lichen epiphytes
Jessica R. Coyle1* and Allen H. Hurlbert1,2
1Department of Biology, University of North Carolina, Chapel Hill, NC, USA,2Curriculum for the Environment and Ecology, University of North Carolina, Chapel Hill, NC, USA
A B S T R A C T
Aim We evaluate the scale dependence of species richness–environment relation-ships with a continent-wide analysis of lichen epiphyte communities. Specifically, our goals are to assess: (1) the dependence of local richness on regional processes, (2) whether species richness is primarily influenced by heterogeneity in environ-mental conditions or the central tendency of those conditions, and (3) whether the relative influence of these different aspects of the environment differs between local communities and regional species pools.
Location Forests of the contiguous United States.
Methods We used variation partitioning and model averaging of linear models to relate macrolichen richness at 1923 forest inventory plots (c. 4000 m2) to measures
of environmental heterogeneity and mean conditions at local and regional scales. Data included 17 local environmental variables and 11 regional-scale variables which were obtained from a national forest inventory, herbarium records and several climate data sources.
Results Regional-scale variables explained more unique variation in local species richness and generally had stronger effects than variables measured locally. However, most variation in local richness was explained jointly by local and regional variables. At both local and regional scales, variables measuring environ-mental heterogeneity explained little variation in species richness and had weaker effects than variables characterizing mean environmental conditions.
Main conclusions Species richness of epiphytic macrolichens is not regulated by environmental heterogeneity locally or regionally and instead tracks large-scale climate gradients of water availability and temperature. Richness in local commu-nities is influenced by processes operating at both regional and local scales, high-lighting the importance of determining large-scale drivers of lichen richness across the North American continent. This research demonstrates a general method for comparing the influence of different aspects of the environment on species richness across scales and should be applicable to many different taxonomic groups. Keywords
Biodiversity, environmental heterogeneity, forest, multimodel inference, spatial scale, species richness.
*Correspondence: Jessica R. Coyle, University of North Carolina, CB #3280, Chapel Hill, NC 27599, USA.
E-mail: [email protected]
I N T R O D U C T I O N
Which environments support more species? Answering this question is a prerequisite for explaining the global distribution of biodiversity and providing practical guidance for its conser-vation. Recently and historically, environmental heterogeneity
has been proposed as a primary driver of biodiversity across a wide range of spatial scales (McIntosh, 1985; Steinet al., 2014). At small scales, where interacting individuals form a multispecies community, environmental heterogeneity provides a greater variety of niches for species with different ecological requirements (MacArthur, 1964) and facilitates fitness
trade-offs that limit competitive exclusion when species require similar resources (Amarasekare, 2003). At regional to global scales, heterogeneity can increase species richness by aggregating species pools from different habitat types (Hortalet al., 2009) as well as by altering rates of speciation (Hughes & Eastwood, 2006) and persistence through climate fluctuations (Fjeldså et al., 2012).
Many other contemporary environmental factors have been proposed as primary drivers of species richness at various scales, including water and energy, productivity, nutrients, edaphic conditions and disturbance (reviewed in Whittakeret al., 2001). Specific mechanisms by which each factor influences richness vary, but as a generalization species cannot persist in environ-ments that do not meet their fundamental niche requireenviron-ments, and therefore richness has the potential to be highest where conditions meet the needs of more species. Furthermore, con-ditions closer to species fitness optima sustain larger popula-tions with lower probabilities of extinction or local extirpation. Correlations between species richness and environmental factors can arise when species physiology and ecology are con-strained by a shared evolutionary and geographical history, such that environmental conditions that match shared niche require-ments support more species (Currie et al., 2004; Wiens & Graham, 2005).
The extent to which the number of species in an area relates to the ‘optimality’ of the environment for multiple species versus the variety of environmental conditions available (i.e. ‘heteroge-neity’) is likely to vary across systems and scales. Meta-analysis of the environmental correlates of species richness has shown greater explanatory ability of covariates related to climate and productivity than covariates measuring environmental hetero-geneity, particularly at the largest spatial grains and extents (Field et al., 2009). This seems contrary to the widespread support for positive richness–heterogeneity relationships (Lundholm, 2009), which also tend to be strongest at larger spatial grains (Steinet al., 2014). These disparities suggest that a single study investigating the relative influence of environmental heterogeneity and optimality on species richness should strive to utilize data and methods that integrate across scales (e.g. González-Megíaset al., 2007). The mechanisms by which envi-ronmental heterogeneity and optimality affect species richness differ with scale and should be accounted for in analyses. Furthermore, processes regulating richness at small and large scales are linked by the interdependence of environmental con-ditions across scales (Passy, 2009) and the dispersal of species amongst the local sites that comprise a larger region (Leibold et al., 2004). The meta-community conceptualization of local– regional dynamics (Leiboldet al., 2004) is a potentially valuable framework for studying the influence of environmental hetero-geneity and optimality on species richness across spatial scales and could improve our understanding of how patterns of geo-graphical diversity are generated.
Our goal is to investigate how environmental heterogeneity and optimality regulate species richness across spatial scales using analyses that explicitly consider these effects within a local–regional hierarchy. We use data from a national survey of
epiphytic lichen communities in forests because lichen epi-phytes are a biologically diverse group whose ecology offers an ideal opportunity to evaluate hypotheses about the influence of the environment on communities across spatial scales (Ellis, 2012). As sensitive environmental indicators that are ubiquitous globally in forested ecosystems (Nash, 2008), lichens are well suited to detecting how different aspects of environmental vari-ation can influence communities across a wide range of condi-tions. In addition, forests vary greatly in structural composition and climatic setting, which allows environmental heterogeneity and optimality to be measured at multiple spatial scales.
We first establish the geographical distribution of local and regional species richness for non-crustose epiphytic lichens (e.g. ‘macrolichens’) across the United States using US Forest Service surveys of forest inventory plots and by aggregating Consortium of North American Lichen Herbaria species records, respec-tively. We then relate species richness to environmental covariates that characterize environmental heterogeneity and average environmental conditions at local and regional scales in order to determine: (1) the dependence of local richness on regional processes, (2) whether species richness is primarily influenced by environmental heterogeneity or optimality, and (3) whether the relative influence of these different aspects of the environment differs between local and regional scales. Our approach is to use generalized linear models to isolate the effects of categories of predictors of macrolichen species richness. Parameter estimates and variation explained by these models are used to infer the importance of regional and local processes in determining local richness and whether richness is primarily related to environmental heterogeneity or optimality.
M E T H O D S
Data
We estimated local species richness for each plot from surveys in which macrolichen species are recorded from all woody substrates in an area of approximately 4000 m2(within
a circular plot of radius 36.576 m) within a 2-h time period (the detailed survey methodology can be found in Woodall et al., 2009; Will-Wolf, 2010). To account for changes in tax-onomy, species names were standardized as recommended in the FIA documentation for analyses spanning all regions. We then calculated local macrolichen species richness in each plot as the total number of taxa occurring in a single survey, since only a few plots were surveyed multiple times. Regional macrolichen species richness was estimated from 148,161 her-barium records in the Consortium of North American Lichen Herbaria database (CNALH, 2014). We estimated regional species richness for each plot as the number of taxa that occurred within a 500-km radius of the plot, only considering taxa that are surveyed by the FIA program. To control for geo-graphical bias in overall sampling effort, regional richness esti-mates were based on a fixed sample of 2000 records. Distances shorter than 500 km did contain enough herbarium records to ensure an adequate sample of regional diversity, but yielded similar geographical patterns of regional richness (see ‘Calcu-lation of regional species richness’ in Appendix S1 in Support-ing Information).
We derived forest structure and climate variables measuring environmental optimality and heterogeneity at both local and regional scales (Table 1). Variables measuring environmental optimality assess the central tendency (e.g. the mean) of an environmental factor within a plot or region surrounding a plot, while variables measuring heterogeneity assess the dispersion of these factors (e.g. the variance) within a plot or region. All local forest structure variables were based on tree surveys conducted by the FIA programme at the same plot locations where lichens were surveyed. We estimated regional tree species richness within a 500-km radius of each plot from tree species occur-rences across all FIA plots. Local-scale climate variables were obtained for each plot by intersecting the geographical coordi-nates of plots with several long-term average climate maps obtained from WorldClim and PRISM data (PRISM Climate Group; Hijmans et al., 2005). Regional-scale climate variables were derived from the same data, with regional means and vari-ances calculated within a 500-km radius of each plot. One local climate variable, total annual direct solar insolation, was calcu-lated from field-measured topographic slope, aspect and lati-tude using functions in theinsolpackage in R (Corripio, 2014). In two cases, pairs of environmental variables were strongly collinear: annual precipitation and relative humidity, and maximum tree diameter and tree size diversity. Therefore, we extracted two orthogonal variables from each of these pairs using principal components analysis (PCA) and used the orthogonal variables in all models (the names of orthogonal variable are high precipitation–high RH (relative humidity)/ high precipitation–low RH and large trees/tree size variation). Detailed descriptions of the derivations of all environmental covariates are described in the ‘Additional methodological infor-mation’ section of Appendix S1.
The entire data set was randomly divided in half into training and testing data sets that encompassed the same geographical range. To avoid over-fitting the models, the training data set was used during initial data exploration and model specification, during which we decided which variables to include, whether to transform variables and whether quadratic relationships should be included. Final results were interpreted from models fitted to the testing data set of 962 plots.
Models
To explore relationships between environmental covariates and local and regional macrolichen species richness (SL and SR,
respectively), we fitted six models with different combinations of sets of predictors: local heterogeneity variables (LH), local optimality variables (LO), regional heterogeneity variables (RH) and regional optimality variables (RO) (see Table 2 for model abbreviations). Variables with strongly skewed distributions were transformed to reduce the impact of extreme observations. Regional climate variance variables were all log-transformed, while bark moisture diversity and wood density diversity were square-root transformed. To model local species richness, we used maximum likelihood to fit a generalized linear model with a negative binomial error distribution and log-link function, Table 1 Environmental variables included in analyses. Variables are sorted according to their scale (local or regional) and whether they measure central tendency (optimality) or dispersion (heterogeneity). Detailed descriptions of variables and their derivation can be found in Appendix S1.
Regional optimality Regional heterogeneity
High precipitation–high RH (mean)
High precipitation–low RH (mean)
Precipitation seasonality (mean) Isothermality (mean)
Mean annual temperature (mean)
High precipitation–high RH (variance)
High precipitation–low RH (variance)
Precipitation seasonality (variance) Isothermality (variance)
Mean annual temperature (variance)
Regional tree species richness
Local optimality Local heterogeneity
Mean bark moisture Mean wood density Large trees Tree species diversity Mean canopy density Solar radiation
High precipitation–high RH High precipitation–low RH Precipitation seasonality Isothermality
Mean annual temperature
Bark moisture diversity Wood density diversity Tree size variation Tree species composition Canopy variability % Trees dead
which was better supported than a Poisson or normal error distribution (functionglm.nbin the R package MASS; Ripley et al., 2015). For regional species richness, we used maximum likelihood to fit a spatial simultaneous autoregressive error model (function errorsarlm in the R package spdep (Bivand et al., 2015) with normal errors and neighbour weights propor-tional to the areal overlap of the 500-km radius circles around neighbouring plots used to calculate regional-scale variables. This attempts to account for the spatial autocorrelation induced by our method of calculating regional-scale variables. The algo-rithm we used to fit these models was unable to accommodate predictors with variances that differed by several orders of mag-nitude. Therefore, since we were primarily interested in the rela-tive effect of different variables, we standardized variables to z-scores before including them in the models. Because species richness might be expected to exhibit unimodal relationships with some variables measuring environmental optimality, we included a quadratic term for any variable where unimodal rela-tionships were supported in single-variable models. This was determined for each variable by comparing the Akaike informa-tion criterion (AIC) of a univariate model with a linear term or with an additional quadratic term, and accepting the relation-ship as ‘unimodal’ when the quadratic term was negative (concave-down) and theΔAIC greater than 2.
Variation partitioning
We used additive variation partitioning (Legendre & Legendre, 2012) to test the relative variation in local species richness explained by local versus regional environmental variables and the variation in species richness explained by environmental heterogeneity versus optimality at both local and regional scales. This procedure involves comparing the variation in the response explained by nested models to determine the proportion of the
variation which can be uniquely attributed to the different sets of predictors in those models and that which is shared among them. We made five comparisons using the models described in Table 2.
1. Variation in local richness explained by all regional-scale variables versus all local-scale variables (Model L3, partitioning variance between L1+L2).
2. Variation in local richness explained by regional-scale versus local-scale optimality variables (Model L6, partitioning variance between L4+L5).
3. Variation in local richness explained by regional-scale versus local-scale heterogeneity variables (Model L9, partitioning vari-ance between L7+L8).
4. Variation in local richness explained by local heterogeneity versus optimality variables (Model L2, partitioning variance between L5+L8).
5. Variation in regional richness explained by regional hetero-geneity versus regional optimality variables (Model R3, parti-tioning variance between R1+R2).
The first three comparisons assess the relative influence of local versus regional processes on local macrolichen species richness, while comparisons 4 and 5 assess the relative influence of environmental heterogeneity versus optimality. Because models were generalized linear models (GLMs) and spatial autoregressive models, we used the likelihood ratio-adjusted pseudo-R2 (R
adj2) as the goodness-of fit measure of variation
explained (Nagelkerke, 1991). Fractions of variation uniquely explained by sets of variables were determined by adding and subtractingRadj2values of the appropriate models.
Multimodel inference and parameter estimation
We used model averaging to estimate the effects and importance of individual environmental variables included in the linear models (Burnham & Anderson, 2002). To compare the effects of Table 2 Linear models of macrolichen species richness used for variation partitioning. Responses are local (SL) or regional (SR) species richness and model statistics are for a full model fit to all variables in each of the included categories: regional optimality (RO), regional heterogeneity (RH), local optimality (LO), local heterogeneity (LH). Model forms are either a generalized linear model with negative binomial error (GLM) or a spatial autoregressive error model with normal errors (SAR). Reported model statistics are the likelihood ratio pseudo-R2, the number of estimated parameters (K), residual deviance and Akaike information criterion (AIC). Models with the lowest AIC for each response variable are indicated in bold.
Model Response Predictors Form R2 K Deviance AIC
L1 SL RH+RO+SR GLM 0.55 18 966.44 5446.7
L2 SL LH+LO GLM 0.44 27 953.97 5671.3
L3 SL RH+RO+LH+LO+SR GLM 0.63 43 949.34 5317.2
L4 SL RO GLM 0.42 9 966.36 5667.9
L5 SL LO GLM 0.42 18 957.42 5694.6
L6 SL RO+LO GLM 0.54 25 952.81 5493.9
L7 SL RH GLM 0.31 10 979.23 5838.4
L8 SL LH GLM 0.18 11 984.30 6014.3
L9 SL RH+LH GLM 0.41 19 973.28 5715.1
R1 SR RH SAR 0.35 10 164.62 1078.9
R2 SR RO SAR 0.54 9 132.96 869.7
individual local versus regional predictor variables on local species richness we computed parameter estimates and AICc
(the AIC corrected for small sample size) for all possible submodels of two full models: one containing only heterogene-ity variables (Model L9) and one containing only optimalheterogene-ity variables (Model L6), with the restriction that each submodel retained at least two predictor variables and quadratic terms could not appear without their corresponding linear term. From these sets of candidate models, we then selected the top models whose Akaike weights were no less than 5% of the best model (i.e. an evidence ratio of 0.05). Parameter estimates and variable importance were then calculated from these sets of more prob-able models. Variprob-able importance was assessed as the sum of the Akaike weights of all models in which a variable appears and its estimated effect was calculated as the average of its effects in all models weighted by model Akaike weights. We report standard-ized parameter estimates so that the relative effects of variables can be compared, but do not report the significance of individ-ual predictors because such inferential tests are not valid after
this post-hoc analysis of such a large set of models (Burnham & Anderson, 2002). We used the same procedure to compare the effects of individual heterogeneity versus optimality predictor variables on local species richness (Model L2) and regional species richness (Model R3).
R E S U LT S
Geographical distribution of lichen richness
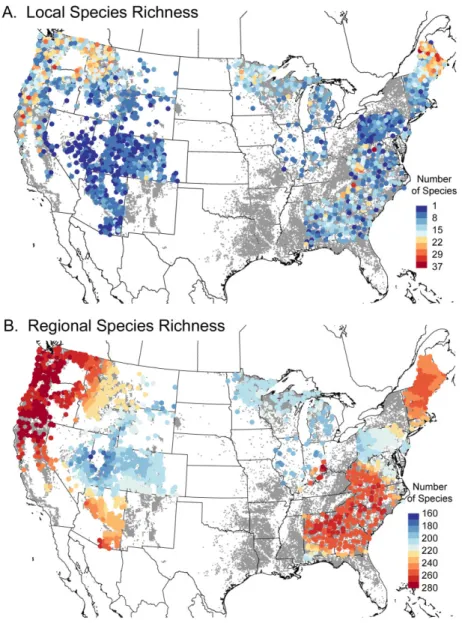
Local macrolichen species richness ranged from 1 to 37 species, with high richness occurring in Maine, Washington, Oregon, California and Idaho and low richness in the Great Basin and other arid regions (Fig. 1a). Regional species richness was highest in the Pacific Northwest region and south-eastern Appa-lachians, but low throughout the Great Basin and Midwest (Fig. 1b). The high regional richness in the south-western deserts and south-eastern forests contrasted with the generally lower local-scale richness in these regions.
Variation partitioning
In univariate models, local species richness exhibited unimodal relationships with five variables measuring environmental optimality and three variables measuring heterogeneity (Appen-dix S1, Table S2), while regional species richness exhibited unimodal relationships with one optimality variable and one heterogeneity variable (Appendix S1, Table S3). Quadratic terms for these variables were included in subsequent models used for variation partitioning and model averaging.
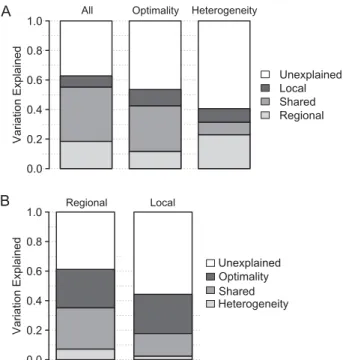
We compared three sets of models to determine the relative influence of local- versus regional-scale variables on local macrolichen species richness. In each comparison, the model with regional-scale variables uniquely explained more variation than the model with local-scale variables, despite having fewer estimated parameters (Fig. 2a). When all variables were included (Model L3), the regional variable model uniquely explained 18% of the variation in local richness, while the local variable model explained 8%. Among heterogeneity variables (Model L9) this disparity increased, with the regional model uniquely explaining 23% of the variation and the local model explaining 9%. However, among models containing only vari-ables measuring environmental optimality (Model L6), the pro-portion of variation in local richness uniquely attributed to local versus regional variable models was approximately equal (11% and 12%, respectively). In addition, for all three comparisons the regional model had a much lower AIC than the model con-taining only local-scale environmental variables.
To determine the relative influence of environmental hetero-geneity versus optimality on macrolichen species richness we compared two sets of models – one set predicting local richness (Model L2) and one set predicting regional richness (Model R3). At both scales, models containing variables measuring environ-mental heterogeneity explained very little unique variation in species richness (Fig. 2b). At a regional scale, variables measur-ing environmental optimality uniquely explained at least four times more variation in regional species richness than heteroge-neity variables (26% vs. 7%). In models of local species richness, the model with variables measuring environmental optimality uniquely explained 27% of the variation in species richness compared with 2% for the heterogeneity model. Lower AIC values for optimality models at both scales also indicate that these variables are better predictors of species richness than heterogeneity variables.
Multimodel inference and parameter estimation
In order to compare the effects of individual local- versus regional-scale variables on local macrolichen species richness, we averaged parameter estimates from the best submodels of two full models – one containing optimality variables (Model L6) and one containing heterogeneity variables (Model L9). Of the 1,119,727 optimality submodels, 129 were identified as being most likely (evidence ratio≥0.05, compared with the best model) and were used for parameter estimation (Appendix S1, Table S4). Following the same criterion, 52 out of 31,091
het-erogeneity submodels were identified as the most likely and were used for parameter estimation (Appendix S1, Table S5). We report standardized parameter estimates so that the effects of variables can be compared.
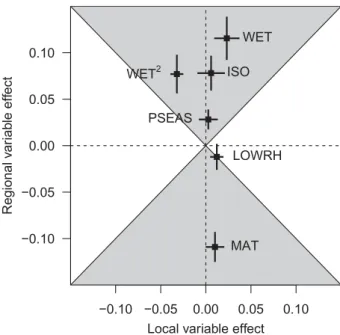
In the optimality variable model (Model L6), the variables with the strongest effects on local richness were all regional-scale climate variables: high precipitation–high RH (0.12), mean annual temperature (−0.11) and isothermality (0.08). Apart from high precipitation–low RH, the effects of local-scale climate variables were always weaker than the effects of their regional counterparts (Fig. 3). Six out of eleven local-scale optimality variables had no effect on local richness. For the heterogeneity variable model (Model L9), every regional-scale variable was included in all 52 top models, whereas only two local-scale heterogeneity variables, bark moisture diversity and
A
B
Regional LocalAll Optimality Heterogeneity
tree species diversity, exhibited the same level of importance. Regional tree species richness and spatial variance in precipita-tion seasonality had the strongest effects (0.12 and 0.11, respec-tively), but the inclusion of a negative quadratic term for both variables suggests that local richness does not respond linearly. To compare the effects of individual variables measuring environmental heterogeneity versus optimality, we averaged parameter estimates from the best submodels of a regional-scale model of regional richness (Model R3) and from the best submodels of a local-scale model of local richness (Model L2). Fourteen out of 4608 regional submodels were identified as most likely and used for parameter estimation, while 1545 out of 3,359,214 local-scale submodels were used.
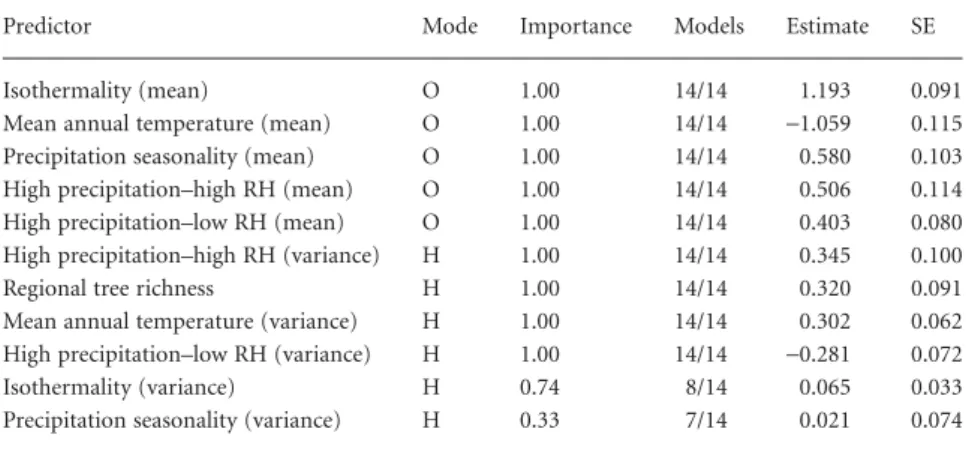
At the local scale, six variables measuring environmental optimality occurred in all 1545 most likely models, while no variable measuring environmental heterogeneity did so (Table 3). Of the most important optimality variables, mean canopy density had the strongest effect (0.05), followed by high precipitation–high RH (0.04), and solar radiation (0.03). All three of these variables had negative quadratic effects, indicating a concave-down relationship with local richness. At the regional scale, all variables measuring environmental optimality had stronger effects on regional species richness than all variables measuring heterogeneity and were included in all 14 top models (Table 4). Regional mean isothermality had the strongest effect (1.19) followed by regional mean annual temperature (−1.06) and precipitation seasonality (0.58).
D I S C U S S I O N
Regional control of local communities
Two lines of evidence suggest an important role for regional processes in determining local richness of macrolichen
−0.10 −0.05 0.00 0.05 0.10
−0.10 −0.05 0.00 0.05 0.10
Local variable effect
Regional v
ar
iab
le eff
ect
MAT ISO
PSEAS
WET
LOWRH WET2
Figure 3 Effects of local and regional climate variables on local macrolichen species richness. Coefficients from the
best-supported models of local macrolichen species richness containing optimality variables (full model L6) were averaged and standardized to obtain standardized effects of climate variables measured locally and regionally. These effects are plotted here with the coefficient for each local climate variable on thex-axis and the coefficient for each regional mean climate variable on the y-axis. Points falling in the grey region indicate climate variables that have a stronger effect on local richness when measured regionally compared with when measured locally. Abbreviations are: high precipitation–high RH (WET) and its square (WET2), high precipitation–low RH (LOWRH), precipitation seasonality (PSEAS), isothermality (ISO) and mean annual temperature (MAT).
Table 3 Importance and effects of local-scale environmental variables on local macrolichen species richness. Parameter estimates are averaged from the 1545 most likely submodels (evidence ratio≥0.05) of a full model containing all local-scale variables (model L2). Estimates are standardized to enable comparison among variables. Variables are ordered from the strongest to the weakest estimated effect on local richness. For each variable the table lists whether the variable measures
environmental heterogeneity (mode H) or optimality (mode O), the relative importance of the variable (summed weights of submodels containing it) and the number of most likely submodels in which the variable occurs (out of 1545). Effects of variable quadratic terms can be found in Appendix S1, Table S6.
Predictor Mode Importance Models Estimate SE
Mean canopy density O 0.998 1539/1545 0.0528 0.0176
High precipitation–high RH O 1.000 1545/1545 0.0380 0.0040
Solar radiation O 1.000 1545/1545 0.0259 0.0149
Precipitation seasonality O 1.000 1545/1545 0.0229 0.0028 Wood density diversity H 0.782 1181/1545 0.0211 0.0119 Bark moisture diversity H 0.838 1266/1545 0.0188 0.0110
Mean wood density O 1.000 1545/1545 −0.0172 0.0114
Mean annual temperature O 1.000 1544/1545 −0.0111 0.0036
Tree diversity H 0.581 949/1545 0.0081 0.0051
Tree composition O 1.000 1545/1545 −0.0075 0.0027
Isothermality O 0.597 882/1545 0.0064 0.0038
High precipitation–low RH O 0.550 872/1545 0.0053 0.0035
Canopy variability H 0.464 725/1545 0.0036 0.0026
Mean bark moisture O 0.341 602/1545 −0.0033 0.0031
Large trees O 0.269 487/1545 −0.0022 0.0025
Tree size variation H 0.266 497/1545 0.0020 0.0024
% of trees dead H 0.310 610/1545 0.0012 0.0039
communities in US forests: the greater explanatory ability of regional-scale variables in the variation partitioning analysis and the generally stronger effects on local richness of individual variables measured at a regional rather than a local scale. The only other study to explicitly assess environmental drivers of local and regional richness in lichens found little predictive power of any covariate and did not discuss potential linkages across scales (Casanovaset al., 2013). Other studies assessing the correlation between local stand-scale lichen richness and land-scape or regional-scale predictors generally find little effect of large-scale predictors compared with local environmental pre-dictors (Nascimbene et al., 2012; Kiraly et al., 2013) or of macroclimate compared with local forest structure (Moning et al., 2009; Ellis & Coppins, 2010). The apparent contradiction between our finding that regional-scale processes are important for local richness and these previous results stems from a differ-ence in scale. In several previous studies, the purpose of exam-ining landscape-scale predictors was to assess whether dispersal of lichen species from older forest patches augments the number of species in adjacent areas. The lack of evidence for landscape-scale enrichment of local richness indicates that lichen species have the ability to disperse across landscapes, at least over mod-erate time-scales. Gjerdeet al. (2012) suggest that dispersal limi-tation of species richness in nascent forest patches disappears after 100 years. Our finding that regional processes have an impact on local macrolichen richness is also consistent with lichens having a relatively high dispersal ability. However, our study covered a much larger geographical extent and our ‘regional-scale’ variables are measured over an area that in some cases would encompass the entire geographical extent of prior landscape-scale studies. Dispersal rates may be high enough to homogenize local communities and erase correlations between local richness and landscape attributes measured at a scale of 10–100 km, yet metacommunity models predict that moderate dispersal should enhance correlations with regional variables measured at larger scales by strengthening the relationship between local and regional richness (Mouquet & Loreau, 2003). Given the influence of regional-scale processes on local lichen richness, an important avenue for further research is to deter-mine the underlying cause of regional gradients of lichen rich-ness in North America. High dispersal ability would suggest that
lichen distributions track current climate, and it is tempting to interpret regional-scale richness–environment correlations as evidence for large-scale environmental filtering of a group of organisms with similar physiological limitations. However, it is also possible that certain environments have a higher capacity to support or evolve more species and that species niches evolved accordingly. Quantifying the evolutionary flexibility of lichen niches would help to clarify the direction of causality. Globally, only a handful of studies (Mariniet al., 2011; Casanovaset al., 2013; Soto-Medina, 2013) have assessed potential drivers of regional-scale lichen richness. The continual development of large-scale data sets on species distribution, such as CNALH, will be crucial for understanding the generation of continental-to global-scale diversity.
Dominance of environmental optimality over heterogeneity across scales
As in previous studies, environmental variables were better pre-dictors of species richness at the regional scale than at the local scale (Belmaker & Jetz, 2011), but the contribution of environ-mental optimality relative to environenviron-mental heterogeneity remained similar across scales. Both variation partitioning and the individual parameter estimates support a stronger role for environmental optimality over heterogeneity in determining macrolichen species richness. At both local and regional scales, the optimality model independently explained substantially more variation in richness than the heterogeneity model and the estimated effects of optimality variables were mostly stronger than the estimated effects of heterogeneity variables. Further-more, heterogeneity variables did not appear to be increasing richness by increasing available niches. Several heterogeneity variables had negative or unimodal relationships with richness. Taken together, this evidence suggests that niche-based sorting among habitats is not a general driver of local or regional macrolichen richness across the wide variety of forests in North America.
Heterogeneity variables primarily explained variation in rich-ness that could also be attributed to variables measuring envi-ronmental optimality, particularly in the regional-scale models comprising mostly climate variables. This means that changes in
Table 4 Importance and effects of regional-scale environmental variables on regional macrolichen species richness. Parameter estimates are averaged from the 14 most likely submodels (evidence ratio≥0.05) of a full model containing all regional-scale variables (Model R3). The table follows the same format as Table 3. Variables are ordered from strongest to weakest effect on local richness. Effects of variable quadratic terms can be found in Appendix S1, Table S6.
Predictor Mode Importance Models Estimate SE
Isothermality (mean) O 1.00 14/14 1.193 0.091
Mean annual temperature (mean) O 1.00 14/14 −1.059 0.115 Precipitation seasonality (mean) O 1.00 14/14 0.580 0.103 High precipitation–high RH (mean) O 1.00 14/14 0.506 0.114 High precipitation–low RH (mean) O 1.00 14/14 0.403 0.080 High precipitation–high RH (variance) H 1.00 14/14 0.345 0.100
Regional tree richness H 1.00 14/14 0.320 0.091
Mean annual temperature (variance) H 1.00 14/14 0.302 0.062 High precipitation–low RH (variance) H 1.00 14/14 −0.281 0.072
Isothermality (variance) H 0.74 8/14 0.065 0.033
species richness are mainly associated with changes in environ-mental heterogeneity that are also accompanied by changes in mean conditions. Thus, it is not simply the variety of conditions that matter, but the quality of those conditions.
The relatively weak independent influence of environmental heterogeneity across scales is surprising in light of numerous studies showing that turnover in lichen epiphyte community composition is strongly associated with environmental variation ranging from within a single tree to across a landscape (Ellis, 2012). Forest structural elements that introduce heterogeneity, such as light gaps, trees of different ages and standing dead trees, have frequently been identified as contributing to lichen species richness (Moninget al., 2009; McMullinet al., 2010; Ellis, 2012), especially as pertaining to recommendations for maintaining diversity in managed forests (Neitlich & McCune, 1997). Species sorting among trees with different bark properties can lead to a correlation between tree species richness and lichen richness (Meier et al., 2005), a pattern that extends to larger regional scales where forest types with greater tree species richness have been found to support a more species-rich lichen flora (Jüriado et al., 2003). However, the strength of this correspondence between tree and lichen richness may depend on the region in which the study is conducted. In northern temperate to boreal forests complementarity among lichen communities on hard-woods versus conifers leads to greater richness in mixed forest types (Cleavittet al., 2009). Yet, increasing tree species richness could have much less of an effect in more diverse forests found at lower latitudes if adding tree species to already moderately diverse forests does not create new niches for lichens. We found a weak positive relationship between regional tree richness and macrolichen richness, but no clear effect at the local scale. The overall weak effects of variables measuring local forest structure that we find in this study imply that there are no general rela-tionships between macrolichen richness and forest structure that are true for all US forests. Hence, we reiterate the oft-given advice that care should be taken when generalizing from studies conducted within smaller spatial extents and furthermore suggest that decisions regarding forest management for lichen diversity be based on regionally parameterized models (Will-Wolfet al., 2006).
If our data support the hypothesis that richness increases under conditions that are more optimal for more species, what then is the optimal macrolichen niche? Like plants, lichens rely on photosynthesis to obtain carbon for metabolic processes, hence light and water availability are expected to be primary determinants of the distribution and abundance of lichen species (Harris, 1971). The strong positive effects of precipita-tion and humidity on macrolichen richness that we observe are in line with previous reports that water availability creates a strong physiological constraint on poikilohydric lichens (Green et al., 2008) and is a primary driver of lichen richness at regional scales (Marini et al., 2011). This manifests geographically as centres of high regional macrolichen diversity occurring in the Pacific Northwest and Northeastern regions and the southern Appalachians. The inclusion of solar radiation and of mean canopy density as one of the few local variables measuring forest
structure with important effects on macrolichen richness is con-sistent with previous findings that light availability is a determi-nant of lichen richness (Moning et al., 2009; Rosabal et al., 2012). Unlike previous work, we found an effect of climatic variables related to temperature: both regional and local species richness were higher in areas with lower mean annual tempera-tures, and regional richness was higher in areas where diurnal temperature variation approaches intra-annual variation. These results are surprising, given that lichens are thought to have generally broad thermal optima that shift toward warmer tem-peratures at lower latitudes (Lechowicz, 1982; Nash, 2008). Richness–environment relationships may arise from underlying biogeographical variation unrelated to niche-based species sorting and, as with any correlative modelling approach, caution should be used when interpreting any single parameter estimate from our models. We base the support for our conclusions on the aggregate trend of multiple predictors and do not recom-mend characterizing the optimal lichen niche based solely on the effects of single predictors in our models. Furthermore, these conclusions about environmental drivers of macrolichen species richness should not be generalized to crustose lichens that grow embedded in their substrate because their morphology may cause different responses to environmental variation (Nascimbene & Marini, 2015).
Implications beyond lichen ecology
Our results are generally consistent with a series of meta-analyses that have found that the effect of environmental het-erogeneity on richness is stronger or more frequently positive at larger spatial scales (Tammeet al2010, Steinet al., 2014), but that when compared against other hypotheses, climate, produc-tivity and other measures of average environmental conditions better explain variation than environmental heterogeneity (Fieldet al., 2009; Lundholm, 2009). There has not been a com-prehensive meta-analysis comparing the relative contribution of regional and local factors to local richness, despite a recent increase in the number of studies that explicitly consider both local and regional environmental factors in the same analysis. While several studies find a greater explanatory role for local biotic and abiotic environmental filters over regional processes (Harrisonet al., 2006; White & Hurlbert, 2010; Wang et al., 2012), others find approximately equal roles of local and regional processes (Passy, 2009; Kristiansenet al., 2011). It is not clear whether our conclusions regarding macrolichens are anomalous or expected given their dispersal potential and bio-geographical history. A detailed review and analysis of this recent literature would clarify general expectations and the dependence of patterns on taxon- or system-specific biological features (e.g. traits or geographical contexts that influence dis-persal) or methodological decisions.
because they disperse and reproduce like micro-organisms, yet have long been collected and studied as macro-organisms. Thus, lichen diversity and distributions are well characterized com-pared with other fungi and microbes. This, combined with a long evolutionary history, global distribution and high sensitiv-ity to the environment, makes lichens a particularly rich, yet underutilized, research system. By shifting the focal unit of analysis from species identity to species number and functional strategy (e.g. McCune, 1993; Stofer et al., 2006; Rapai et al., 2012), lichen ecologists can both increase the scale of their analyses and facilitate comparison across taxa and systems.
Explicit consideration of the contribution of environmental heterogeneity and optimality to species richness within the context of local versus regional dynamics provokes general ques-tions about the interaction between scale and heterogeneity. For example, how does regional heterogeneity alter the link between richness at regional and local scales? In a heterogeneous region containing a diverse assemblage of species, dispersal amongst habitat patches may enrich local sites to a greater extent than in a more homogeneous region (e.g. mass effects) and lead to stronger regional control of local richness. However, if the geo-graphical features that create regional heterogeneity also hinder the movement of propagules or individuals, then reduced dis-persal could result in greater local-scale environmental control (Damschen & Brudvig, 2012). Assessing the conditions under which these scenarios occur would be a fruitful avenue for future research. Yet the importance of understanding and predicting these patterns is not purely theoretical. Conservation recom-mendations are likely to differ for species guilds that vary in how regional heterogeneity affects dispersal or the extent to which diversity is constrained by average environmental conditions versus environmental heterogeneity. Anthropogenic habitat modification can increase or decrease environmental heteroge-neity, depending on the scale and level of intensity (Seiferling et al., 2014). This, coupled with region-wide changes in climate, makes it imperative that we be able to predict how different groups respond to environmental variation at both local and regional scales.
A C K N O W L E D G E M E N T S
We thank Sarah Jovan for assistance with locating data associ-ated with the former Forest Health Monitoring Program, Ethan White, Morgan Ernest and Brian Evans for feedback on our approach, and three anonymous referees whose comments sub-stantially improved the analysis. J.R.C. acknowledges support form the Royster Society of Fellows and the US National Science Foundation.
R E F E R E N C E S
Amarasekare, P. (2003) Competitive coexistence in spatially structured environments: a synthesis.Ecology Letters,6, 1109– 1122.
Belmaker, J. & Jetz, W. (2011) Cross-scale variation in species richness–environment associations.Global Ecology and Bioge-ography,20, 464–474.
Casanovas, P., Lynch, H.J. & Fagan, W.F. (2013) Multi-scale pat-terns of moss and lichen richness on the Antarctic Peninsula. Ecography,36, 209–219.
Cleavitt, N.L., Dibble, A.C. & Werier, D.A. (2009) Influence of tree composition upon epiphytic macrolichens and bryophytes in old forests of Acadia National Park, Maine.The Bryologist,112, 467–487.
Currie, D.J., Mittelbach, G.G., Cornell, H.V., Field, R., Guégan, J.-F., Hawkins, B.A., Kaufman, D.M., Kerr, J.T., Oberdorff, T., O’Brien, E. & Turner, J.R.G. (2004) Predic-tions and tests of climate-based hypotheses of broad-scale variation in taxonomic richness. Ecology Letters, 7, 1121– 1134.
Damschen, E.I. & Brudvig, L.A. (2012) Landscape connectivity strengthens local–regional richness relationships in succes-sional plant communities.Ecology,93, 704–710.
Ellis, C.J. (2012) Lichen epiphyte diversity: a species, community and trait-based review.Perspectives in Plant Ecology, Evolution and Systematics,14, 131–152.
Ellis, C.J. & Coppins, B.J. (2010) Partitioning the role of climate, pollution and old-growth woodland in the composition and richness of lichen epiphytes in Scotland. Lichenologist, 42, 601–614.
Field, R., Hawkins, B.A., Cornell, H.V., Currie, D.J., Diniz-Filho, J.A.F., Guégan, J.-F., Kaufman, D.M., Kerr, J.T., Mittelbach, G.G., Oberdorff, T., O’Brien, E.M. & Turner, J.R.G. (2009) Spatial species-richness gradients across scales: a meta-analysis.Journal of Biogeography,36, 132–147.
Fjeldså, J., Bowie, R.C.K. & Rahbek, C. (2012) The role of moun-tain ranges in the diversification of birds.Annual Review of Ecology, Evolution, and Systematics,43, 249–265.
Gjerde, I., Blom, H.H., Lindblom, L., Sætersdal, M. & Schei, F.H. (2012) Community assembly in epiphytic lichens in early stages of colonization.Ecology,93, 749–759.
González-Megías, A., María Gómez, J. & Sánchez-Piñero, F. (2007) Diversity–habitat heterogeneity relationship at different spatial and temporal scales. Ecography, 30, 31– 41.
Green, T.G.A., Nash, T.H. & Lange, O.L. (2008) Physiological ecology of carbon dioxide exchange.Lichen biology (ed. by T.H. Nash), pp. 152–181. Cambridge University Press, Cambridge.
Harris, G.P. (1971) The ecology of corticolous lichens: 2. The relationship between physiology and the environment. Journal of Ecology,59, 441–452.
Harrison, S., Safford, H.D., Grace, J.B., Viers, J.H. & Davies, K.F. (2006) Regional and local species richness in an insular envi-ronment: serpentine plants in California. Ecological Mono-graphs,76, 41–56.
Hortal, J., Triantis, K.A., Meiri, S., Thébault, E. & Sfenthourakis, S. (2009) Island species richness increases with habitat diver-sity.The American Naturalist,174, E205–E217.
Jovan, S. & McCune, B. (2004) Regional variation in epiphytic macrolichen communities in northern and central California forests.The Bryologist,107, 328–339.
Jüriado, I., Paal, J. & Liira, J. (2003) Epiphytic and epixylic lichen species diversity in Estonian natural forests.Biodiversity and Conservation,12, 1587–1607.
Kiraly, I., Nascimbene, J., Tinya, F. & Odor, P. (2013) Factors influencing epiphytic bryophyte and lichen species richness at different spatial scales in managed temperate forests. Biodiver-sity and Conservation,22, 209–223.
Kristiansen, T., Svenning, J.-C., Pedersen, D., Eiserhardt, W.L., Grández, C. & Balslev, H. (2011) Local and regional palm (Arecaceae) species richness patterns and their cross-scale determinants in the western Amazon.Journal of Ecology,99, 1001–1015.
Lechowicz, M.J. (1982) Ecological trends in lichen photosynthe-sis.Oecologia,53, 330–336.
Leibold, M.A., Holyoak, M., Mouquet, N., Amarasekare, P., Chase, J.M., Hoopes, M.F., Holt, R.D., Shurin, J.B., Law, R., Tilman, D., Loreau, M. & Gonzalez, A. (2004) The metacommunity concept: a framework for multi-scale com-munity ecology.Ecology Letters,7, 601–613.
Lundholm, J.T. (2009) Plant species diversity and environmental heterogeneity: spatial scale and competing hypotheses. Journal of Vegetation Science,20, 377–391.
MacArthur, R.H. (1964) Environmental factors affecting bird species diversity.The American Naturalist,98, 387–397. McCune, B. (1993) Gradients in epiphyte biomass in three
Pseudotsuga–Tsugaforests of different ages in western Oregon and Washington.The Bryologist,96, 405–411.
McCune, B., Dey, J., Peck, J., Heiman, K. & Will-Wolf, S. (1997) Regional gradients in lichen communities of the southeast United States.The Bryologist,100, 145–158.
McIntosh, R.P. (1985) The background of ecology: concept and theory. Cambridge University Press, Cambridge.
McMullin, R.T., Duinker, P.N., Richardson, D.H.S., Cameron, R.P., Hamilton, D.C. & Newmaster, S.G. (2010) Relationships between the structural complexity and lichen community in coniferous forests of southwestern Nova Scotia.Forest Ecology and Management,260, 744–749.
Marini, L., Nascimbene, J. & Nimis, P.L. (2011) Large-scale pat-terns of epiphytic lichen species richness: photobiont-dependent response to climate and forest structure.Science of the Total Environment,409, 4381–4386.
Meier, E., Paal, J., Liira, J. & Jüriado, I. (2005) Influence of tree stand age and management on the species diversity in Esto-nian eutrophic alvar and boreo-nemoral Pinus sylvestris forests. Scandinavian Journal of Forest Research, 20, 135– 144.
Moning, C., Werth, S., Dziock, F., Baessler, C., Bradtka, J., Hothorn, T. & Mueller, J. (2009) Lichen diversity in temperate montane forests is influenced by forest structure more than climate.Forest Ecology and Management,258, 745–751. Mouquet, N. & Loreau, M. (2003) Community patterns in
source–sink metacommunities.The American Naturalist,162, 544–557.
Nascimbene, J. & Marini, L. (2015) Epiphytic lichen diversity along elevational gradients: biological traits reveal a complex response to water and energy. Journal of Biogeography,42, 1222–1232.
Nascimbene, J., Marini, L. & Odor, P. (2012) Drivers of lichen species richness at multiple spatial scales in temperate forests. Plant Ecology and Diversity,5, 355–363.
Nash, T.H. (ed.) (2008)Lichen biology, 2nd edn. Cambridge University Press, Cambridge.
Neitlich, P.N. & McCune, B. (1997) Hotspots of epiphytic lichen diversity in two young managed forests.Conservation Biology,
11, 172–182.
Passy, S.I. (2009) The relationship between local and regional diatom richness is mediated by the local and regional envi-ronment.Global Ecology and Biogeography,18, 383–391. Rapai, S.B., McMullin, R.T. & Newmaster, S.G. (2012) The
importance of macrolichen traits and phylogeny in forest community assemblage along a high elevation gradient in southwestern British Columbia.Forest Ecology and Manage-ment,274, 231–240.
Rosabal, D., Burgaz, A.R., Altamirano, A. & Aragón, G. (2012) Differences in diversity of corticolous lichens between interior and edge of the Monte Barranca semi-deciduous forest, San-tiago de Cuba.The Bryologist,115, 333–340.
Seiferling, I., Proulx, R. & Wirth, C. (2014) Disentangling the environmental-heterogeneity–species-diversity relationship along a gradient of human footprint.Ecology,95, 2084–2095. Soto-Medina, E.A. (2013) Patterns of species richness of family Cladoniaceae in the Neotropics.Cryptogamie, Mycologie,34, 137–148.
Stein, A., Gerstner, K. & Kreft, H. (2014) Environmental hetero-geneity as a universal driver of species richness across taxa, biomes and spatial scales.Ecology Letters,17, 866–880. Stofer, S., Bergamini, A., Aragón, G., Carvalho, P., Coppins, B.J.,
Davey, S., Dietrich, M., Farkas, E., Kärkkäinen, K., Keller, C., Lökös, L., Lommi, S., Máguas, C., Mitchell, R., Pinho, P., Rico, V.J., Truscott, A.-M., Wolseley, P.A., Watt, A. & Scheidegger, C. (2006) Species richness of lichen functional groups in relation to land use intensity.The Lichenologist,38, 331–353. Tamme, R., Hiiesalu, I., Laanisto, L., Szava-Kovats, R., & Partel,
M. (2010) Environmental heterogeneity, species diversity and co-existence at different spatial scales. Journal of Vegetation Science,21, 796–801. DOI: 10.1111/j.1654-103.2010.01185.x Wang, X., Tang, Z., Shen, Z., Zheng, C., Luo, J. & Fang, J. (2012)
Relative influence of regional species richness vs local climate on local species richness in China’s forests. Ecography,35, 1176–1184.
White, E.P. & Hurlbert, A.H. (2010) The combined influence of the local environment and regional enrichment on bird species richness.The American Naturalist,175, E35–E43. Whittaker, R.J., Willis, K.J. & Field, R. (2001) Scale and species
richness: towards a general, hierarchical theory of species diversity.Journal of Biogeography,28, 453–470.
Will-Wolf, S. (2010)Analyzing lichen indicator data in the Forest Inventory and Analysis Program. USDA Forest Service, Pacific Northwest Research Station, Portland, OR.
Will-Wolf, S., Geiser, L.H., Neitlich, P. & Reis, A.H. (2006) Forest lichen communities and environment – How consistent are relationships across scales?Journal of Vegetation Science,17, 171–184.
Additional references for data and computational sources can be found in Appendix 1.
S U P P O RT I N G I N F O R M AT I O N
Additional Supporting Information may be found in the online version of this article:
Appendix S1Additional methodological information.
D ATA A C C E S S I B I L I T Y
Original data may be accessed from the sources cited. A derived data table and scripts for conducting analyses in this paper are available from Dryad (doi:10.5061/dryad.5h59j). Scripts for for-matting data and initial analyses are available at http:// github.com/jescoyle/FIA-Lichens.
B I O S K E T C H E S
Jessica R. Coyleis interested in the drivers of geographical variation in emergent properties of ecological communities and has a particular fondness for lichens.
Allen H. Hurlbertis interested in the ecological and evolutionary processes driving large-scale patterns of distribution, diversity and abundance.
Editor: Thomas Gillespie
A P P E N D I X 1 D ATA A N D C O M P U TAT I O N A L R E F E R E N C E S
Alduchov, O.A. & Eskridge, R.E. (1996) Improved Magnus form approximation of saturation vapor pressure.Journal of Applied Meteorology,35, 601–609.
Bivand, R., Altman, M., Anselin, L.et al. (2015)spdep: spatial dependence: weighting schemes, statistics and models, version 0.5–88 https://cran.r-project.org/web/packages/spdep/ index.html.
Burnham, K.P. & Anderson, D.R. (2002)Model selection and multimodel inference: a practical information-theoretic approach, 2nd edn. Springer-Verlag, New York.
Consortium of North American Lichen Herbaria (CNALH). 2014. Available at: http// :lichenportal.org/portal/index.php (accessed 8 October 2014).
Corripio, J.G. (2014)insol: Solar Radiation, R package version 1.1.1. Available at: https://cran.r-project.org/web/packages/insol/index.html
Hijmans, R.J., Cameron, S.E., Parra, J.L., Jones, P.G. & Jarvis, A. (2005) Very high resolution interpolated climate surfaces for global land areas.International Journal of Climatology,25, 1965–1978.
Jenkins, J.C., Chojnacky, D.C., Heath, L.S. & Birdsey, R.A. (2003) National scale biomass esti-mators for United States tree species.Forest Science,49, 12–35.
Legendre, P. & Legendre, L. (2012)Numerical ecology, 3rd edn. Elsevier Science, Amsterdam. Miles, P.D. & Smith, W.B. (2009)Specific gravity and other properties of wood and bark for 156 tree
species found in North America. USDA Forest Service Northern Research Station Research Note NRS-38. US Forest Service, Newtown Square, PA.
Nagelkerke, N.J.D. (1991) A note on a general definition of the coefficient of determination.
Biometrika,78, 691–692.
Oksanen, J., Blanchet, G., Kindt, R., Legendre, P., Minchin, P.R., O’Hara, R.B., Simpson, G.L., Solymos, P., Stevens, M.H.H. & Wagner, H. (2013)vegan: community ecology package, R package version 2.0–10. https://cran.r-project.org/web/packages/vegan/index.html. PRISM Climate Group (2013) Mean dewpoint temperature and minimum temperature
2.5-arcmin data 1997–2008. Oregon State University. Available at: http:// www.prism.oregonstate.edu/normals/
Ripley, B., Venables, B., Bates, D.M., Hornik, K., Gebhardt, A. & Firth, D. (2015)MASS: support functions and datasets for Venables and Ripley’s MASS, version 7.3–40 https://cran.r-project.org/web/packages/MASS/index.html
USDA FIA (2009)The Forest Inventory and Analysis Database: database description and users manual, Version 4.0 for Phase 2. Available at: http://apps.fs.fed.us/fiadb-downloads/ datamart.html (accessed 15 August 2011).
USDA Forest Service (2002) Forest cover types.National Atlas of the United States. Available at: http://nationalatlas.gov/atlasftp.html (accessed 2 October 2012).