i
THE EFFECTS OF BODY SIZE ON SOFT-BODIED BURROWERS
Jessica Anne Kurth
A dissertation submitted to the faculty at the University of North Carolina at Chapel Hill in partial fulfillment of the requirements for the degree of Ph.D in the Department of
Biology in the University of North Carolina at Chapel Hill.
Chapel Hill 2015
Approved by: William Kier
Louise Roth
Joel Kingsolver Tyson Hedrick
iii ABSTRACT
Jessica Kurth: The effects of body size on soft-bodied burrowers (Under the direction of William M. Kier)
Burrowing is a difficult form of locomotion due to the abrasive, heterogeneous, and dense nature of many substrates. Despite the challenges, many vertebrates and invertebrates spanning multitudes of taxa and body sizes burrow in a variety of terrestrial and aquatic substrates. Unlike terrestrial burrowers and modern digging equipment, many invertebrate burrowers lack rigid elements, and instead possess a fluid-filled hydrostatic skeleton. Soft-bodied burrowing invertebrates range in size from several hundred micrometers in length (e.g. nematodes) to several meters in length (e.g. earthworms), and burrow in environments ranging from muds to sands to soils. However, relatively little of the burrowing literature available has focused the effect of size on burrowing mechanics, and it is possible that the physical
iv
v
ACKNOWLEDGEMENTS
I would like to thank my advisor and committee members for providing key intellectual contributions that were vital to the creation and implementation of many of the experiments performed over the course of my graduate career. I would also like to thank many of the
vi PREFACE
vii
TABLE OF CONTENTS
LIST OF TABLES……….…..………....x
LIST OF FIGURES……….…...xi
LIST OF ABBREVIATIONS………..…xiii
CHAPTER 1: RESEARCH OVERVIEW………..….…....1
Introduction………...…1
The Burrowing Cycle in Soft-Bodied Invertebrates………..…………...….3
Known Adaptations to Burrowing……….…………..4
High Pressure Production………4
Body Wall Stiffening………...4
Septae………...5
Robust Dilator Muscles………5
Mucus………...6
Proposed Size-dependent Adaptations to Burrowing……….………..………...…6
Small Diameter………7
Allometric Force Production………7
Robust Anterior Segments………...7
Study System………..………...8
viii
Implications and Significance………...…….………...…..….11
CHAPTER 2: SCALING OF THE HYDROSTATIC SKELETON IN THE EARTHWORM LUMBRICUS TERRESTRIS...13
Summary………..………..…13
Introduction………..…..……....14
The Hydrostatic Skeleton of Lumbricus terrestris………...16
Scaling of Functionally Relevant Morphological Features………...…....17
Scaling of Linear Dimensions...18
Scaling of Muscle Cross-Sectional Areas and Force Output...20
Scaling of Coelomic Pressure...21
Materials and Methods………..…………..……...21
L. terrestris Collection and Maintenance...21
Anesthetization, Length Measurements, and Dissection...22
Histology and Morphometrics...22
Calculation of Mechanical Advantage and Force Output...24
Statistical Analysis...25
Results………..…………...25
Scaling of Linear Dimensions...25
Scaling of Muscle Cross-sectional Area...26
` Scaling of Leverage and Force Production...28
Scaling of Pressure...29
ix
Scaling Trends...30
Mechanical and Distance Advantage...31
Force Output...32
Pressure from Muscle Contraction...33
Intersegmental Differences...33
Potential Selective Pressures for Allometric Growth...34
Conclusions...35
CHAPTER 3: DIFFERENCES IN THE SCALING AND MORPHOLOGY BETWEEN LUMBRICID EARTHWORM ECOTYPES...37
Summary……….……..….37
Introduction……….…...38
Scaling of Functionally Relevant Morphological Features...41
Scaling of Linear Dimensions...41
Scaling of Body Volume...42
Scaling of Muscle Cross-Sectional Areas and Force Output...42
Materials and Methods………..…….43
Interspecific Measurements and Phylogenetic Reconstruction...43
E. fetida Collection and Maintenance...44
Histology and Morphometrics...44
Calculations of Mechanical Advantage and Force Output...46
x
Results………..……..49
Interspecific Scaling of Linear Dimensions...49
Ontogenetic Scaling of Linear Dimensions...52
Ontogenetic Scaling of Muscle Cross-Sectional Area...54
Ontogenetic Scaling of Mechanical Advantage and Force Production...56
Discussion………..……58
Linear Dimensions and Volume...59
Mechanical Advantage...59
Differences in Calculated Force Production...60
Scaling Similarities...61
CHAPTER 4: THE SCALING OF BURROWING MECHANICS USING X-RAY CINEMATOGRAPHY AND ROBOTICS………..……….62
Summary……….……..….62
Introduction………...………….63
Materials and Methods………...…………66
X-Ray Kinematics...66
Robotics Construction and Testing...69
Strain Hardening Calculations...70
Statistical Analysis...71
Results………..….…….73
Discussion……….…….…..…..78
CHAPTER 5: THE SCALING OF BURROWING FORCES AND PRESSURES IN THE EARTHWORM LUMBRICUS TERRESTRIS...83
xi
Introduction……….……...……84
Materials and Methods………...……..…..85
Pressure Recordings...85
Calculations...87
Statistical Analysis...90
Results……….…..….……90
Discussion………...…….…..94
CHAPTER 6: CONCLUSIONS AND FUTURE DIRECTIONS...98
Major Findings……….……….….98
Significance………..…….99
Future Directions………...………...….…..101
xii
LIST OF TABLES
Table 2.1-Definition of variables ………..…………...………….18
Table 2.2- Scaling of forces………...29
Table 3.1- Scaling of linear dimensions in
L. terrestris (vertical burrower) E. fetida (surface-dweller)………...….…...53
Table 3.2- Scaling of muscle cross-sectional area
in L. terrestris (vertical burrower) E. fetida (surface-dweller)……….……...…….….…55
xiii
LIST OF FIGURES
Figure 1.1- Image of adult and hatchling L. terrestris earthworm…………...………...……9
Figure 2.1- Mechanical and distance advantage schematic………..….……19
Figure 2.2- Histological images of L. terrestris………..…………...23
Figure 2.3- Scaling of length and diameter………..……..26
Figure 2.4- Scaling of muscle cross-sectional area………..……..27
Figure 2.5- Scaling of mechanical advantage………..…..29
Figure 2.6- Scaling of internal pressure during muscle contraction………..……30
Figure 3.1- Photomicrographs of 7-µm-thick sections of Eisenia fetida………..…….45
Figure 3.2- Simplified phylogenetic tree comparing L/D and ecotype………...50
Figure 3.3- Interspecific differences in the scaling of linear dimensions………..……....51
Figure 3.4- Ontogenetic scaling of linear dimensions………..…….…52
Figure 3.5- Ontogenetic scaling of volume………....53
Figure 3.6- Ontogenetic scaling of muscle cross-sectional areas………..…..…..55
Figure 3.7- Predictive model comparing mechanical advantage with body mass………..…...…..56
xiv Figure 4.1-: X-ray image of burrowing earthworm and
the scaling of worm robots……….………64
Figure 4.2- X-ray kinematics experimental setup………..68
Figure 4.3- Hysteresis testing in the worm robots……….…72
Figure 4.4- Marker tracking of burrowing earthworms……….73
Figure 4.5- The effects of body size on burrowing speed……….74
Figure 4.6-The effects of body size on duty factor and skeletal strain……….…76
Figure 4.7-The effects of robot size on soil resistance to inflation………...……77
Figure 4.8- The effects of soil displacement on inflation pressure……….…………..….78
Figure 5.1-Images of burrowing earthworms connected to pressure transducers……….87
Figure 5.2-Area of application during muscle contraction……….………..88
Figure 5.3-Scaling ofaverage pressures from muscle contractions………..91
Figure 5.4- Scaling ofmaximum pressures from muscle contractions………..91
Figure 5.5- Scaling of average force production…………...………92
Figure 5.6- Scaling of maximal force production………..93
xv
LIST OF ABBREVIATIONS AND SYMBOLS
A Area
a Scaling Constant b Scaling Exponent C Projected coelomic area CM Circumferential muscle fibers
D Diameter
d Displacement DA Distance Advantage
F Force
L Body length
L/D Length to diameter ratio LM Longitudinal muscle fibers
M Body mass
MA Mechanical Advantage
Pm Pressure due to muscle contraction
V Volume
1
CHAPTER 1: RESEARCH OVERVIEW
Introduction
Burrowing can be a taxing form of locomotion; soil can be compact, coarse, and resistant to deformation. Despite the challenges, many vertebrates and invertebrates spanning multitudes of taxa and body sizes burrow in a variety of terrestrial and aquatic substrates. Their burrowing actions alter the physical characteristics of their soil environment and have important ecological and economic consequences across habitats and ecosystems (Darwin, 1881; Edwards and Bohlen, 1996).
2
avoiding the need to scrape soil out of the burrow and to bring it to the surface as many hard-bodied burrowers do.
Soft-bodied burrowing invertebrates range in size from several hundred micrometers in length (e.g. nematodes) to several meters in length (e.g. earthworms), and burrow in a variety of terrestrial and marine environments. Relatively little of the burrowing literature available has focused on the effects of body size on burrowing mechanics, however (e.g. Piearce, 1983; Quillin, 2000; Chi and Dorgan 2010). There has been concern and study on the impacts of anthropogenic changes in soil properties from chemicals and heavy machinery on subterranean organisms, yet it is not known if there are size-dependent effects on burrowers. This research may also provide useful information for the design and modification of soft robots for surface locomotion and burrowing (e.g. Trimmer, 2008; Trivedi et al., 2008; Daltorio et al., 2013).
It is possible that the physical characteristics of soil may impose size-dependent constraints on burrowers (Dorgan et al., 2008; Che and Dorgan, 2010; Kurth and Kier, 2014). For example, many soils exhibit strain hardening, in which the modulus of compression or stiffness of the soil increases with increasing strain (Chen, 1975; Yong et al., 2012; Holtz et al., 2010). As burrowers grow they must displace a greater volume of soil, which may result in an increase in the stiffness of the soil surrounding the burrow. There could be morphological adaptations burrowers employ (e.g. becoming relatively thinner) to reduce this strain hardening effect, but such adaptations are not currently known (Piearce, 1983; Kurth and Kier, 2014).
3
hardening poses a significant challenge for growing soft-bodied burrowers, and that burrowers compensate via size-dependent changes in musculoskeletal form and function.
The Burrowing Cycle in Soft-Bodied Invertebrates
Previous research has provided a foundational understanding of the principles of burrowing in animals with hydrostatic skeletons(Piearce 1983; Quillin, 1998; Quillin, 1999; Quillin, 2000; Che and Dorgan, 2010; Lin et al., 2011). Despite their diversity, soft-bodied burrowers such as holothurians, bivalves, annelids, and cnidarians all use a dual anchoring system to burrow (Trueman, 1975). In order to move into the soil, every soft-bodied animal first dilates the posterior of its body to anchor itself while it extends its anterior section forward to excavate the burrow. Once this occurs, the burrower then dilates the anterior portion of the body to anchor itself, and withdraws the posterior portion to draw it into the burrow. In some species, including earthworms, burrowing can also involve ingestion of soil particles to “eat” through the substrate if the substrate is sufficiently dense that displacing soil using the dual anchoring system proves ineffective (McKenzie and Dexter, 1988)
4 Known Adaptations to Burrowing
There are many challenges soft-bodied burrowers must overcome in order to burrow effectively. Although these challenges are shared among soft-bodied burrowers, invertebrates across many taxa have developed numerous ways to compensate. Known adaptations to burrowing in such animals include: high pressure production, a stiff body wall, the presence of septa, an eversible proboscis, and friction-reducing mucus production.
High Pressure Production
Pressurization of the hydrostatic skeleton allows for sufficient force production and turgor pressure to burrow (McKenzie and Dexter, 1988). Burrowing animals must overcome greater resistance to movement than their surface dwelling counterparts, and thus burrowers generally have more well developed musculature and higher pressure production. (McKenzie and Dexter, 1988). Both terrestrial and aquatic burrowing is challenging for soft-bodied
invertebrates; high pressure production is found in both marine and terrestrial burrowers (Trueman, 1966; Seymour, 1969).
Body Wall Stiffening
5
rely heavily on passive mechanisms to keep the body rigid during burrowing, while many marine polychaetes such as the lugworm Arenicola marina depend on active muscle contractions to achieve rigidity (Clark, 1967; Trueman, 1966). The prevalence of passive or active stiffening mechanisms is largely environment-dependent; terrestrial soft-bodied invertebrates often use passive body wall stiffening to counteract gravitational effects, while marine soft-bodied invertebrates are supported by the surrounding water column and do not require passive stiffening.
Septae
In addition to keeping the body wall rigid, the use of septa is also adaptive for burrowing for a number of other reasons. These muscular divisions between segments act as bulkheads within an animal’s body, allowing for the isolation of fluid between segments. While the presence of septa does not appear to be a prerequisite for burrowing, it can assist soft-bodied burrowers by allowing different areas of the body to act independently from one another (Newell, 1950; Clark, 1967). Because fluid pressurization from muscle contraction cannot pass down the body while the septa are contracted, muscular contraction in one part of the body does not pressurize or contract segments further down the body (Clark, 1967). Such abilities can be useful while burrowing; if some segments become impeded underground, other segments can continue functioning normally. In addition, damage to several segments will not debilitate the entire animal. In fact, septa allow earthworms to perform autotomy (tail loss when threatened) without excessive fluid leakage (Maginnis, 2006).
Robust Dilator Muscles
6
(Bouché, 1977). This is because a majority of soil displacement occurs during radial expansion and dilation of the body (Barnett et al., 2009). By shortening and thereby expanding their bodies and forcing soil aside, burrowers effectively enlarge the sides of the burrow to a sufficient diameter to allow the remainder of the body to enter. Radial expansion of the animal also tends to break up soil particles ahead of the animal, making forward progression into the soil easier (Seymour, 1969; Keudel and Schrader, 1999). It may also open new voids in the soil for the earthworm to enter and progress forward (Barnett et al., 2009). Another important function of radial dilation is anchorage. Radial expansion also allows burrowers to secure themselves in the soil and prevent backslip during burrow excavation (Trueman, 1975).
Mucus
Friction can severely impede locomotion in soil (Dorgan et al., 2013). Soil particles can attach to burrowing organisms, forcing the animal to drag soil along with it as it moves (personal observation). In order to lubricate the body and reduce friction with the soil, some burrowers have mucus producing cells (Edwards and Bohlen, 1996; Gibson et al., 2006). In addition to reducing friction, production of mucus can also serve as a kind of adhesive that binds soil particles together to form the burrow’s walls (Gibson et al., 2006).
Proposed Size-Dependent Adaptations to Burrowing
While the aforementioned adaptations are of great importance in burrowing for soft invertebrates, the list is likely not exhaustive. Below, I propose several additional burrowing adaptations in animals possessing hydrostatic skeletons. These adaptations consider the
7 Small Diameter
Thin bodies may be a key adaptation in a soft-bodied burrower to mitigate strain hardening in soils as the animal becomes larger. Strain hardening occurs when the modulus of compression or stiffness of the soil increases with increasing strain, which occurs in granular soils and consolidated clays (Chen, 1975; Holtz et al., 2010; Yong et al., 2012). As an earthworm grows in cross-section, it must displace more soil radially, which may result in an increase in the stiffness of the soil surrounding the burrow. Thus, strain hardening may be negligible in small burrowers but could pose significant challenges in large burrowers. By growing
disproportionately thin, the animal’s cross-sectional area is reduced. In turn, less soil must be radially displaced and strain hardening would be reduced compared with an animal that maintains its proportions.
Allometric Force Production
If soil indeed becomes disproportionately resistant for larger burrowers due to strain hardening, then I predict the ontogenetic development of muscle area and force production to also grow disproportionately to match the soil resistance. Prior research has noted the importance of robust dilator muscles to displace soil for burrow formation, break up soil particles ahead of the burrower, and anchor burrowers to prevent backslip (Chapman, 1950; Bouché, 1977; Keudel and Schrader, 1999). I thus expect dilator muscle force to increase rapidly with body size to overcome strain hardening.
Robust Anterior Segments
8
body of the earthworm often dissipate about halfway down the length of the worm (Yapp, 1956). In burrowing, I have observed that approximately the first 30 segments appear to be involved in the formation of the burrow in the earthworm Lumbricus terrestris; contraction of the remaining segments appear to draw the body into the burrow and consolidate the burrow’s walls. Thus I believe that earthworms would need the anterior portion of their body to be more powerful relative to the rest of their body in order to exert sufficient force to create a new burrow. I predict that the muscle cross-sectional area and forces in the anterior segments will be large relative to the middle and posterior segments.
Study System
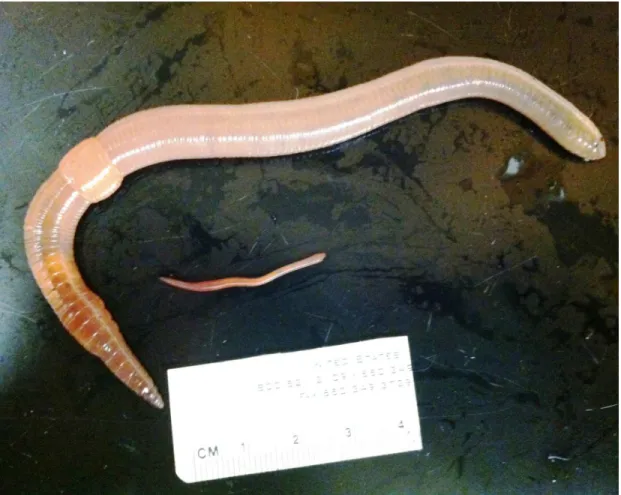
L. terrestris is an ideal species for scaling and burrowing research as it is a deep terrestrial burrower that grows 3 orders of magnitude in mass during development (Fig. 1.1) (Quillin, 1998). The adults of this species can excavate permanent vertical burrows as deep as 1-2 meters below the soil surface, while the hatchlings and juveniles are generally found in the first few centimeters of soil (Arthur, 1965; Gerard, 1967; Piearce, 1986). This species is also
commercially available, can be bred in the lab, and is of environmental and commercial interest in soil amelioration (Butt et al., 1992).
9
waves of circumferential muscle and longitudinal muscle contraction typically involving approximately 30 segments that pass from anterior to posterior down the length of the body
Figure 1.1: Comparison of adult and hatchling L. terrestris earthworm. The adult is approximately 8g in mass, and the hatchling is approximately 0.3g in mass.
10 1.6 Thesis Overview
The overall goal of my work is to understand soil/animal interactions in soft-bodied invertebrates, how changes in body size might alter these interactions, and how the hydrostatic skeleton has adapted to burrowing locomotion. Past work was limited by the ability to visualize subterranean animals in natural soil, an inability to differentiate tissue types in the smallest burrowers, and limited knowledge of terrestrial soil behavior during burrowing (e.g. Quillin, 1998, Quillin, 2000; Dorgan et al., 2005). I used alternative methods such as glycol methacrylate histology, x-ray cinematography, and robotics in order to explore these topics and move the field forward. Below, I briefly outline the content and relevance of the chapters that follow.
Chapter 2: I measured the ontogenetic scaling of the hydrostatic skeleton of Lumbricus terrestris using glycol methacrylate histology to predict changes in skeletal function with size. I then related the scaling of the skeleton to size-related changes in burrowing mechanics and soil interactions. This allowed me to form testable predictions concerning the effects of body size on burrowing mechanics and kinematics.
Chapter 3: I compared the ontogenetic and interspecific scaling of burrowing and
surface-dwelling lumbricid earthworms to determine if the allometric scaling relationships found in L.
terrestris earthworms are adaptations to burrowing constraints. I predicted that surface-dwelling
earthworms would scale differently from burrowing earthworms due to constraints imposed by
the soil.
Chapter 4: To explore if soil stiffness varies with burrower size, I measured the scaling of
11
Chapter 5: If soil properties indeed change with burrower size, burrowers likely alter their burrowing behavior as they grow. To determine the effects of body size on burrowing mechanics, I measured the scaling of pressure generation in the hydrostatic skeleton during burrowing locomotion. I then empirically tested for size-related differences in burrowing pressures and forces.
Implications and Significance
Burrowers are found in nearly every environment on earth. Their actions aid in soil de-compaction, nutrient recycling, and air and water infiltration. Ultimately, these ecosystem engineers improve soil quality for agriculture and ecosystems alike (Darwin, 1881).
Soft-bodied burrowers displace the soil laterally during burrowing, avoiding the need to remove soil from the burrow and bring it to the surface as in many hard-bodied burrowers (e.g. crabs, moles, ants). No burrowing robots interact with soil in this manner, though crawling soft-bodied robots exist (e.g. Trimmer, 2008; Trivedi et al., 2008). I hope that my research provides new insights into the application of worm-like robots for burrowing. Such a machine may prove useful for irrigation, soil amelioration, and tunnel construction, since earthworms are capable of making numerous deep, complex, and unobstructed burrows.
There is also concern and study on the impacts of anthropogenic changes in soil
properties from chemicals and heavy machinery on subterranean organisms (e.g. Ehlers, 1975; Roberts and Dorough, 1985; Chan and Barchia, 2007), yet it is not known if there are size-dependent effects on burrowers. Machinery could detrimentally affect certain life history stages more than others, but I am aware of relatively little research on this issue (Gerard, 1967).
12
overcome it. I then demonstrate how this effect impacts the scaling of terrestrial burrowing kinematics and mechanics. The resulting scale effects are vastly different from other forms of locomotion, and show interesting reversals and exceptions that are likely unique to burrowing.
13
CHAPTER 2: SCALING OF THE HYDROSTATIC SKELETON IN THE EARTHWORM, LUMBRICUS TERRESTRIS1
Summary
The structural and functional consequences of changes in size or scale have been well studied in animals with rigid skeletons, but relatively little is known about scale effects in animals with hydrostatic skeletons. I used glycol methacrylate histology and microscopy to examine the scaling of mechanically important morphological features of the earthworm Lumbricus terrestris Linnaeus, 1758 over an ontogenetic size range from 0.03-12.89 g. I found that L. terrestris becomes disproportionately longer and thinner as it grows. This increase in the length to diameter ratio with size means that, when normalized for mass, adult worms gain approximately 117% mechanical advantage during radial expansion, compared with hatchling worms. I also found that the cross-sectional area of the longitudinal musculature scales as body mass to the ~0.6 power across segments, which is significantly lower than the 0.66 power predicted by isometry. The cross-sectional area of the circumferential musculature, however, scales as body mass to the ~0.8 power across segments, which is significantly higher than predicted by isometry. By modeling the interaction of muscle cross-sectional area and
mechanical advantage, I calculate that the force output generated during both circumferential and longitudinal muscle contraction scales near isometry. I hypothesize that the allometric scaling of earthworms may reflect changes in soil properties and burrowing mechanics with size.
1 This chapter previously appeared as an article in the Journal of Experimental Biology. The original citation is as
14 Introduction
Body size plays a pivotal role in the structure and function of all organisms. Size affects how an organism interacts with its environment as well as the processes needed for survival (Vogel, 1988). Size also imposes physical constraints on organisms, with fundamental effects on organismal design (Schmidt-Nielson, 1997). A range of important traits change as a function of body size, including: geometry, metabolic rate, kinematics, mechanics, and even lifespan. As a consequence, almost every facet of an organism’s life may be influenced by its size, including its physiology, morphology, ecology, and biomechanics (Schmidt-Nielson, 1984; Quillin, 1999; Vogel, 2013; Biewener, 2005; Hill et al., 2012). Scaling, the changes in form and function due body size, has been studied primarily in the vertebrates and in some arthropods (e.g. Schmidt-Nielson, 1997; Biewener, 2005; Nudds, 2007; Chi and Roth, 2010). The effects of scaling on soft-bodied animals have, however, received relatively little attention. The aim of this study was to use histological and microscopic techniques to examine the effects of size and scale on components of the hydrostatic skeleton of an iconic soft-bodied animal, the earthworm.
Many soft-bodied organisms or parts of organisms (e.g. terrestrial and marine worms, cnidarians, echinoderms, bivalves, gastropods, nematodes) possess a hydrostatic skeleton. Hydrostatic skeletons are characterized by a liquid-filled internal cavity surrounded by a
muscular body wall (Kier, 2012). Because liquids resist changes in volume, muscular contraction does not significantly compress the fluid and the resulting increase in internal pressure allows for support, muscular antagonism, mechanical amplification, and force transmission (Chapman, 1950, 1958; Alexander, 1995; Kier, 2012).
15
on their form and function. Indeed, many individual cephalopods, which rely on a type of hydrostatic skeleton termed a muscular hydrostat, may grow through this entire size range and larger. In addition, many of these animals burrow, and the scaling of burrowing mechanics is also poorly understood compared with other forms of locomotion. We also know little about the effects of the physical properties of the soil on burrowing organisms, or how changes in body size impact soil-animal interactions. Further, this work is of interest because these animals are taxonomically diverse, they live in many environments, and are ecologically and economically important in bioturbation, ecosystem engineering, and soil maintenance. Human-induced changes in soil properties from chemicals and heavy machinery could impose size-dependent effects on burrowers that can only be predicted by understanding the scaling of the morphology and mechanics of burrowers. Finally, this research may provide insights useful for the design of biomimetic soft robots for surface locomotion and for burrowing (e.g. Trimmer, 2008; Trivedi et al., 2008; Daltorio et al., 2013).
Previous research on scaling in soft-bodied animals has provided a foundation for our understanding of the scaling of hydrostatic skeletons (Piearce 1983; Quillin, 1998; Quillin, 1999; Quillin, 2000; Che and Dorgan, 2010; Lin et al., 2011). A number of important issues remain unexplored, however. Prior studies did not sample the smallest specimens in the size range, and were unable to measure several mechanically relevant aspects of the morphology (e.g.
16
skeleton have not yet been tested, including possible size dependent changes in muscle stress, muscle cross-sectional area, skeletal leverage, burrowing kinematics, respiration, and soil properties (Pearce, 1983; Quillin, 2000).
In this study, I investigated the scaling of functionally relevant aspects of hydrostatic skeleton morphology, using an ontogenetic size range of the earthworm Lumbricus terrestris. The results provide new insights into the effects of scale on hydrostatic skeletons and allow me to make testable predictions about the implications of body size for distance and mechanical advantage, force output, and internal pressure production.
The Hydrostatic Skeleton of Lumbricus terrestris
17
of circumferential and longitudinal muscle contraction along the length of the worm during locomotion (Gray and Lissman, 1938; Quillin, 1999).
Scaling of Functionally Relevant Morphological Features
Rather than maintaining similar relative proportions with change in body size, termed isometric growth, many animals show allometric growth, in which the relative proportions change with body size (Huxley and Tessier, 1936; Schmidt-Nielsen, 1997). Allometry is common in animals with rigid skeletons, which must increase disproportionately in relative cross-section to avoid buckling due to increase in mass. Hydrostatic skeletons lack rigid elements loaded in compression and have been hypothesized to scale isometrically (Quillin, 1998). Thus my null hypothesis is isometric scaling, which can be tested as follows. Since the density of an animal does not change significantly with size, the mass (M) is proportional to the volume (V). If an earthworm scales isometrically, linear dimensions such as length (L) or diameter (D) are predicted to scale to the animal’s V1/3 and thus M1/3 and any area, such as surface area or muscle cross-sectional area, will scale as V2/3 and thus M2/3 (see Table 2.1belowfor terms).
Alternatively, I hypothesize that the hydrostatic skeleton may scale allometrically in response to selective pressures and constraints on the animal as it grows. Such factors are
18
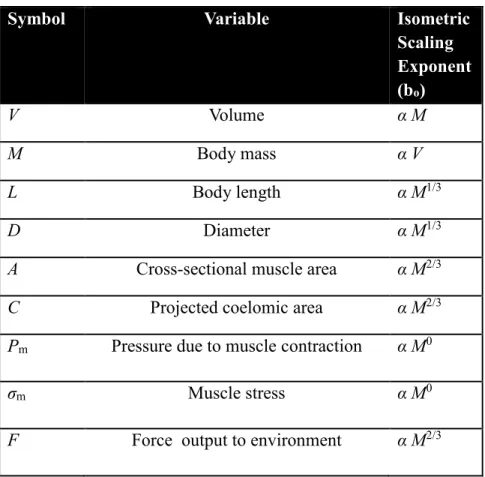
Table 2.1: Definition of variables used and their isometric scaling exponents. Scaling of Linear Dimensions
The scaling of the linear dimensions and muscle cross-sectional areas have important implications for the mechanics of the organism, including its kinematics, force production, mechanical advantage, and internal coelomic pressure. For hydrostatic skeletons, a change in the length-to-diameter (L/D) ratio affects the leverage provided by the skeletal support system. This can be understood by first referring to animals with rigid skeletons in which levers may amplify force (force output > force input from muscle contraction and thus positive mechanical
advantage) or amplify distance (distance output > distance input from muscle contraction and thus positive distance advantage) (Kier and Smith, 1985; Vogel, 1988). Mechanical advantage and distance advantage are reciprocal. Although cylindrical hydrostatic skeletons lack rigid levers, they still allow mechanical advantage or distance advantage, depending on the orientation
Symbol Variable Isometric
Scaling Exponent (bo)
V Volume α M
M Body mass α V
L Body length α M1/3
D Diameter α M1/3
A Cross-sectional muscle area α M2/3
C Projected coelomic area α M2/3
Pm Pressure due to muscle contraction α M0
σm Muscle stress α M0
19
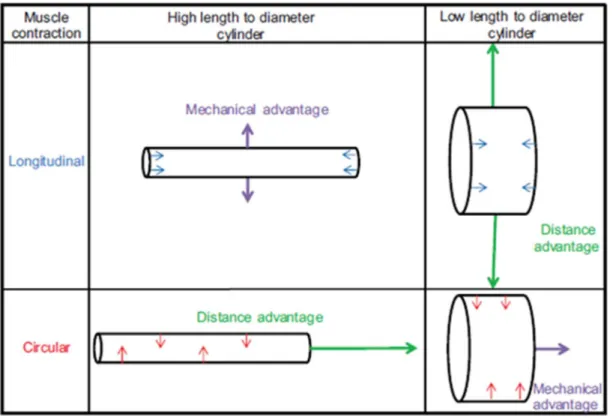
of the musculature in question and the length/diameter (L/D) ratio of the body (Kier and Smith, 1985). For instance, if two cylindrical bodies have identical volume, but one is more elongate and thus has a larger L/D ratio, the body with the larger L/D ratio will show greater distance advantage during elongation (due to shortening by circumferential muscle) and greater
mechanical advantage during lateral expansion (due to shortening by the longitudinal muscle), compared with a hydrostatic skeleton with a smaller L/D ratio (Fig. 2.1)(Vogel, 2013)\
Fig. 2.1. Schematic comparing skeletal leverage between a high length to diameter cylinder and a low length to diameter cylinder.
20
relatively greater (an increase in distance advantage for the circumferential muscle). From the standpoint of the longitudinal muscles, an increase in the L/D ratio would result in an increase in mechanical advantage of this musculature in radial expansion of the worm. Since mechanical advantage and distance advantage are reciprocal, an increase in the L/D ratio would decrease the mechanical advantage of the circumferential musculature and decrease the distance advantage of the longitudinal musculature.
Scaling of Muscle Cross-Sectional Areas and Force Output
The scaling of muscle physiological cross-sectional area (A) determines how relative force production by the musculature changes with size, because force due to muscle contraction is proportional to cross-sectional area. If the circumferential and the longitudinal musculature scale isometrically, the cross-sectional area of each will be proportional to M2/3. The final force output the animal exerts, however, depends not only on the force producing muscles, but also the force transmitting skeleton.
The force transmitted by the skeleton to the environment is a product both of the force generated by the muscles and the mechanical advantage produced by the skeleton itself: F α A(MA) (1) Where F is the force output to the environment, A is the muscle cross-sectional area, and MA is the mechanical advantage from the skeleton. As stated above, mechanical advantage in
21 Scaling of Coelomic Pressure
The internal pressure due to muscle contraction is a function of the stress in the muscles, the cross-sectional areas of the muscles, and the projected coelomic area over which the muscles act (equation 3 from Quillin, 1998):
Pm= (σmA)C -1 (2) Where Pm is the pressure in the coelomic fluid due to muscle contraction, σm is the muscle stress, A is the cross-sectional area if the muscle, and C is the area of the coelom. If L. terrestris grows isometrically and the peak isometric stress in the muscle (σm) remains constant with body size, the internal coelomic pressure from muscle contraction (Pm) will be constant since the ratio of the cross-sectional area of the muscle (A) and the coelomic area (C) would be unchanged. If the worm scales allometrically in either muscle area (A) or coelomic area (C), then pressure will change with body size.
Materials and Methods
L. terrestris Collection and Maintenance
22 Anesthetization, Length Measurements, and Dissection
Each worm was anesthetized in a 10% ethanol solution in distilled water (v/v) until quiescent, patted dry, and weighed. The length was obtained after pulling the worm by the anterior end along the bench surface in order to straighten the body and extend the segments to a consistent resting length. Because L. terrestris does not add segments with growth, I measured the length of the entire body (Piearce, 1983; Quillin, 1998). The worm was then sacrificed and three blocks of tissue containing 20 segments each were removed (segments 1-20, 21-40, and 41-60, numbering from anterior). I examined these three areas to document potential variation along the length of the worm, although particular attention was paid to segments in the anterior half of the worm since it is of greatest importance in locomotion (the posterior half of the worm is often passively dragged along) (Yapp, 1956).
The tissue blocks were fixed in 10% formalin in distilled water (v/v) for 24-48 hours. After fixation, the blocks were further dissected for embedding (segments 9-14, 29-34, and 49-54). I refer to segments 9-14 as “anterior”, segments 29-34 as “middle”, and segments 49-54 as “posterior”. The anterior, middle, and posterior segments were then cut in half transversely so that both transverse and sagittal sections could be obtained from each location (Fig. 2.2). Histology and Morphometrics
The tissue blocks were partially dehydrated in 95% ethanol and embedded in glycol methacrylate plastic (Technovit 7100, Heraeus Kulzer GmbH, Wehrheim, Germany) to minimize tissue distortion. Sections of 3-7 μm thickness were cut with a glass knife. I used a
23
Fig. 2.2: Photomicrographs (bright field microscopy) of 7-µm-thick sections of Lumbricus terrestris stained with Picrosirius/Fast Green. A. Transverse section through the anterior segments. B. Inset of sagittal section shows higher magnification view of cross-section of the circumferential musculature. C. Parasagittal section through the anterior segments. D. Inset of transverse section shows higher magnification view of cross-section of the longitudinal
musculature. L M, longitudinal muscle; C M, circumferential muscle.
24
I estimated the scaling of internal pressure produced by muscle contraction using Equation 2 and measurements of coelomic area from transverse and sagittal sections, with the assumption of no change with size in the peak isometric stress of the muscle σm.Pressure from longitudinal muscle contraction was calculated using longitudinal muscle cross-sectional area (Al) and projected coelomic area during longitudinal muscle contraction (Cl), while pressure from circumferential muscle contraction was calculated using circumferential muscle cross-sectional area (Ac) and projected coelomic area during circumferential muscle contraction (Cc) (Quillin, 1998):
Pm (longitudinal)= (σmAl)Cl -1 Pm (circumferential)= (σmAc)Cc -1 (3) Calculation of Mechanical Advantage and Force Output
As I describe above, the L/D ratio was observed to change as a function of size and thus the mechanical advantage of the musculature changes during growth. Since the mechanical advantage is the reciprocal of the distance advantage, I calculated the mechanical advantage (MA) of the circumferential musculature as the absolute value of the decrease in body diameter (D) during circumferential muscle contraction divided by the resulting increase in body length (L), as a function of the L/D ratio, for the 25% decrease body in diameter that is typical of L. terrestris during movement (Quillin, 1999). Likewise, the mechanical advantage of the
longitudinal muscle was calculated as the absolute value of the decrease body length of the worm divided by the resulting increase in body diameter, as a function of the L/D ratio:
(circumferential)= | |
| | (longitudinal)= | || |
25 Statistical Analysis
I used the lmodel2 package (Legendre, 2011) in R (R Development Core Team, 2013) for statistical analysis. I performed both ordinary least squares (OLS) and reduced major axis
(RMA) regression on the log transformed scaling data fit to the power function y=aMb, where y represents the morphological traits of interest, a is the scaling constant, M is body mass, and b is the scaling exponent. OLS regression does not account for error in the independent variable, while RMA regression does (Rayner, 1985). I calculated the 95% confidence intervals of the slope to determine if the scaling exponent b was significantly different from the expected isometric scaling exponent, bo, as described previously (e.g. Herrel and O’Reilly, 2006; Nudds, 2007; Chi and Roth, 2010). Both OLS regression and RMA regression fit similar scaling exponents in my analysis and were consistent in distinguishing significant differences from isometry. Because of the similarity and agreement between the models, only the RMA regressions are reported.
Results
Scaling of Linear Dimensions
26
Fig. 2.3: Scaling of linear dimensions. Length refers to body length. Danterior, Dmiddle, and Dposterior refer to the diameters of segments number 10, 30, and 50, respectively, from the anterior. A. Log transformed graph comparing body length to body mass. B. Log transformed graph comparing Dmiddle to body mass. The regressions on 1A and 1B depict the isometric scaling exponent (bo, dashed line) and the scaling exponent fit to empirical data using RMA regression (b, solid line). C. Hypothesis testing of b using 95% confidence intervals (C.I.). * Indicates the C.I.s do not overlap with bo. N=25
Scaling of Muscle Cross-Sectional Area
27
Fig. 2.4: Scaling of muscle cross-sectional areas. Al and Ac refer to longitudinal muscle and
28 Scaling of Leverage and Force Production
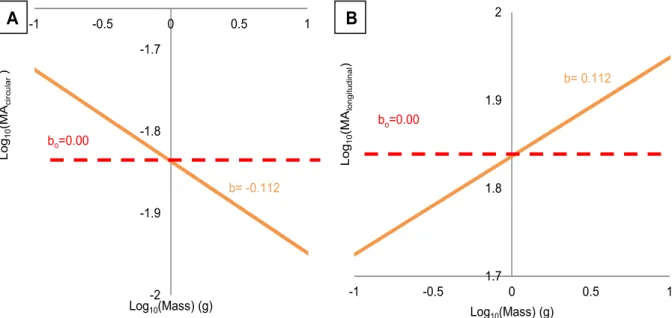
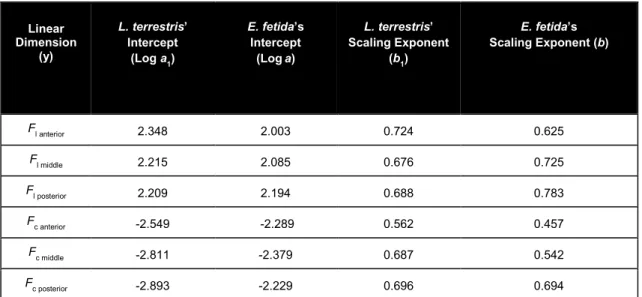
Because of the increase in the L/D ratio with size, the mechanical advantage and distance advantage of the musculature changes with size (Fig. 2.5). I calculated that the mechanical advantage of the circumferential musculature will decrease with body size (b=-0.112) but that of the longitudinal musculature will increase. (b=0.112). Since the force output is proportional to the product of the mechanical advantage and cross-sectional area of the musculature, I calculated that the force output (Table 2.1) from the longitudinal muscle scales greater than isometry in the anterior segments (b= 0.724) and near isometry for the middle and posterior segments (b=0.653, 0.680 for the middle and posterior segments, respectively). Force output from the circumferential muscle of the anterior segments scales less than expected (b=0.561) for isometry, but the force output of the circumferential muscle of the middle and posterior segments scales near isometry (b=0.687, 0.696 for the middle and posterior segments, respectively).
Fig. 2.5: Predictive model comparing mechanical advantage with body mass. A. Mechanical advantage from circumferential muscle contraction and (MAcircumferential) B. mechanical
advantage from longitudinal muscle contraction (MAlongitudinal) a function of earthworm body mass.
-2 -1.9 -1.8 -1.7
-1 -0.5 0 0.5 1
L o g1 0 (M Ac ir c u la r )
Log10(Mass) (g)
bo=0.00
1.7 1.8 1.9 2
-1 -0.5 0 0.5 1
L o g1 0 (M Alo n g it u d in a l )
Log10(Mass) (g)
A B
b= -0.112
b= 0.112
29
Linear Dimension
(y)
L. terrestris’
Intercept (Log a
1)
E. fetida’s
Intercept (Loga)
L. terrestris’
Scaling Exponent (b
1)
E. fetida’s
Scaling Exponent (b)
F
l anterior 2.348 2.003 0.724 0.625
F
l middle 2.215 2.085 0.676 0.725
F
l posterior 2.209 2.194 0.688 0.783
F
c anterior -2.549 -2.289 0.562 0.457
F
c middle -2.811 -2.379 0.687 0.542
F
c posterior -2.893 -2.229 0.696 0.694
Table 2.2: Model predicting the scaling of force output. The RMA regression scaling exponents for each muscle cross-sectional area was multiplied with the scaling exponent of mechanical advantage. Mechanical advantage was calculated by normalizing the changes in L/D ratios with mass and calculating the reciprocal of distance advantage over 25% radial strain. Fl and FC refer to longitudinal muscle and circumferential muscle force output, respectively. The subscripts anterior, middle, and posterior denote the locations sampled.
Scaling of Pressure
I did not observe a difference from isometry (b=0.00) in the ratio of the areas of the muscle and coelom (A/C) for the anterior and middle segments for both the longitudinal muscles (b=0.021, 0.060 for the anterior and middle segments, respectively) and circumferential muscles (b= 0.044, 0.049 for anterior and middle segments, respectively) (Fig. 2.6). The posterior
30
Fig. 2.6: Scaling of the ratio of muscle cross-sectional areas (A) to projected coelomic area (C) where muscle contraction is applied. The subscripts l and c refer to longitudinal and circumferential muscles, respectively. The subscripts anterior, middle, and posterior denote the locations sampled. A. Plot of Al/Cl(middle) relative to body mass. B. Plot of Ac /Cc(middle) relative to body mass. C. Hypothesis testing of b using 95% confidence intervals (C.I.). N=25.
Discussion Scaling Trends
31
methacrylate embedding. Glycol methacrylate embedding procedures have the advantage of causing little distortion and shrinkage, compared with other histological methods, and thinner sections allow better resolution of detail. In addition, her sections were unstained, which makes identification of the components of the tissues challenging, in particular in the smallest
specimens. Instead, I employed selective stains that allowed clear differentiation of muscle and connective tissues. Finally, I used serial sections in both sagittal and transverse planes, while Quillin 1998 sectioned in the sagittal plane only, which complicates the measurement of the cross-sectional area of the longitudinal muscle in particular.
Mechanical and Distance Advantage
I found that L. terrestris grows disproportionately long (L α M0.397) and thin (D α M<0.30),
and thus the length-to-diameter ratio increases with body size (L/D α M>0.10). This trend was also
32 Force Output
Force output to the environment is a function of the forces generated by the muscles and the transmission of those forces by the skeleton. In order to predict the scaling of force output, I multiplied the scaling of the muscle cross-sectional area and the scaling of mechanical advantage of the skeleton. Although the longitudinal muscle cross-sectional area increases less than
predicted by isometry (Al α M0.553-0.620), it gains mechanical advantage with size (MA α M0.112)
due to the increase in L/D. The increase in mechanical advantage compensates for the allometric scaling of the muscle cross-sectional area, and the force output is thus nearly isometric (Fl α
M0.653-0.724). The circumferential musculature shows a similar trend; in the middle and posterior segments, the circumferential muscle cross-sectional area increases at a rate that is greater than predicted by isometry (Ac α M0.69-0.840), but its mechanical advantage decreases with size (MA α
M-0.112). The force output is thus nearly isometric (Fc α M0.561-0.696).
While my findings on the scaling of circumferential muscle cross-sectional area are in agreement with prior research by Quillin 2000, my force calculations do not resolve the disproportionately low scaling of force measured by Quillin 2000 in earthworms crawling through force transducers. In the present study, I was able to address several of the factors that she suggested might be responsible for the discrepancy, including scaling of muscle area and of mechanical advantage. In addition, she suggested that muscle stress might vary with body size, the kinematics of burrowing might change with size, and the resistance to soil deformation might depend on the scale of the deformation, issues that are the focus of my current investigations. An additional possibility may be the relative dimensions of the force transducers used in her
33 Pressure from Muscle Contraction
I found no significant trend with size of the ratio between muscle cross-sectional area and area of the coelom (Pm α A/C α M0). Although the contractile properties of the developing muscle have not been measured, if I assume that the peak isometric stress of the muscle is independent of body size, then these results predict that the pressure produced by the
musculature will be independent of body size. Internal pressure measurements of L. terrestris on the surface are consistent with this prediction and exhibit no trend with body size (Quillin, 1998). Intersegmental Differences
Several of the allometric trends differed between segments, which may reflect the relative importance of different portions of the body in burrowing. Because the peristaltic wave often dissipates as it travels down the length of the body, segments closer to the tail are likely of less importance in burrowing than those near the head (Yapp, 1956). My data are consistent with this proposal as longitudinal force production of the anterior segments increased at a greater rate (Fl
α M0.724) than expected from isometry, while the middle and posterior segments scaled close to
isometry. The longitudinal muscles are thought to be important in moving soil laterally to enlarge the burrow, anchor the worm, and break up soil articles ahead of the worm (Gray and Lissman, 1938; Keudel and Schrader, 1999).
I also found that circumferential muscle force production scaled disproportionately low in the anterior segments (Fc α M0.561), but scaled near isometry for the middle and posterior
34
reflect the increased importance of burrowing locomotion as L. terrestris grow since only adult worms are found to make deep burrows.
Potential Selective Pressures for Allometric growth
Because I identified several significant allometric growth patterns in L. terrestris, it is of interest to consider the potential selective pressures that may be acting on these animals in the environment, especially since previous research had predicted that growth would be isometric. I briefly outline below two hypotheses for the allometric trends observed. These hypotheses are not mutually exclusive and testing them is a focus of my ongoing research.
As an earthworm grows, selection might favor a thinner body in order to reduce “strain hardening” during burrow formation (Piearce, 1983). Many soils, including loose granular soils and consolidated clays, exhibit this phenomenon, in which the modulus of compression or stiffness of the soil increases with increasing strain (Chen, 1975; Yong et al., 2012; Holtz et al., 2010). As an earthworm grows in cross-section, it must displace more soil radially, with a resulting increase in the stiffness of the soil surrounding the burrow. Small worms (including the hatchlings of burrowing earthworm species) are often found near the soil surface and have been hypothesized to squeeze through existing cracks and pores as “crevice burrowers” (Arthur, 1965; Gerard, 1967). If small worms can indeed exploit these small crevices, they may avoid
displacing the soil and thereby avoid the strain hardening effect. As a burrower grows and exceeds the size of the crevices, there could be a selective advantage in becoming relatively thinner to reduce this effect. This may explain why I found that L. terrestris grew
0.553-35
0.620) and the cross-sectional area of the coelom; the ratio of longitudinal muscle area to coelomic area did not change with body size (Al/Cl α M0).
The increase in the length to diameter ratio I observed may also be the result of selective pressures associated with burrowing using a mechanism termed “crack propagation”, which has been demonstrated in numerous burrowers in marine muds (Dorgan et al., 2005; Dorgan et al., 2007; Dorgan et al., 2008). Che and Dorgan (2010) found that small marine worms that use this mechanism, which involves lateral expansion of the anterior portion of the body to fracture the mud, are relatively thicker when burrowing and exert relatively higher forces in order to apply the required stress to propagate a crack ahead of the worm. Thus, they show similar allometry in body dimensions to that observed here for L. terrestris, with small worms being relatively thicker than large worms. Dorgan et al. (2006) propose that terrestrial soils may fracture based on a review of earthworm and root growth literature, but the possibility of crack propagation by terrestrial worms has not yet been investigated. This is an important area for future research since a variety of terrestrial soil environments possess mechanical properties amenable to this burrowing mechanism (Molles, 2009).
Conclusions
My analysis indicates that, contrary to expectations from previous work, the hydrostatic skeleton of L. terrestris does not exhibit isometric scaling during growth. A number of
36
37
CHAPTER 3: DIFFERENCES IN THE SCALING AND MORPHOLOGY BETWEEN LUMBRICID EARTHWORM ECOTYPES
Summary
38 Introduction
Burrowing is a difficult form of locomotion due to the abrasive, heterogeneous, and dense nature of many substrates. Despite the challenges, many vertebrates and invertebrates ranging from micrometers to meters in length burrow effectively in a variety of substrates. Their burrowing actions alter the soil environment and aid in nutrient recycling, air and water
infiltration, and soil decompaction.
Many invertebrate burrowers lack rigid skeletal elements, relying instead on a hydrostatic skeleton consisting of a liquid-filled internal cavity surrounded by a muscular body wall
(Chapman, 1958; Kier, 2012). When the muscles in the body wall contract, the internal fluid is pressurized, allowing for skeletal support, muscle antagonism, skeletal leverage, locomotion, and other skeletal functions (Chapman, 1950, 1958; Alexander, 1995). The hydrostatic skeleton can also accommodate deformation in the body due to muscle contraction. Earthworms, for example, possess two predominant muscle orientations, circumferential and longitudinal. Circumferential muscle contraction elongates the worm, allowing it to move forward and excavate a new burrow; the longitudinal muscles shorten and expand the worm laterally, allowing for anchorage and burrow consolidation (Trueman, 1975). In addition, the radial straining of the soil by the longitudinal muscles breaks up soil particles ahead of the worm, reducing the pressure required for axial elongation (Abdalla et al., 1969; Whalley and Dexter, 1994; Keudel and Schrader, 1999; Dorgan et al., 2008).
Soft-bodied burrowing invertebrates range in size from several hundred micrometers in length (e.g. nematodes) to several meters in length (e.g. earthworms), and burrow in a variety of terrestrial and marine environments. The effects of size on burrowing mechanics has not,
39
addition, the impacts on subterranean organisms of anthropogenic changes in soil properties from chemicals and heavy machinery have been investigated previously, yet we do not know if there are size-dependent effects on burrowers (e.g. Ehlers, 1975; Roberts and Dorough, 1985; Chan and Barchia, 2007). This research may also provide insights important for the design of burrowing soft robots (e.g. Trimmer, 2008; Trivedi et al., 2008; Daltorio et al., 2013).
The physical characteristics of soil may impose size-dependent constraints on burrowers (Dorgan et al., 2008; Che and Dorgan, 2010; Kurth and Kier, 2014). For example, many soils exhibit strain hardening, in which the modulus of compression (stiffness) of the soil increases with increasing strain (Chen, 1975; Yong et al., 2012; Holtz et al., 2010). As an earthworm grows in cross-section, it must displace more soil radially as it burrows, which may result in an increase in the stiffness of the soil surrounding the burrow. Small worms may avoid the strain hardening effect due to the relatively small volume of soil they must displace during burrowing. Thus, as a burrower grows there may be a selective advantage to becoming relatively thinner and reducing the volume of the body to mitigate the strain hardening effect (Piearce, 1983; Kurth and Kier, 2014).
40
worms, which do not burrow and are instead found under leaf litter, in manure, and under debris. There are also endogeic worms, which create ephemeral horizontal burrows in the upper 10-15cm of soil and are geophagus (Edwards and Bohlen, 1977). Lastly, there are anecic worms, like L. terrestris, that build deep permanent/semi-permanent vertical burrows and feed on surface litter (Keudel and Schrader, 1999). I refer to these three ecotypes as surface-dwellers, horizontal burrowers, and vertical burrowers, respectively.
I hypothesized that there would be both ontogenetic and interspecific differences between earthworm ecotypes. To mitigate strain hardening, I predicted that the burrowing species would be thinner for any given body mass during development compared with surface-dwellers,
resulting in higher length-to-diameter ratios and smaller body volumes in the burrowing species. I also hypothesized that forces from the longitudinal musculature, which radially expand the worm during contraction, would be relatively larger in the burrowers compared with the surface-dwellers. These muscles are believed to be important in burrowing by anchoring the worm, consolidating the burrow, relieving soil compaction ahead of the worm, and pulling posterior segments into the burrow (Seymour, 1969; McKenzie and Dexter, 1988; Keudel and Schrader, 1999; Barnett et al., 2009). These muscles also move the bulk of soil during burrow formation, and must generate sufficient force to overcome potential strain hardening effects in the soil (Barnett et al., 2009).
41
debris; in fact, the largest pressures exerted in surface crawling earthworms occur during circumferential muscle contraction (Gray and Lissman, 1938; Arthur, 1965; Seymour, 1969).
I found significant differences in the length-to-diameter ratio and scaling between ecotypes and significant ontogenetic differences in scaling between E. fetida and L. terrestris, consistent with my hypotheses (Kurth and Kier, 2014). My results demonstrate that many aspects of the hydrostatic skeleton of earthworms develop in different ways between species, reflecting the ecological context of the organism.
Scaling of Functionally Relevant Morphological Features
A variety of organisms including L. terrestris exhibit allometric growth, in which the relative proportions change with body size rather than remaining constant, as in isometric growth (Huxley and Tessier, 1936; Schmidt-Nielsen, 1997). Since the density of an animal typically does not change with size, the mass (M) is proportional to the volume (V). If an organism scales isometrically, linear dimensions such as length (L) or diameter (D) are predicted to scale to the animal’s V1/3 and thus M1/3 and any area, such as surface area or muscle cross-sectional area, will scale as V2/3 and thus M2/3.
Scaling of Linear Dimensions
42
longitudinal muscles (Kurth and Kier, 2014). Since mechanical advantage and distance
advantage are reciprocal, an increase in the L/D ratio decreases the mechanical advantage of the circumferential musculature and decreases the distance advantage of the longitudinal
musculature.
For any given body mass, I predict that E. fetida will have a lower L/D than L. terrestris because E. fetida is not under selective pressure to minimize its diameter for burrowing. A smaller L/D means that E. fetida will have lower mechanical advantage during longitudinal muscle contraction and higher mechanical advantage during circumferential muscle contraction for a given size than L. terrestris.
Scaling of Body Volume
Body volume likely scales proportionally with mass in E. fetida and L. terrestris since the density of earthworms probably does not change with size. However, there may be interspecific differences in the magnitude of body volumes across ecotypes. If burrowers are thinner than surface-dwellers, they may also have smaller body volumes as a consequence. Small body volumes would allow burrowers to displace a lower volume of soil during burrowing and may mitigate strain hardening.
Scaling of Muscle Cross-Sectional Areas and Force Output
43
F α A(Mechanical Advantage) (1) Where F is the force output to the environment and A is the muscle cross-sectional area (Kurth and Kier, 2014). I predict that the scaling of force output for E. fetida will be lower during longitudinal muscle contraction but higher during circumferential muscle contraction than L. terrestris.
Materials and Methods
Interspecific Measurements and Phylogenetic Reconstruction
I used sexually mature earthworm specimens preserved in 70-95% ethanol in the collections of the Smithsonian Institution Museum of Natural History (Washington, DC). A phylogeny is available of species in the Lumbricidae family (Pérez-Losada et al., 2012), so I focused my analysis on genera from this family to avoid pseudo-replication (Felsenstein, 1985). I further narrowed the study by only comparing lumbricid species whose ecotypes are well
documented (Bouché, 1977; Sims and Gerard, 1985; Edwards and Bohlen, 1996). I used calipers to measure the length and anterior diameter of three adult specimens per species and calculated an average length and diameter, which was then used to calculate the length-to-diameter ratio. I was also able to compare the interspecific scaling of linear dimensions in burrowing and surface dwelling ecotypes. Because many specimens I measured had been dissected and were missing inner organs, I used body volume as a proxy for body mass. I also pooled horizontal and vertical burrowers together for the scaling study due to the low availability of vertically burrowing lumbricid species. No Hormogaster elisae specimens were available for analysis, so it was only used to root the phylogenetic tree as discussed below.
44
2012 used molecular data from multiple specimens of each species, which resulted in significant variation in branch length and branch placement between specimens within a species. The authors attributed this variation to the sampling of cryptic species. Because I do not know which specimens were misidentified, I simplified the phylogeny by placing each species in the clade where most specimens per species appeared. Due to the high variation and uncertainty in branch length I also made all branch lengths equal in my simplified tree. Although this reduced my statistical power, the reduction is relatively minor and tends to produce only false negative results (Grafen, 1989; Martins and Garland, 1991; Swenson, 2009).
E. fetida Collection and Maintenance
E. fetida earthworms were supplied by Uncle Jim’s Worm Farm (Spring Grove, PA USA) as well as raised from hatchlings bred in a colony maintained in the laboratory. Adult worms (~0.1-0.7g) were purchased, raised from purchased juveniles, and raised from colony hatchlings. Hatchlings were raised from cocoons deposited by adults bred in the laboratory colony. All worms were housed in plastic bins filled with moist peat moss (Inouye et al., 2006) at 15ºC (Presley et al., 1996) and were fed dried infant oatmeal (Ownby et al., 2005).
Histology and Morphometrics
The measurements and calculations follow those described in Kurth and Kier, 2014 for L. terrestris in order to allow consistent comparisons between E. fetida and L. terrestris. See
Chapter 2 for details on the measurements and calculations of L. terrestris
45
the entire body. The worm was then sacrificed and three blocks of tissue containing 20 segments each were removed (segments 1-20, 21-40, and 41-60, numbering from anterior).
The tissue blocks were fixed in 10% formalin in distilled water (v/v) for 24-48 hours. After fixation, the blocks were further dissected for embedding (segments 9-14, 29-34, and 49-54). I refer to segments 9-14 as “anterior”, segments 29-34 as “middle”, and segments 49-54 as “posterior”. The anterior, middle, and posterior segments were then cut so that both transverse and sagittal sections could be obtained from each location. The tissue blocks were partially dehydrated in 95% ethanol and embedded in glycol methacrylate plastic (Technovit 7100, Heraeus Kulzer GmbH, Wehrheim, Germany). Sections of 3-7 μm thickness were cut with a glass knife. I used a Picrosirius/Fast Green stain in order to differentiate muscle from connective tissue (López-DeLeón and Rojkind, 1985) as described previously in Kurth and Kier, 2014. I used Sigma Scan (Systat Software, Inc., San Jose, CA, USA) to make morphological
measurements on micrographs. Longitudinal muscle cross-sectional area (Al) and diameter (D) were measured from transverse sections, whereas circumferential muscle cross-sectional area (Ac) was measured from sagittal sections (Fig. 3.1).The earthworms prepared in this way were flattened slightly and thus had an elliptical cross-sections. To determine an equivalent diameter of a circular cylinder, I measured the major and minor axes, calculated the area of the ellipse and then calculated the diameter of a circle of the same area.
Calculation of Body Volume
Corrected diameter (D) and elongated body length (L) were used to calculate body volume. Since earthworms are approximately cylindrical in shape, body volume was calculated as the volume of a cylinder:
46
Fig. 3.1: Photomicrographs (bright field microscopy) of 0.1g Eisenia fetida and Lumbricus terrestris specimens stained with Picrosirius/Fast Green.All sections were 7μm in thickness. A. Transverse section of L. terrestris showing the cross-sectional area of the longitudinal musculature. B. Transverse section of E. fetida showing the cross-sectional area of the
longitudinal musculature. C. Parasagittal section of L. terrestris showing the cross-sectional area of the circumferential musculature. D. Parasagittal section of E. fetida showing the
cross-sectional area of the circumferential musculature. L M, longitudinal muscle; C M, circumferential muscle.
Calculation of Mechanical Advantage and Force Output
47
L. terrestris during crawling (Quillin, 1999). Since L. terrestris and E. fetida are closely related phylogenetically, a 25% change in diameter is a reasonable assumption for both species. (Quillin, 1999; Kurth and Kier, 2014). Likewise, the mechanical advantage of the longitudinal muscle was calculated as the absolute value of the decrease body length of the worm divided by the resulting increase in body diameter, as a function of the L/D ratio:
ℎ"#$ "% &'(circumferential)= | |
| | ℎ"#$ "% &'(longitudinal)= | || |
(3) These calculations thus provided estimates of the mechanical advantage of both the longitudinal and circumferential musculature as a function of size.
Force production was calculated in each worm as the product of mechanical advantage and muscle cross-sectional area in both the circumferential and longitudinal muscles. I made the assumption that stress in the muscle does not change with ontogeny, though this assumption has not been empirically tested in obliquely striated muscle.
Statistical Analysis
I used R statistical software for both the phylogenetic and ontogenetic analyses (R Development Core Team, 2014). We used the ape package in R (Paradis et al., 2004) to perform independent contrasts on the phylogeny. This approach allowed me to test for correlations between ecotype and L/D ratio while avoiding pesudoreplication (Felsenstein, 1985). I treated ecotype as a continuous variable to allow for transitional/intermediate ecotypes in ancestral nodes.
48
morphological traits of interest, a is the scaling constant, M is body mass, and b is the scaling exponent. Log transforming these data allowed me to perform regression analyses, as b becomes the slope of the line and log(a) becomes the intercept.
I used the caper function (Orme et al., 2012) in R (R Development Core Team, 2014) to perform phylogenetically corrected regression on the interspecific scaling data. I pooled
horizontal and vertical burrowers together for this analysis because only three vertical burrowing species were measured, and all three were similar in body size. To test for differences in slope and intercept between burrowing and surface-dwelling ecotypes, I performed an ANCOVA analysis on the phylogenetically corrected regression data. Although there may be error in the x-variable (i.e. volume) that is not accounted for in a standard ANCOVA, ANCOVAs using model II regression and reduced major axis techniques are not well developed or commonly used (Sokal and Rolhf, 1985). Thus, standard ANCOVAs are still commonly used in scaling studies (e.g. Niven and Scharlemann, 2005; Davies and Moyes, 2007; Snelling et al., 2011).