The Effect of Obesity and Metformin on Influenza Vaccine
Response
By Furquan Khaja
Honors Thesis
Department of Nutrition
University of North Carolina
2017
Approved:
Advisor
Abstract
Understanding the relationship between obesity and immune response is critical in
managing healthcare for all individuals. Previous studies have shown that obesity may be
associated with a suppressed immune response. In this study, we aim to elucidate the extent of
immunosuppression in obese individuals relative to healthy weight individuals. Furthermore, we
seek to investigate the effects of metformin on the immune response of type 2 diabetics;
epidemiological studies show that individuals using metformin instead of other drugs have
significantly lower rates of cancer. Metformin has also shown anti-inflammatory properties, and
as such, may have benefits against the chronic, low-grade inflammation associated with obesity.
Introduction
Influenza is a seasonal acute viral infection that annually affects on average 5-20% of the
US population and causes thousands of deaths. It is estimated that the influenza virus is the cause
of 31.4 million outpatient visits and medical costs of $10.4 billion each year. Lost productivity
from missed workdays and loss of life amounts to $16.3 billion (Molinari et. al. 2007).
As is the case in all public health threats, prevention is the best way to minimize
influenza risk. Studies show that vaccination reduces the risk of flu illness by 50-60%,
preventing millions of flu-related illnesses and hospitalizations (CDC 2017). By administering a
combination of inactivated strains of the influenza virus, the vaccine induces the production of
antibodies that provide immunity against future infection from the influenza virus.
Influenza and Immune Response
The immune system plays the fundamental role of protecting the body from foreign
pathogens and preventing the spread of infectious microorganisms through the body. The
secreting antibodies from lymphocytes known as B cells. B cells have thousands of receptors to
recognize these antigens (bacteria, virus, toxins, chemicals, or other foreign particles) and in turn
mount an immune response to fight the infection; once the B cell recognizes the antigen and is
activated, it proliferates into an antibody-secreting effector cell. These effector cells secrete
antibodies with the same unique antigen-binding site that was initially recognized by the B cell
and bind the antigen, resulting in agglutination and recruitment of macrophages for phagocytosis.
In this way, the body can mount an immune response and get rid of unwanted pathogens.
In order for the cellular immune response to properly combat the influenza virus,
functioning antigen presenting cells (APCs), CD4+
T cells, and CD8+
T-cells are required. The
APC, normally a dendritic cell, presents a peptide from the virus to a naïve CD4+
T cell via MHC
molecules, which causes activation and differentiation of the cell into a T helper cell. The
activated CD4+
T cell now expresses surface proteins that bind to the dendritic cell and increases
the expression of Class 1 MHC molecules on the cell surface, which are recognized by specific
T-cell receptors on the naïve CD8+
T-cell and induce activation. Activated CD8+
T-cells prevent
the influenza virus from spreading by inducing apoptosis in infected cells.
Obesity and Immune Response
Obesity is a condition that impairs the immune function and therefore results in obesity as
independent risk factor for infection from the influenza virus. Affecting millions of people
worldwide, obesity remains a major public health concern that puts individuals at risk for many
other chronic diseases and health conditions such as hypertension, dyslipidemia, Type 2 diabetes,
and coronary heart disease (CDC 2017). Identifying and understanding the differences in the
metabolic pathways in obese and healthy weight individuals is a major step towards finding
Studies show that obese individuals exhibit an impaired immune response over time
relative to that of healthy weight individuals, but no specific mechanism has yet to be targeted.
However, scientists speculate on the immunosuppressive nature of obesity and its associated
impairment to to effectively counteract infection. Obese individuals have been shown to have an
immunocompromised response to influenza vaccination over time (Sheridan et. al. 2012) After a
12-month follow up post vaccination, the study found that high BMI was associated with a
significantly greater decline in influenza antibody titers relative to healthy weight individuals. In
a related study (Paich et. al. 2013), it was found that obese individuals had decreased CD4+ and
CD8+
T-cell activation and decreased expression of functional proteins compared with healthy
weight individuals. They concluded that the diminished level of activation of CD4+
and CD8+
T-cells might be contributing to the increased morbidity from influenza infection in obese
individuals. Likewise, a similar study observing the antibody response of immunized children
found that obese children had a significantly lower anti-tetanus immunoglobulin G (IgG) than
healthy weight children (Eliakim et. al. 2006). They also found a significantly higher level of
interleukin-6 in the obese individuals, an important cytokine in the immune response.
As such, obesity is classified as a state of low-grade, chronic inflammation; due to
metabolic overload, obesity induces stress reactions – oxidative damage, inflammatory response,
and organelle and cell hypertrophy (Wellen et. al. 2003). Cell hypertrophy and eventual rupture
evokes an inflammatory reaction by causing a release of inflammation inducing factors that
activate macrophages and signal the release of cytokines such as the aforementioned IL-6 and
tumor necrosis factor (TNF-α). TNF-α induces insulin resistance by impairing intracellular
signaling via serine phosphorylation of IRS1. Because of the insulin signal impairment, the
hyperglycemia – a hallmark of type 2 diabetes. The hypertrophy of adipocytes reduces the ability
to further store incoming fatty acids and leads to adipose lipolysis and mobilization into the
bloodstream. The influx of free fatty acids to the blood stream associated with the dyslipidemia
in combination with aggravated insulin resistance from inflammatory adipokines poses an
increased health risk for atherosclerosis in type 2 diabetics.
In order to reverse the effects of impaired insulin signaling and the ensuing
hyperglycemia, many type 2 diabetics use a drug known as metformin. It is the most commonly
prescribed medication to treat hyperglycemia and is endorsed by the American Diabetes
Association as the best form of oral therapy for type 2 diabetes. Although the exact mechanism
of metformin at the molecular level is not known, studies show that it inhibits the complex 1 in
the electron transport chain of mitochondria (Viollet et. al. 2012). The inhibition of this complex
accordingly decreases the levels of the ensuing processes of the electron transport chain and
oxidative phosphorylation; there is a decrease in NADH oxidation, causing a decrease in proton
pumping across the inner mitochondrial membrane, and in turn a lower rate of ATP synthesis.
The lower ATP production decreases the intracellular ratio of ATP to AMP and activates the
AMP-activated protein kinase (AMPK), which has a variety of downstream implications. In a
general sense, AMPK regulates enzymes and transcription factors that convert cells from a
catabolic state to an anabolic state. As such, enzymes and transcription factors involved in lipid
and protein synthesis are inhibited, while those involved in fatty acid oxidation and basal glucose
uptake are up-regulated. Hepatic gluconeogenesis and intestinal absorption of glucose are
decreased, while peripheral uptake and utilization of glucose is increased, effectively reversing
Additionally, recent epidemiological studies show that metformin is associated with
decreased risk of cancer incidence relative to other forms of treatment for diabetic patients
(Decensi et. al. 2010). The mechanism of its anti-cancer properties is not well known, although
murine trials do provide valuable insight. The effects of metformin seem to be twofold. Firstly, it
is involved in tumor suppression; mice with normal T-cell counts, when given metformin, were
able to reject tumors, whereas their T-cell deficient counterparts could not. Secondly, metformin
may also act to increase the number of CD8+
cells and protect them from apoptosis, in turn
increasing the life span of the mice. These studies demonstrate a potential link between
metformin and how it could play a role in the efficacy of an immune response.
To analyze this link, this study uses the influenza vaccine to evoke an immune response.
We aim to elucidate whether obesity influences antibody response to the vaccine, and whether
metformin treatment in obese individuals promotes an immune microenvironment similar to that
of healthy weight individuals. We hypothesize that obese individuals will have poorer immune
response that healthy weight individuals. Furthermore, we hypothesize that obese and diabetic
individuals using metformin will show improved immune response to influenza virus than those
not using metformin.
Methods Study Design
The individuals chosen for this study are part of an ongoing, prospective observational
study carried out at the University of North Carolina Family Medicine Center, an academic
outpatient primary care facility in Chapel Hill, NC. Eligible participants were adult patients at
the Center scheduled to receive the 2009 -- 2010 seasonal trivalent influenza vaccine (TIV).
immunosuppressive drugs, acute febrile illness, history of hypersensitivity to any influenza
vaccine components, history of Guillian -- Barre syndrome, or use of theophylline preparations
or warfarin. All procedures were approved by the Biomedical Institutional Review Board at the
University of North Carolina.
At enrollment, informed consent, height, weight and a baseline serum sample were
obtained. One dose of 2009-2010 seasonal TIV was administered. Participants returned 28-35
days later for a post-vaccination blood draw. Pre- and post-vaccination serum samples were
stored at 80°C until analyzed. Table 1 provides the demographics of the participants selected for
this substudy.
Hemagglutination Assay and Inhibition Assay
Influenza virus particles have a glycoprotein on their surface known as hemagglutinin
that is responsible for binding the virus to cells with sialic acid on their membranes, such as red
blood cells. The presence of virus in infected cells can be determined by measuring
hemagglutination—or the formation of a lattice due to the binding of virus to erythrocytes.
Erythrocytes not bound to virus will sink to the bottom of the well, forming a button. The highest
dilution (or the lowest concentration of virus) resulting in agglutination is the endpoint of the
HAU; the reciprocal of the endpoint dilution is the HAU titer. The assay is therefore an efficient
indicator of the relative quantity of virus.
Next, a hemagglutination inhibition assay (HAI) is needed to determine the level of
antibodies present to the influenza virus in the serum samples. Antibodies to the influenza virus
prevent hemagglutination by binding onto the virus, thereby preventing the binding of the virus
to erythrocytes as well the formation of a lattice. When enough antibodies are present to
dilution of the antibodies from the serum that prevents hemagglutination (the formation of a
lattice) is called the HAI titer of the serum. At this dilution, antibodies are able to recognize and
bind the HA antigens on the virus.
Preparation of the virus
To analyze the serum samples properly without interference, a receptor-destroying
enzyme (RDE) was used to inactivate non-specific inhibitors of viral agglutination and other
naturally occurring agglutinins of red blood cells. The samples were then incubated at 37°C
overnight and heat inactivated at 56°C for 1 hour. After cooling to room temperature, the serum
was diluted with physiological saline at a ratio of 1:10. The influenza virus was separately
prepared and diluted to a titer of 8 HAU/50 μL titer using the hemagglutination assay (HAU).
Running the HAU and HAI
To determine the titer of the influenza virus, an HAU was conducted. First, a red blood
cell suspension of 0.5% was prepared via a series of washes using a centrifuge. Turkey red blood
cells were mixed with sterile phosphate-buffered saline (PBS) and centrifuged for 10 minutes at
4°C with relative centrifugal force of 270 times gravity with deceleration set at 5. Next, the
supernatant was discarded and more sterile PBS was added for another run. This results in a
packed pellet of red blood cells at the bottom of the conical tube. Judging by the size of the
pellet, PBS was added to yield a 0.5% packed RBC suspension.
Next, two-fold virus dilutions were prepared. In the first row of a standard 96-well flat
bottom plate, 180 μL of sterile PBS was added. In row 1, 20 μL of virus was added to the first 10
wells, while the last two rows received 20 μL of PBS to act as controls. Serial dilutions were
made down the plate. Next, 50 μL of dilutions from each well in the plate were transferred to a
plate was then incubated at room temperature for 30 minutes to allow the RBCs to settle. The
plate was then read to see the highest dilution of virus causing complete agglutination. The
reciprocal of the dilution was taken as the HAU titer. To confirm, the diluted virus was tested
again to ensure the proper HAU titer was found.
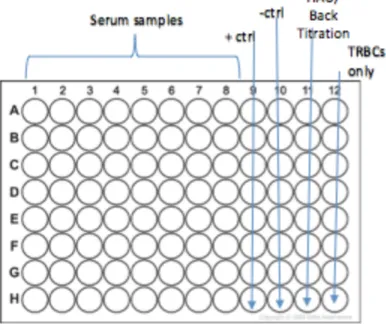
Next, the hemagglutination inhibition assay used turkey RBCs at 0.5%, washed and
centrifuged in the same manner. The 96-well plate was setup as described in Figure 1. Each plate
analyzed two samples, including both pre- and post-vaccination serum, as well as their
duplicates. Additionally, positive and negative controls are included, as well as a back titration of
virus and a column for turkey RBCs only. The positive control received 4 HAU virus, PBS, and
positive serum with antibodies of known HAI. The negative control received 4 HAU virus and
PBS without any serum. The back titration received varying amounts of virus with PBS, also
without serum. This allows for verification of the correct HAU calculation and a baseline for
buttoning versus lattice formation.
After serial dilutions, 8 HAU / 50 μL of influenza virus was added to all wells in columns
1-10, while columns 11 and 12 (the HAU and the turkey RBC control) received PBS instead.
The plate was then incubated at room temperature for 15 minutes. Finally, 0.5% turkey RBCs
were added to all wells, and the plate was again incubated at room temperature for 20 minutes.
The plate was read for the highest dilution of antibody that prevented the formation of a lattice;
Figure 1. Example setup of 96-well V-bottom plate for hemagglutination inhibition assay with columns as described above. Each plate can hold 2 serum samples: pre- and post-vaccination,
each with their duplicates.
Table 1. Demographic data for influenza vaccinated individuals from the UNC Family Medicine Center (n=23)
Variable Metformin
Diabetic Obese
Metformin Diabetic Healthy Weight
Nonmetformin Diabetic Obese
Nonmetformin Diabetic Healthy Weight Sex – no. (%)
Male 3 (30.0) 0 (0) 1 (20) 1 (33.3)
Female 7 (70.0) 5 (100.0) 4 (80) 2 (66.6)
Age – yr.
Mean 57.6 ± 7.1 65.7 ± 7.3 65.0 ± 2.6 66.4 ± 5.1
Range 44.7-69.9 57.3-75.7 60.7-67.1 63.3-72.2
Race – no. (%)
Caucasian/White 4 (40.0) 15 (75.0) 4 (80) 3 (100.0)
Black/African American
6 (60.0) 4 (20.0) 1 (20) 0 (0)
Asian 0 (0.0) 1 (5.0) 0 (0) 0 (0)
BMI – kg/m3
Calculations and Statistical Analysis
From the HAI, pre- and post-vaccination antibody levels were recorded. To evaluate the
level of change in antibody response from pre-vaccination to 30-day post-vaccination, fold
change was calculated using the formula:
𝑓𝑜𝑙𝑑𝑐ℎ𝑎𝑛𝑔𝑒 = 𝑝𝑜𝑠𝑡𝑣𝑎𝑐𝑐𝑖𝑛𝑎𝑡𝑖𝑜𝑛 𝐻𝐴𝐼− 𝑝𝑟𝑒𝑣𝑎𝑐𝑐𝑖𝑛𝑎𝑡𝑖𝑜𝑛 𝐻𝐴𝐼
𝑝𝑟𝑒 𝑣𝑎𝑐𝑐𝑖𝑛𝑎𝑡𝑖𝑜𝑛 𝐻𝐴𝐼
A t-test and One-way Analysis of Variance (ANOVA) using the GraphPad Prism 7 software
(GraphPad Software, Inc. La Jolla, CA).—P-values < 0.05 are considered significant.
Results
Table 1. Data for Diabetic and Obese Individuals using Metformin
Subject ID
HAI- Pre
HAI- (30 day) Post
Fold Change
07_2630 80 80 0
07_2636 40 80 1
07_2691 80 80 0
07_2668 80 160 1
07_2776 40 160 3
07_2680 20 40 1
07_2710 120 120 0
07_2643 80 160 1
07_2742 160 160 0
07_2598 320 320 0
Average 102 136 0.7
Table 2. Data for Diabetic and Healthy Weight Individuals using Metformin
Subject ID HAI- Pre HAI- (30day) Post Fold Change
07_2785 0 40 4
07_2623 640 640 0
07_2646 40 160 3
07_2773 40 40 0
07_2695 20 40 1
Average* 25 70 1.6
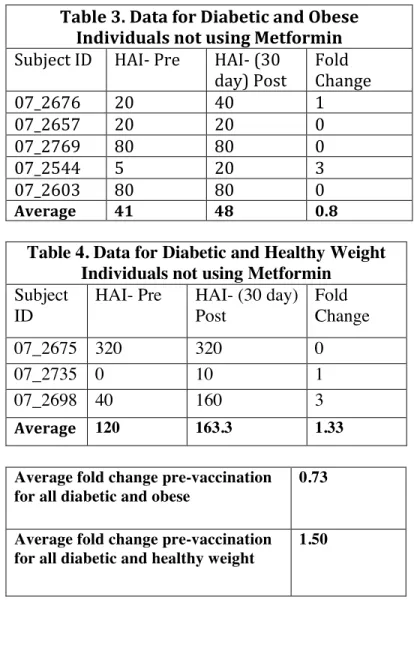
Table 3. Data for Diabetic and Obese Individuals not using Metformin
Subject ID HAI- Pre HAI- (30
day) Post Fold Change
07_2676 20 40 1
07_2657 20 20 0
07_2769 80 80 0
07_2544 5 20 3
07_2603 80 80 0
Average 41 48 0.8
Table 4. Data for Diabetic and Healthy Weight Individuals not using Metformin Subject
ID
HAI- Pre HAI- (30 day) Post
Fold Change
07_2675 320 320 0
07_2735 0 10 1
07_2698 40 160 3
Average 120 163.3 1.33
Average fold change pre-vaccination for all diabetic and obese
0.73
Average fold change pre-vaccination for all diabetic and healthy weight
Analysis
Figure 2. This figure depicts the fold change of HAI titer from pre-vaccination to post-vaccination for both healthy weight and obese individuals, regardless of medication status –
using metformin or not. I used an unpaired t-test to test for significance for a p value of 0.1766.
Figure 3. This figure depicts the HAI titer of healthy weight and obese individuals, regardless of medication status, comparing Day 0 (before vaccination) and Day 30 (post-vaccination). I used
an Ordinary one-way ANOVA to test for significance between the groups for a p value of 0.476. Heal
thy Wei
ght D ay 0
Heal thy
Wei ght D
ay 3 0
Obese Day 0Obese Day 30 -200
0 200 400 600 800
HAI T
iter
Healthy Weight Obese
-1 0 1 2 3 4 5
Metabolic Status
Figure 4. This figure depicts the fold change for both metformin users and non-metformin users, regardless of weight status, from pre-vaccination to post-vaccination. I used an unpaired t-test
and found a p-value of 0.867.
Figure 5. This figure compares the HAI titer of metformin and non-metformin users, regardless of weight status, from Day 0 (pre-vaccination) to Day 30 (post-vaccination). I used a two-way
ANOVA to test for significance. There was no significance between the groups from
pre-to-post-vaccination (p-value 0.463). However, there was statistical significance in HAI titer between the
metformin-users and non-metformin users (p-value 0.0119). Metfo
rmin Use
rs
Non Metfo
rmin Use
rs -1
0 1 2 3 4
Fold Change
0 days 30 days 0 days 30 days 0
100 200 300 400
HAI T
iter
Metformin Nonmetformin
Discussion
Prior literature has shown that obese individuals have a compromised immune response
to infection. Specifically, antibody response to the influenza vaccine in obese individuals showed
decreased CD8+
T-cell activation and decreased expression of functional proteins compared with
healthy weight individuals over a 12 month time period (Sheridan et. al. 2012). Obesity also
reduced antibody response to hepatitis B vaccine and tetanus vaccine in children, providing
further evidence of the immune-compromised status of obese individuals (Weber et. al. 1985).
Surprisingly, our data found no significant difference in the fold change of healthy weight
individuals versus their obese counterparts over the 30-day period following vaccination, with a
p-value of 0.1766 (see Figure 3). From this finding we postulate that perhaps the time elapsed
post-vaccination is especially significant; by using a thirty day follow-up post-vaccination, the
window for evaluating immune response between obese and healthy weight individuals may be
too small. The study conducted by Sheridan et. al. found significance in antibody response after
one year post vaccination, perhaps indicating that immune response in both obese and healthy
weight individuals is similar in the beginning stages post-vaccination and may deteriorate faster
in obese individuals.
Additionally, our study found no statistical significance between the fold changes of
healthy weight and obese individuals (see Figure 2). Of note, however, is that the fold change
for healthy weight individuals pre-to-post vaccination was 1.50 compared to 0.73 for obese
individuals. Although not significant, we observe a general trend that healthy weight individuals
are more easily able to increase their antibody titer compared to that of obese individuals. This is
consistent with previous studies that show potentially compromised immune responses from the
and obese individuals such as low-grade chronic inflammation and insulin resistance, we had
hypothesized that the obese immune response would be relatively diminished.
Next, we compared fold change of HAI titer in metformin users versus non-metformin
users, and also found no significant difference with a p-value of 0.867 (Figure 4). From this
data, we conclude that metformin does not alter antibody titers in type 2 diabetes patients;
metformin treatment does not increase one’s ability to mount a better antibody response. Finally,
we compared the HAI titer of metformin users from Day 0 (pre-vaccination) to Day 30
(post-vaccination), alongside non-metformin users over the same time period. There was no difference
among metformin users and non-metformin users from pre-vaccination to post-vaccination
(p-value 0.463), similar to the healthy weight and obese comparison from Figure 3. Likewise, this
insignificant data could be since the time period from pre-to-post vaccination is only 30 days.
Importantly, the HAI titers of individuals that were using metformin treatment and those
who were not, regardless of whether it was pre- or post-vaccination, were higher than those who
were not, with a p-value of 0.0119 (see Figure 5). Although the vaccination does not seem to
improve the antibody response for metformin users more than the non-metformin users as seen
by the insignificance in fold change, we do observe that metformin users at baseline have a
higher HAI titer than those not using metformin. This supports the idea that metformin has
positive effects on immune response; because of higher antibody levels, metformin users may be
able to build a more effective immune response than those not using metformin. This points to
potential benefits of using metformin rather than other drugs to treat type 2 diabetes; further
investigation on the cellular functions and downstream effects of metformin and the potential
There are many limitations that we faced in the study that prevented us from getting
optimal results. A small sample size of 23 individuals may have kept us from observing other
major changes between the association of obesity and diminished immune response, as well as
the effect of metformin use on boosting immune response. During data analysis, we attempted to
compare all four groups: diabetic and obese individuals using metformin, diabetic and healthy
weight individuals using metformin, diabetic and obese individuals not using metformin, and
diabetic and healthy weight individuals not using metformin. However, doing so diluted the
sample size in each group tremendously; there were only three individuals who were diabetic and
healthy weight not using metformin. As such, we were not able to effectively compare each
group and look for potential differences and stronger associations in immune response based on
metabolic and medication status.
Secondly, our study was limited by the availability of samples at various time points
post-vaccination; the only blood draw we had available after initial vaccination was after 30
days. Previous studies have shown that obese immune response to infection is diminished
12-months post-vaccination (Sheridan et. al. 2012); future studies may focus on obtaining serum
samples at various time points at 3 month intervals in order to investigate the time period at
which the obese immune response diminishes compared to the healthy weight response.
Knowing the relative time point of diminishing immune response may be critical to effectively
administering the influenza vaccine each year; if people are vaccinated too early in the influenza
Citations
Decensi, A., Puntoni, M., Goodwin, P., Cazzaniga, M., Gennari, A., Bonanni, B., & Gandini, S. (2010). Metformin and Cancer Risk in Diabetic Patients: A Systematic Review and Meta-analysis. Cancer Prevention Research,3(11), 1451-1461. doi:10.1158/1940-6207.capr-10-0157
ELIAKIM, ALON et al. “Reduced Tetanus Antibody Titers in Overweight Children.” Autoimmunity 39.2 (2006): 137–141. PMC. Web. 15 Apr. 2017.
Molinari, N. A., I. R. Ortega-Sanchez, M. L. Messonnier, W. W. Thompson, P. M. Wortley, E. Weintraub, and C. B. Bridges. "The annual impact of seasonal influenza in the US: measuring disease burden and costs." Pub Med. U.S. National Library of Medicine, 28 June 2007. Web. 15 Apr. 2017.
Monteiro, Rosário, and Isabel Azevedo. “Chronic Inflammation in Obesity and the Metabolic Syndrome.” Mediators of Inflammation 2010 (2010): 289645. PMC. Web. 15 Apr. 2017.
Paich, Heather A. et al. “Overweight and Obese Adult Humans Have a Defective Cellular Immune Response to Pandemic H1N1 Influenza A Virus.” Obesity (Silver Spring, Md.) 21.11 (2013): 2377–2386. PMC. Web. 15 Apr. 2017.
Sheridan PA, Paich HA, Handy J, et al. Obesity is associated with impaired immune response to influenza vaccination in humans. International Journal of Obesity (2005). 2012;36(8):1072-1077. doi:10.1038/ijo.2011.208.
Vaccine Effectiveness - How Well Does the Flu Vaccine Work? (2017, February 15). Retrieved April 27, 2017, from https://www.cdc.gov/flu/about/qa/vaccineeffect.htm
Viollet, Benoit et al. “Cellular and Molecular Mechanisms of Metformin: An
Overview.” Clinical Science (London, England : 1979) 122.6 (2012): 253–270. PMC. Web. 20 Apr. 2017.
Weber DJ, Rutala WA, Samsa GP, Santimaw JE, Lemon SM. Obesity as a Predictor of Poor Antibody Response to Hepatitis B Plasma Vaccine. JAMA. 1985;254(22):3187-3189.