A CONTENT ANALYSIS OF NCAA DIVISION I TRACK & FIELD TEAMS’ TWITTER USAGE: DEFINING BEST PRACTICES IN SOCIAL
MEDIA MARKETING
Abigail J. Doran
A thesis defense submitted to the faculty of the University of North Carolina at Chapel Hill in partial fulfillment of the requirements for the degree of Master of Arts in the
Department of Exercise and Sport Science (Sport Administration).
Chapel Hill 2013
Approved by:
Coyte Cooper, Ph. D.
© 2013
Abigail J. Doran
ABSTRACT
ABIGAIL J. DORAN: A Content Analysis of NCAA Division I Track & Field Teams’ Twitter Usage: Defining Best Practices in Social Media Marketing
(Under the direction of Coyte G. Cooper, Ph. D.)
Non-revenue sports face numerous challenges in marketing their programs; thus the need to self-market their program is becoming more essential to grow their fan base
and reach recruits. Social media is an ideal form of communication to reach audiences that do not require any financial resources. This study performed a content analysis of 25
Division I track and field teams with the most Twitter followers to determine primary categories of content and correlation between number of followers and account practices.
Previous research on social media marketing has focused on professional teams,
professional athletes, and athletic departments as a whole; no prior study has analyzed individual collegiate athletic teams. Among other findings, live results were found to be
ACKNOWLEDGEMENTS
I would like to thank my advisor, Coyte Cooper, and my committee members, Sarah Humphries and Jason Mihalik, for their guidance and assistance in this project.
TABLE OF CONTENTS
LIST OF TABLES ... viii
LIST OF FIGURES ... ix ix
Chapter
I. INTRODUCTION ... 1-6
Statement of Purpose ...2 Research Questions ... 2-3
Assumptions ...3 Delimitations ...3 Limitations ... 3-4
Definition of Terms ... 4-5 Significance of the Study ... 5-6
II. REVIEW OF LITERATURE ... 7-18 Sustainability and the Arms Race ... 7-8 The Need for Self-Marketing and Branding ... 8-10
Social Media vs. Traditional Media ... 10-12 What is Twitter? ... 13-15
Sample Selection ... 19-21 Pre-Coding Procedures ... 21-22 IV. MANUSCRIPT ... 23-51
Abstract ...23 Introduction ... 23-29
Sustainability and the Arms Race ... 24-25 The Need for Self-Marketing and Branding ...25 Social Media vs. Traditional Media ... 25-26
What is Twitter? ... 27-29 Method ... 29-32
Sample Selection ... 29-31 Pre-Coding Procedures ... 30-32 Results ... 32-45
Overview ... 31-34 Most Common Forms of Content ... 34-41
Correlation with Athletic Success ... 41-43 Correlation of Retweets/Interactions, Videos,
Photos and Accounts Followers ... 43-45
Discussion ... 46-51 Summary ... 46-49
APPENDICES ... 52-58
Appendix I: Team Twitter Account Data ...52
Appendix II: Coding Protocol for Team Twitter Content Analysis ...53
Appendix III: Tweet Categories ...54
Appendix IV: Coding Sheet ...55
LIST OF TABLES
Tables
1. Randomly Constructed Weeks for Each Month ...21, 31
2. Live Results Tweets ...36
3. Non-Meet Related- Team Breakdown ...38
4. Multimedia- Team Breakdown ...41
5. Final Team Rankings ...43
LIST OF FIGURES
Figure
1. Coding Breakdown ...34
2. Meet-Related Categories- Overall ...35
3. Non-Meet Related Categories- Overall ...37
Chapter 1
INTRODUCTION
Non-revenue sports have historically faced numerous challenges in marketing and
branding their programs in all levels of collegiate athletics. The lack of funding,
manpower and other resources limits what many Olympic sports can do to promote their programs due to the fact that many athletic departments invest heavily in reaching an
extensive audience in sports such as football or men’s basketball. With this being the case, the need to self-market their program is becoming more and more essential in order
to grow their fan base and reach recruits. With the importance of positioning their
product, programs need to keep their eye on potential mediums that allow them to market in a cost efficient manner.
With the advancement and access to technology now, social media is an ideal form of communication to reach a large audience as well as specific targeted audiences
that do not require any financial resources. The number of users accessing the web through their mobile devices has nearly doubled each year since 2009 (Pring, 2012), giving people instant access to phone applications such as Twitter. Many organizations in
the sport industry use social media, and particularly Twitter, to promote their teams and products, as well as simply share information. Since its start in 2006, the social media site
2012). As of February 2012, there were more than 465 million total accounts on Twitter, and the site is growing at a rate of 11 accounts per second, adding up to about 950,400 new accounts per day (Pring, 2012).
Statement of Purpose
The purpose of this study is to perform a content analysis of top Division I track
and field teams (N=25) on Twitter to determine the primary practices that may improve marketing and communication with followers. The teams used in this study are not necessarily the top-25 programs athletically, so understanding the success of teams in
their social media presence as opposed to solely their athletic success will provide the opportunity to apply the results of this study to more teams, particularly those programs
which are not as successful athletically.
Research Questions
Based on a review of related literature, the following research questions were
formed to guide this study:
RQ 1. What forms of content (e.g. videos, pictures, news stories) are most commonly being used by the top 25 teams, defined by their number of Twitter followers, in their marketing efforts via Twitter?
RQ 2. What is the correlation between athletic success (top-25 NCAA finish) of the
program and their number of followers?
RQ 3. What is the correlation between the number of followers of a team and the
following factors?
• Number of photos posted
• Number of retweets/interactions with followers
• Number of accounts the team follows
Assumptions
1. The research methods used in this study are valid and reliable.
2. The Twitter accounts used in this study are the official Twitter accounts for each
team chosen.
Delimitations
1. Accounts of the teams in the top-25 at the time of research are dynamic and
constantly changing in terms of management and number of followers. The top-25
used may not accurately represent other and field Twitter accounts or be the top-25 in terms of followers at the completion of the study.
2. Research done over a one-year period may not be representative of the team’s
success over time on Twitter or in their social media usage.
3. Only 25 teams were chosen for content analysis, which may not accurately
represent the total number of teams with successful social media presence.
4. Twitter is just one of several popular social mediums, and by exclusively studying
teams’ presence on this site may exclude teams successfully using other social
media sites.
5. Only studying Division I programs limits the application of this research to
Division II and Division III, as well as Junior College and NAIA programs.
Limitations
1. Saple results may not be representative of all Division I track and field programs
2. The results of this study may not be completely applicable to Olympic sports other than track and field, and the marketing techniques found to be successful with these teams may not work for other programs in different sports.
Definitions of Terms
1. Tweet: A content post on Twitter, made up of 140 or fewer characters. May not include text; could include just a picture, or video, or URL link to another page. 2. Handle: This is Twitter’s version of a “username.” A handle will have an “@”
sign in front of it (e.g. @GoHeels).
3. Follow: Subscribing to someone’s tweets. When you follow someone, their tweets will show up on the your timeline.
4. Timeline: This is the user’s collected stream of tweets listed in real-time order. 5. Mention: Including someone else’s handle in your tweet.
6. Characters: Each tweet can include up to 140 maximum characters. These characters include the “@” in a handle, the “#” in a topic, as well as spaces and punctuation marks.
7. Reply: A tweet posted in reply to someone else’s tweet.
8. Profile: A Twitter page displaying information about a user, as well as the Tweet that they post from their account, including Retweets.
9. Hashtag: The symbol “#” marks a keyword on Twitter, making it a link and becoming a searchable topic.
11. Trend: A topic used with a hashtag can start trending when used enough. These trending topics are real time popular topics on Twitter from all users, not just those you follow. Trends can refer to worldwide trends or by city.
12. Retweet: Forwarding another tweet by someone else to all of your own followers. 13. Follow Friday (#FF): Twitter users use this hashtag to signify their suggestion of
people who others should follow; this is done on Fridays.
14. New Media: A broad term to define all that is related to the Internet and interplay between technology and images. The definition is evolving over time.
15. Traditional Media: Also referred to as 'old media', this sort of media includes vehicles introduced before the use and advent of the internet, such as magazines, books, newspapers, and radio and television broadcasts.
Significance of Study
This study provides insight into techniques used by a selection of 25 NCAA
Division I track and field teams’ Twitter accounts. Determining practices used by the 25 teams with the most followers of all Division I track and field teams on Twitter will be
beneficial in helping teams with fewer followers improve their presence on Twitter and potentially other social media sites. Research has been done on social media usage in athletics, but these studies have primarily focused on professional athletics and the usage
of Facebook; there have been no studies prior to this one done on the usage of Twitter by individual collegiate athletic teams.
This study is essential for teams to understand practices that will improve
to market their programs to recruits and fans alike, and the results of this study will make those efforts more effective. With budget constraints hitting a majority of NCAA athletic departments and the individual athletic teams in those departments, staff and financial
resources are decreasing across the board. This in turn means marketing techniques that use limited financial resources and manpower are much more in demand than ever before.
Chapter 2
REVIEW OF LITERATURE
Sustainability and the Arms Race
College athletics have increasingly become more commercialized in terms of financial decisions over the past 20 years (Southall & Nagel, 2008), emphasizing profit more than ever. Traditionally, intercollegiate athletics provide the opportunity to integrate
sport into higher education “so that the educational experience of the student-athlete is paramount” (NCAA, 2010). However, as seen with the arms race and emphasis on
revenue-generation, the current state of intercollegiate athletics counters that position as athletic departments join the “never-ending battle for supremacy, national exposure, and financial awards” (Knight Commission on Intercollegiate Athletics, 2010).
Research done by Daniel Fulks shows a 27 percent increase in expenditures allocated to the two revenue sports, football and basketball, in Football Bowl Subdivision
(FBS) athletics departments (NCAA, 2004). With an increase of spending allocated to these two sports, many non-revenue, or Olympic, sports are facing decreases in their spending allocations if not complete elimination. In a matter of 20 years, between 1988
and 2008, a total of 2,606 teams were dropped across the NCAA, with a net loss of 287 men’s teams at the Division I level (NCAA, 2010). Some examples include Portland
State, which cut their men’s golf team to “chip away at a $225,000 reduction in
$1.1 million out of the athletic department’s budget by eliminating seven teams (Steinback, 2003). With the current economic state of the country and budget issues facing most, if not all, institutions, more cuts are yet to be seen across the organization.
Many athletic programs are facing elimination because of these budget decreases, and others are facing more struggles in maintaining their sustainability at their institutions.
Because of this, “nonrevenue-sport teams will need to enhance their revenue streams to avoid potential budget cuts or program losses” and these programs will need to find new ways to accomplish this, possibly even reaching the point of “adopting a fully endowed
model to remain sustainable” (Cooper & Southall, 2010, p. 2). Previous studies have researched athletic directors’ explanations for program elimination and have found that
marketing does affect program sustainability. Cooper and Weight (2011) researched wrestling program discontinuations decisions and found that the sport popularity and fan
support were two factors athletic directors considered. “It is becoming the economic
reality for programs that traditionally generate a negative cash flow to actively seek fan and donor support for the program in order to ensure its position as a sport offered by the athletic department” (2011, p. 68). They further wrote that using creative promotional strategies can increase support at the grassroots level and “provide a strong case for enhanced fan loyalty among” these fans (2011, p. 70).
The Need for Self-Marketing and Branding
With decreases in revenue support, other channels to promote athletic programs
social media sites are growing in popularity as a means of marketing and communication in collegiate sports. Limited budgets may mean fewer media guides, team posters or schedule cards printed, and these forms of promotion are being substituted for less
expensive forms of promotion. Mirna Bard, a social media consultant, speaker, author and instructor of social media at the University of California at Irvine, writes of her own
experience in marketing with social media:
As an entrepreneur… I do not have the budget to reach a global audience through traditional channels for even one hour. By putting some effort into social media
marketing with virtually no budget, I’ve built global presence that allows me to engage with my audience and nurture relationships with worldwide clients and
prospects for the lifetime of my business (2011, para. 7).
Different from length requirements found in newspapers or magazines, the Internet offers endless space for news and feature stories, as well as extended
opportunities for photo, video and audio content. Paul Farhi writes of Twitter: “Its speed and brevity make it ideal for pushing out scoops and breaking news to Twitter- savvy
readers” (2009, p. 28). While some social media sites, such as Twitter, set guidelines on the number of characters in a particular message, repeated messages can be posted, allowing still for more marketing and communication opportunities. While there is
essentially unlimited space online, the need for producing content that the program’s audience is interested in still exists. In turn, “as coaches build their online fan database,
online marketing and communication efforts is still vital so as to publish quality and effective products.
Determining effective marketing techniques is essential to promote one’s program
and attract more support. Audiences utilizing social media sites such as Twitter may not be looking for the same thing as audiences reading a newspaper, or watching the 5
o’clock news segment, and thus Cooper (2009) and Ross and James (2004) made the point that it’s essential to identify primary motivational preferences so that nonrevenue coaches are able to invest their time and energy in marketing-based initiatives that grow
their product starting at the grassroots level. Social media sites may attract younger audiences, but locking in their support as young fans could lead to a solid number of
life-long supporters for the program. Cooper (2009) made the point that it’s critical for nonrevenue-sport teams to develop marketing strategies to remain sustainable and to enhance consumer interest in their core product in future years.
Social Media vs. Traditional Media
As technology continues to advance, communication channels will continue to
grow and change. New Media, generally referring to Internet-based communication, and in particular the use of social media, are now essential in marketing and communication. The overwhelming increase in the usage of new media has altered the need for traditional
media and the way it is produced, as the “revolution” of new media caused traditional media to lose consistency (Tasente & Ciacu, 2011). Traditional and new media are often
webpages, including athletic department sites and social media sites alike, and other forms of New Media allow for quicker updates on content for audiences than Traditional Media may afford.
Social networking is described as “social systems composed of members and communication channels through which information about new products is transmitted”
(Chatterjee, 2011, p. 82). Wausserman and Faust (1994) further describe social networks as collections of individuals, organizations and events, plus the shared relationships among them. Some examples of social networking sites include, but are not limited to,
Facebook, Twitter, FourSquare, Flickr, Blogger, Jaiku, as well as numerous message boards and blog sites, to name a few. These networks are able to spread information
quicker than traditional forms of media can. As Hambrick (2012) noted, having a large number of followers on Twitter helps users spread information quickly, particularly when their followers retweet the original message to all of their unique followers as well.
Social networks are also an ideal way to reach target markets. Based on the findings of the author’s study, Hambrick wrote, “Sport consumers rely on online social networks to
receive and share information, and their heightened popularity almost dictates that organizations use them to reach current and prospective consumers” (2012, p.. 32). Mark Briggs, who runs the journalism school at the University of California-Berkeley, said that
social networks such as Twitter provide a way “of bridging the gap with them [followers]
and being more engaged with them” (Fahri, 2009, p. 29). Further, Cooper writes, “The
effective use of new media provides athletic departments with a channel to communicate
In addition to being considerably less expensive to produce content online as opposed to in print or on television, social media offers the audience an opportunity to
interact with the source of content. As Jayaram K. Iyer writes,“Social media has
challenged conventional marketing techniques… so the new mantra is ‘engage the consumers” (2012, para. 6). Readers can comment and respond back and forth on sites
such as Facebook and Twitter, as well as on message boards and blog sites. These outlets, which allow increased engagement with fans and users, can help improve on the
relationship between the university or athletic program with their audience, and thus help
build a larger fan base, and improve their brand image.Shama Kabani, the CEO of The
Marketing Zen Group, a social media and digital PR firm, writes that, “While excellent
and innovative products and stellar customer service are key requirements to building a loyal fan base, social-media marketing can help nurture and strengthen budding customer relationships” (2012, para. 1). The increased interaction that social media allows for
elevating the fans’ “status from silent receivers of your information to important partners in a relationship, building connection and loyalty” (Kabani, 2012, para. 3). Sujata
Ramnarayan refers to Twitter as “essentially a free global broadcasting channel” (2012, p.19). Further, Bard writes that traditional marketing is in fact more expensive than new
media marketing strategies, including social media sites like Twitter. “Yes, it takes time,
money, manpower, experience and skill to get a social media program off the ground, but
so does a campaign through traditional channels,” (2011, para. 6). As George
Christodoulides summarizes, sport organizations need to take advantage of these new
media opportunities afforded them if they are to be successful in their future marketing
What is Twitter?
In March of 2011, the College Sports Information Directors of America (CoSIDA) New Media/Technology Committee produced a document explaining the
evolution of the social networking site Twitter. First created in 2006 by Biz Stone, Evan Williams and Jack Dorsey, the social network was called “twttr,” and “began as an
experiment in collective word design” (Sagolla, 2012). The original purpose of the site
was for users to tweet what they were doing at that moment (CoSIDA, 2011), similar to a Facebook status, but the tweet had a maximum of 140 characters. The creator saw the site
as “a venue for fostering conversations – sort of a Reader’s Digest version of Facebook” (CoSIDA, 2011). Hambick further describes the site as a “microblog,” a mini version of a
web log, or blog, which allow users to “record their thoughts, ideas, and opinions while soliciting comments from readers through these online journals” (2012). Users can post results, links to game stories or other pages, short game recaps or highlights,
announcements, pictures or video, or any other original content they wish to share with their followers. Paul Farhi likens tweets to “instant messaging or text messaging, but
one-to-many, instead of one-to-one” (p. 28, 2009).
Users can follow other users they wish to receive updates from, such as other schools’ athletic programs, news sources, conference or other organizations, members of
the university community and fans. Many users retweet messages posted by some of the users they follow, wishing to spread the same information from that source instead of
followers of followers through the online social network” (Li & Du, 2011). Hambrick’s study found that “gaining followers who had more followers early helped spread
information about the events” (2012). Also, additional research has shown that users with
more relationships – followers in regards to Twitter – can serve as relationship hubs for sharing information with a wider range of users (Zhou, Bandari, Kong, Oian,
Roychowdhury, 2010). In addition, the author wrote that providing a variety of messages and varying the content and purpose of messages will help keep users interested and engaged (Hambrick, 2012). However, Hambrick’s study found little
correlation between the number of messages and the number of followers added daily for the accounts studied (2012). This last point is important to note for this research, which
will asses potential reasons the 25 accounts chosen have so many followers.
Now Twitter boasts more than 200 million users with more than 140 million tweets sent per day, or an average of 1,600 per second (CoSIDA, 2011). General Twitter
users engage with the site for a variety of reasons and tweet various forms of content. A recent survey by the CoSIDA New Media/Technology Committee shows that most
members of the organization, primarily those working in sports information/athletic communications at universities and colleges, use the site “strictly as a news channel,” providing fans with a “real-time news fix” (2011). A further study shows that athletic
communication offices manage 62 percent of the Twitter accounts that were reported by members of the organization, with the remaining 38 percent managed by marketing
Now, six years after its creation, Fisher writes that Twitter is now the online social network of choice in the sport industry (2009). As Dorsey wrote in February of 2007, “one could change the world with one hundred and forty characters” (Sagolla,
2009). As our news-hungry society seeks updates quicker and quicker, Twitter is ideal, Farhi says, for an obvious reason: “Its speed and brevity make it ideal for pushing out
scoops and breaking news to Twitter-savvy readers” (p. 28, 2009). In athletics, quick announcements are often needed, such as announcing recruits on signing day, or posting scores and results throughout competitions. Craig Stoltz, a heavy Twitter user and new
media consultant, said that this particular social network “works best in situations where the story is changing so fast that the mainstream media can’t assemble all the facts at
once,” (Fahri, p. 28, 2009), which is often just the case in athletics.
Previous Studies
In terms of this study, and similar research in this field, a content analysis
involves examining messages within sports media, particularly messages posted on Twitter. Several previous content analyses studying media in athletics have been
completed. Pederson (2002) completed a content analysis on the potential influences of
coverage inequality, investigating the amount and type of newspaper coverage given to
female and male high school athletics, the first such study to examine interscholastic athletics. Similarly, Cooper completed a study analyzing gender and individual sport team coverage provided on intercollegiate athletic websites.
“sporting event organizers and influential Twitter users spread information through the online social network.” The findings of a content analysis completed by Greer and Ferugson (2011) examining Twitter sites of local television stations was that interactivity
on Twitter gains followers. They also found that this site can be useful in breaking and communicating news, as opposed to just directing followers to the news broadcast (Greer
& Ferguson, 2011).
Some studies have started examining the content and coverage produced on social media sites. Outside of athletics, McCorkindale completed a content analysis to
determine how the 2008 Fortune 50 companies used Facebook. McCorkindale found that many organizations were not using Facebook to publicize any news or information about
their organization, and that most of these companies could do more to engage and build relationships through their Facebook presence (2008). Naaman, Boase and Lai completed a content analysis of more than 350 Twitter users, examining message content to better
understand the characteristics of social media activity. The authors found that users are generally split into one of two groups, either they are focused on the “self” or focused on
sharing information (2010, p. 192). Bender, Jimenez-Marroquin and Jadad completed a content analysis of breast cancer support groups on Facebook and found that the function of social networking sites “makes them ideally suited for fundraising and
awareness-raising purposes… but may make them less suitable for support-seeking related to topics that are embarrassing or socially stigmatizing” (para. 27, 2011).
many fans appreciate the increased connection with their schools, athletic departments love the fact that social media is an inexpensive approach to marketing and a great way to gather information on its fan base” (para. 12, 2011). Tomko further noted that even with
the increased use of social media to date, some marketing experts say, “Athletic departments have only just begun to scratch the surface with a marketing platform that
won’t be going away anytime soon” (para. 29, 2011). Hambrick, Simmons, Greenhalgh and Greenwell analyzed Twitter use among professional athletes who use Twitter to communicate with fans and other players. The authors found that many of the athletes
studied used the site to communicate directly with their followers and very few were used for promotion, thus determining that “professional athletes may not be taking advantage
of the promotional opportunities Twitter may provide” (Hambrick, et al., 2010, p. 454). This is a significant finding, especially considering that a recent tally by Tweeting-Athletes.com shows that there are at least 6,990 total professional athletes using Twitter,
including 1,783 NFL players, 523 NBA players, 500 MLB players, and 336 NHL players (2012). Martin examined social media usage in the NFL and found that these
professional athletes “are able to use social media to establish a sense of connection, or a ‘relationship,’ with fans that feel almost interpersonal in nature” and this in turn can “develop parasocial attachments to the athletes whom they follow via social media,
resulting in increased identification with, and sometimes more support for, these human brands” (2012, p. 105). Kassing and Sanderson examined how fans experienced the Tour
Chapter 3
METHODOLOGY
This study was conducted as a content analysis of NCAA Division I track and
field programs’ Twitter usage. Content analyses are used in a variety of ways in various
fields, and have been defined several different ways based on past analyses performed.
Riffe, Lacy, and Fico (2005) defined the process as a systematic and replicable
examination of symbols within communication in order to describe the communication, draw inferences about its meaning, or to infer from the communication to its context (p.
25).
Content analyses have been used numerous times to study communication in collegiate athletics and have focused on a wide array of communication outlets (i.e.,
books, magazines, radio, television, Internet) in sport-related research (Cooper, 2007). Specifically, past research has focused largely on the content of three main media outlets:
magazines, newspapers, and the Internet (Kane, 1988; Matheson & Flatten, 1996; Messner, Duncan, & Wachs, 1996), and Cooper (2007) focused on the application of a content analysis methodology to the individual institutional athletic Web pages.
Sample Selection
In order to determine how NCAA Division I athletic teams are using social media,
financial and otherwise, and support from their athletic departments. To determine the top 25 teams, data on numbers of followers for each Division I track and field team was gathered and sorted to determine the top 25 teams. The amount of followers for each
team will continue to increase daily, but the top 25 teams were chosen at the time the data was gathered and remained the subjects of research throughout the study. The teams
determined to have the most followers were from seven different athletic conferences and had varying athletic accomplishments; this was an early indication that team performance was not always a major factor in gaining more Twitter followers.
Once the teams were selected, all messages posted on their Twitter accounts from the time period of July 1, 2011, through June 30, 2012, were compiled into documents for
each team. Using a randomly constructed week for each month (randomly selecting one Monday, one Tuesday, one Wednesday, one Thursday, one Friday, one Saturday and one Sunday in each month), messages from the total compiled data were separated for use in
this study. A randomly constructed week was used in order to eliminate any bias results that could occur from using one seven-day period in each month. Because social media
Table 1
Randomly Constructed Weeks for Each Month
MONTH MON TUES WEDS THURS FRI SAT SUN
July 4 12 20 28 1 9 17
August 1 9 17 25 5 13 21
September 5 13 21 29 2 10 18
October 3 11 19 27 7 15 23
November 7 1 16 24 4 12 20
December 5 13 21 29 2 10 18
January 2 10 18 26 6 14 22
February 6 14 22 2 10 18 26
March 5 13 21 29 2 10 18
April 2 10 18 26 6 14 22
May 7 15 23 31 4 12 20
June 4 12 20 28 1 9 17
Pre-coding Procedures
Prior to analyzing message content, a coding protocol and codebooks were
created to guide two coders involved with the data collection process. Two separate trained coders then participated in intercoder reliability testing to ensure that the pilot
study contained reliability, which is a primary concern in content analysis research (Riffe, Lacy & Fico, 2005). The intercoder reliability testing consisted of two individuals
gathering 5 percent (212 tweets) of the total tweets and coding that sample to the best of their ability. The two coders then coded the tweets independently, but discussed their
reasoning afterwards, ensuring that they were in agreement as to how the different codes apply to the tweets. To ensure reliability, the two coders had to be highly familiar with
the two trained coders was independently providing highly similar results during the data collection and coding process. A similar procedure was performed during the actual data collection and coding process for this study.
In order to eliminate chance, the Adjusted Scott’s Pi statistic was utilized during the study. Craig (1981) explained that Scott (1955) proposed an index of agreement
between two coders that takes into account both the observed proportion of agreement and the proportion that would be expected by chance. Therefore, the Scott’s Pi formula eliminates the probability that coders will provide the same results by chance. In order for
a content analysis to contain reliability, Riffe et al. (2005) explained that a percent of chance agreement must be at least 80% and the Adjusted Scott’s Pi must be at least .70.
As illustrated by Riffe, Lacy, and Fico (2005), the results of this pilot coding test must be above the acceptable ranges of 80% for percentage of chance agreement (p. 147) and .80 for Adjusted Scott’s Pi (p. 151) for the study to contain reliability. These
acceptable ranges help establish that the coders are familiar with familiar with both the codebook and coding protocol for this test. After running the intercoder reliability test,
Scott’s Pi was found to be .943, greater than the minimum of .70, which confirmed agreement between the two coders. Following the independent analysis of 5 percent of tweets for intercoder testing, the remaining tweets for all programs used were divided
CHAPTER 4
MANUSCRIPT
Non-revenue sports have historically faced numerous challenges in marketing and
branding their programs in all levels of collegiate athletics. With this being the case, the need to self-market their program is becoming more and more essential in order to grow their fan base and reach recruits. With the importance of positioning their product,
programs need to keep their eye on potential mediums that allow them to market in a cost efficient manner. Social media is an ideal form of communication to reach a large
audience as well as specific targeted audiences that do not require any financial resources. The purpose of this study was to perform a content analysis of top Division I track and field teams (N=25) on Twitter to determine the primary practices that may improve
marketing and communication with followers. The teams used in this study are not necessarily the top-25 programs athletically, so understanding the success of teams in
their social media presence as opposed to solely their athletic success will provide the opportunity to apply the results of this study to more teams, particularly those programs which are not as successful athletically.
The research questions that guided this study were: (1)What forms of content (e.g.
videos, pictures, news stories) are most commonly being used by the top 25 teams,
followers of a team and the following factors: a) Number of photos posted, b) Number of videos posted, c) Number of giveaways offered, and d) Number of teams they follow.
Sustainability and the Arms Race
College athletics have increasingly become more commercialized in terms of financial decisions over the past 20 years (Southall & Nagel, 2008), emphasizing profit
more than ever. Traditionally, intercollegiate athletics provide the opportunity to integrate sport into higher education “so that the educational experience of the student-athlete is paramount” (NCAA, 2010). However, as seen with the arms race and emphasis on
revenue-generation, the current state of intercollegiate athletics counters that position as athletic departments join the “never-ending battle for supremacy, national exposure, and
financial awards” (Knight Commission on Intercollegiate Athletics, 2010).
Many athletic programs are facing elimination because of budget decreases, and others are facing more struggles in maintaining their sustainability at their institutions.
Because of this, “nonrevenue-sport teams will need to enhance their revenue streams to avoid potential budget cuts or program losses” and these programs will need to find new
ways to accomplish this, possibly even reaching the point of “adopting a fully endowed model to remain sustainable” (Cooper & Southall, 2010, p. 2). Previous studies have researched athletic directors’ explanations for program elimination and have found that
marketing does affect program sustainability. Cooper and Weight (2011) researched wrestling program discontinuations decisions and found that the sport popularity and fan
support were two factors athletic directors considered. “It is becoming the economic
and donor support for the program in order to ensure its position as a sport offered by the athletic department” (2011, p. 68).
The Need for Self-Marketing and Branding
With decreases in revenue support, other channels to promote athletic programs must be used. The Internet offers simple and inexpensive means to market individual
programs, and social media sites are growing in popularity as a means of marketing and communication in collegiate sports. The Internet offers endless space for news and feature stories, as well as extended opportunities for photo, video and audio content. Paul
Farhi writes of Twitter: “Its speed and brevity make it ideal for pushing out scoops and breaking news to Twitter- savvy readers” (2009, p. 28). Further, “As coaches build their
online fan database, they are afforded with the opportunity to deliver online content that will enhance loyalty among targeted consumers” (Cooper & Southall, 2010, p. 8).
Social Media vs. Traditional Media
As technology continues to advance, communication channels will continue to grow and change. New Media, generally referring to Internet-based communication, and
in particular the use of social media, are now essential in marketing and communication. The overwhelming increase in the usage of new media has altered the need for traditional media and the way it is produced, as the “revolution” of new media caused traditional
media to lose consistency (Tasente & Ciacu, 2011).
Social networks are able to spread information quicker than traditional forms of
ideal way to reach target markets. Based on the findings of the author’s study, Hambrick wrote, “Sport consumers rely on online social networks to receive and share information, and their heightened popularity almost dictates that organizations use them to reach
current and prospective consumers” (2012, p. 32). Mark Briggs said that social networks such as Twitter provide a way “of bridging the gap with them [followers] and being more
engaged with them” (Fahri, 2009, p. 29).
In addition to being considerably less expensive, social media offers the audience
an opportunity to interact with the source of content. As Jayaram K. Iyer writes, “Social
media has challenged conventional marketing techniques… so the new mantra is ‘engage the consumers” (2012, para. 6). Readers can comment and respond back and forth on
sites such as Facebook and Twitter, as well as on message boards and blog sites. These outlets, which allow increased engagement with fans and users, can help improve on the relationship between the university or athletic program with their audience, and thus help
build a larger fan base and improve their brand image.Shama Kabani, the CEO of The
Marketing Zen Group, a social media and digital PR firm, writes that, “While excellent
and innovative products and stellar customer service are key requirements to building a loyal fan base, social-media marketing can help nurture and strengthen budding customer relationships” (2012, para. 1). The increased interaction that social media allows for
elevating the fans’ “status from silent receivers of your information to important partners
in a relationship, building connection and loyalty” (Kabani, 2012, para. 3). As George
Christodoulides summarizes, sport organizations need to take advantage of these new
media opportunities afforded them if they are to be successful in their future marketing
What is Twitter?
First created in 2006 by Biz Stone, Evan Williams and Jack Dorsey, the social network was called “twttr,” and “began as an experiment in collective word design”
(Sagolla, 2012). The original purpose of the site was for users to tweet what they were
doing at that moment (CoSIDA, 2011), similar to a Facebook status, but the tweet had a
maximum of 140 characters. The creator saw the site as “a venue for fostering
conversations – sort of a Reader’s Digest version of Facebook” (CoSIDA, 2011). Users can post results, links to game stories or other pages, short game recaps or highlights,
announcements, pictures or video, or any other original content they wish to share with their followers. Paul Farhi likens tweets to “instant messaging or text messaging, but
one-to-many, instead of one-to-one” (p. 28, 2009).
Users can follow other users they wish to receive updates from, such as other schools’ athletic programs, news sources, conference or other organizations, members of
the university community and fans. Many users retweet messages posted by some of the users they follow, wishing to spread the same information from that source instead of
posting the content themselves. Posting and retweeting messages causes content to spread to more users than just one accounts’ followers, facilitating “information sharing among Twitter users as information spreads from one Twitter user to her followers to her
followers of followers through the online social network” (Li & Du, 2011). Hambrick’s study found that “gaining followers who had more followers early helped spread
correlation between the number of messages and the number of followers added daily for the accounts studied (2012).
Now Twitter boasts more than 200 million users with more than 140 million
tweets sent per day, or an average of 1,600 per second (CoSIDA, 2011). General Twitter users engage with the site for a variety of reasons and tweet various forms of content. A
recent survey by the CoSIDA New Media/Technology Committee shows that most members of the organization, primarily those working in sports information/athletic communications at universities and colleges, use the site “strictly as a news channel,”
providing fans with a “real-time news fix” (2011). A further study shows that athletic communication offices manage 62 percent of the Twitter accounts that were reported by
members of the organization, with the remaining 38 percent managed by marketing departments. In addition, close to half of the reporting schools had separate accounts for individual sports at the school in addition to one main account for the athletic department
as a whole (CoSIDA, 2011).
Now, six years after its creation, Fisher writes that Twitter is now the online
social network of choice in the sport industry (2009). As Dorsey wrote in February of 2007, “one could change the world with one hundred and forty characters” (Sagolla, 2009). As our news-hungry society seeks updates quicker and quicker, Twitter is ideal,
Farhi says, for an obvious reason: “Its speed and brevity make it ideal for pushing out scoops and breaking news to Twitter-savvy readers” (p. 28, 2009). In athletics, quick
the story is changing so fast that the mainstream media can’t assemble all the facts at once,” (Fahri, p. 28, 2009), which is often just the case in athletics.
Method
This study was conducted as a content analysis of NCAA Division I track and field programs’ Twitter usage. Content analyses are used in a variety of ways in various
fields, and have been defined several different ways based on past analyses performed.
Riffe, Lacy, and Fico (2005) defined the process as a systematic and replicable
examination of symbols within communication in order to describe the communication,
draw inferences about its meaning, or to infer from the communication to its context (p. 25).
Content analyses have been used numerous times to study communication in collegiate athletics and have focused on a wide array of communication outlets (i.e., books, magazines, radio, television, Internet) in sport-related research (Cooper, 2007).
Specifically, past research has focused largely on the content of three main media outlets: magazines, newspapers, and the Internet (Kane, 1988; Matheson & Flatten, 1996;
Messner, Duncan, & Wachs, 1996), and Cooper (2007) focused on the application of a content analysis methodology to the individual institutional athletic Web pages.
Sample Selection
In order to determine how NCAA Division I athletic teams are using social media, an initial assessment was done to determine the 25 track and field Twitter accounts with
top 25 teams, data on numbers of followers for each Division I track and field team was gathered and sorted to determine the top 25 teams. The amount of followers for each team will continue to increase daily, but the top 25 teams were chosen at the time the data
was gathered and remained the subjects of research throughout the study. The teams determined to have the most followers were from seven different athletic conferences and
had varying athletic accomplishments; this was an early indication that team performance was not always a major factor in gaining more Twitter followers.
Once the teams were selected, all messages posted on their Twitter accounts from
the time period of July 1, 2011, through June 30, 2012, were compiled into documents for each team. Using a randomly constructed week for each month (randomly selecting one
Monday, one Tuesday, one Wednesday, one Thursday, one Friday, one Saturday and one Sunday in each month), messages from the total compiled data were separated for use in this study. A randomly constructed week was used in order to eliminate any bias results
that could occur from using one seven-day period in each month. Because social media and marketing efforts could differ at various times in each month and throughout the year,
Table 1
Randomly Constructed Weeks for Each Month
MONTH MON TUES WEDS THURS FRI SAT SUN
July 4 12 20 28 1 9 17
August 1 9 17 25 5 13 21
September 5 13 21 29 2 10 18
October 3 11 19 27 7 15 23
November 7 1 16 24 4 12 20
December 5 13 21 29 2 10 18
January 2 10 18 26 6 14 22
February 6 14 22 2 10 18 26
March 5 13 21 29 2 10 18
April 2 10 18 26 6 14 22
May 7 15 23 31 4 12 20
June 4 12 20 28 1 9 17
Pre-coding Procedures
Prior to analyzing message content, coding protocol and codebooks were created
to guide two coders involved with the data collection process. Two separate trained coders then participated in intercoder reliability testing to ensure that the pilot study contained reliability, which is a primary concern in content analysis research (Riffe, Lacy
& Fico, 2005). The intercoder reliability testing consisted of two individuals
independently coding 5 percent of the total tweets in the sample to ensure reliability in
the data collection method. To ensure reliability, the two coders had to be highly familiar with the coding protocol used in the study. The results of this pilot study ensured that each of the two trained coders was independently providing highly similar results during
In order to eliminate chance, the Adjusted Scott’s Pi statistic was utilized during the study. Craig (1981) explained that Scott (1955) proposed an index of agreement between two coders that takes into account both the observed proportion of agreement
and the proportion that would be expected by chance. Therefore, the Scott’s Pi formula eliminates the probability that coders will provide the same results by chance. In order for
a content analysis to contain reliability, Riffe et al. (2005) explained that a percent of chance agreement must be at least 80% and the Adjusted Scott’s Pi must be at least .70. The intercoder reliability testing for this study produced an agreement of 94.3%.
Following the independent analysis of 5 percent of tweets for intercoder testing, the remaining tweets for all programs used were divided between the two coders for data
collection, with the head researcher completing 81% of the remaining tweets and the second coder completing 19% of the remaining tweets.
Results
All Twitter messages produced by the 25 Division I track and field teams with the most Twitter followers were gathered from a 12-month period (July 2011- June 2012). To
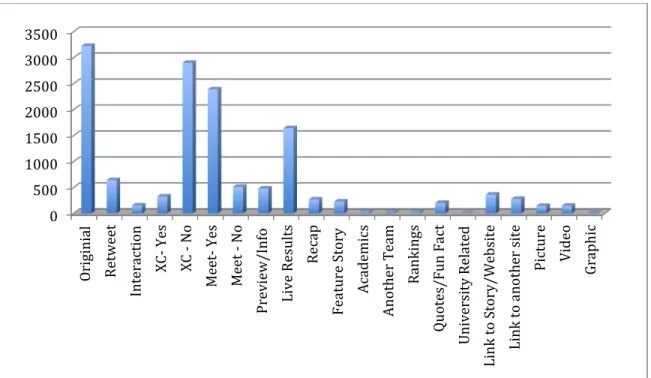
ensure a reliable sample, a number generator was used to obtain a random week (7 days) within each month during the time frame. In total, there were 4,015 tweets that were collected from all of the teams in the 12 random weeks, and these tweets were analyzed
and coded based on seven main categories and 22 subcategories (see Appendix I). Under the meet related category, there were three subcategories: preview/information, live
to another website, picture, video or graphic. A tweet could have more than one
additional link coding, e.g. a picture and a link to their website, or a video and a link to another website.
Only original, track-related Tweets were analyzed for this study. Data on quantities of non-original and cross country related Tweets were gathered for
informational purposes and to determine how common Tweets in these categories (cross country, re-tweets and interaction) were used. Based on the coding procedure described in Appendix II, if the Tweet was determined to be original content and not relating to
cross country, the message was then determined to be either meet related or non-meet related. All cross country related tweets were filtered out in order to focus only on track
and field related tweets.
For the correlation analyses determining the relationship of the factors to the number of followers, a Spearman rho correlation was employed. Values were calculated for each category across all 25 teams to determine which were the most common forms of content. Of the 4,015 Tweets studied, 3,223 had original content (80.3%), with 89.9% of the original tweets being track and field related, and 10% of the messages relating to cross country Of the non-cross country related tweets, 2,387 (82.4%) were related to a track and field meet while only 511 (17.6%) had non-meet related topics. Once the
Figure 1. Coding Breakdown
Most Common Forms of Content
One of the primary goals of this study was to determine what forms of content were most commonly used by the 25 teams analyzed. Three primary categories emerged
in the coding process (meet related, non-meet related, and additional links), and the results of each category will be discussed in the following sections. The top three forms
of content most commonly used by the 25 teams studied were all meet related: live results, preview/information, and recaps.
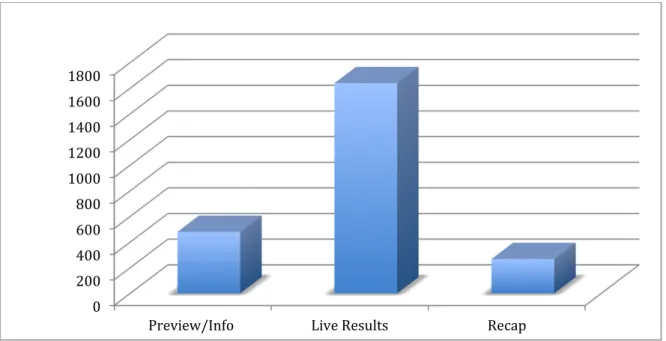
Meet-Related Categories. Figure 2 shows the breakdown of the three meet-related categories, of which live results were by far the most common. Further, as Table 2 shows, live results during meets were the most common form for all but two teams, Utah
and Air Force. Twenty-four teams had about 20% or more of their original content tweets as live results. Texas A&M had the most live results, as 78.9% of the team’s original
0 500 1000 1500 2000 2500 3000 3500
Or
igi
ni
al
Retweet
Inter
action XC-‐ Y
es
XC
-‐
N
o
M
ee
t-‐
Ye
s
M
ee
t -‐
N
o
Preview
/Info
Live
R
esu
lt
s
Recap
Fea
tu
re
St
ory
Ac ad emi cs An ot he
r
T
ea
m
Rankings
Quo
te
s/F
un F
act
Universit
y Rel
at
ed
Lin
k
to
St
ory/
W
eb
sit
e
Lin
k
to
an
ot
her
sit
e
Pict
ure
Video
Gra
tweets as live results: Florida State (68.8%), Oklahoma (67.7%), Oregon (65.4%), Florida (63.7%), LSU (62.8%), Miami (58.3%), Texas Women (54.2%), TCU (54.0%), and Kentucky (50%). It’s interesting to note that Texas was the only school in the sample that
had separate accounts for the men’s and women’s teams. Texas Women had a greater percentage of original tweets as live results, while Texas Men had about 7% less with
47.4% live results. The Air Force was the only school did that not produce any live results tweets, which is interesting to note particularly as the team hosts a large men’s indoor track and field meet annually. Although it wasn’t the team’s highest category,
Utah did produce a significant amount of live results tweets for a total of 28.6% of their original tweets.
Figure 2. Meet Related Categories-Overall
0 200 400 600 800 1000 1200 1400 1600 1800
Table 2
Live Results Tweets
Team
Percent of Original
Tweets Studied Other Majority Category
Florida 63.7%
Kentucky 50.0%
Michigan 24.0%
Texas A&M 78.9%
Florida State 68.8%
LSU 62.8%
Wisconsin 38.2%
Texas Men 47.4%
Utah 28.6% 33.7%- Quotes/Fun Facts
Texas Women 54.2%
Oklahoma State 34.4%
Oklahoma 67.7%
Virginia 24.6%
Air Force 0.0% 56.5%- Pictures
Washington 44.0%
Oregon 65.4%
Illinois 29.9%
Iowa State 47.3%
Miami 58.3%
Alabama 42.0%
Penn State 19.4%
Duke 20.0%
Louisville 36.8%
UCF 39.5%
TCU 54.0%
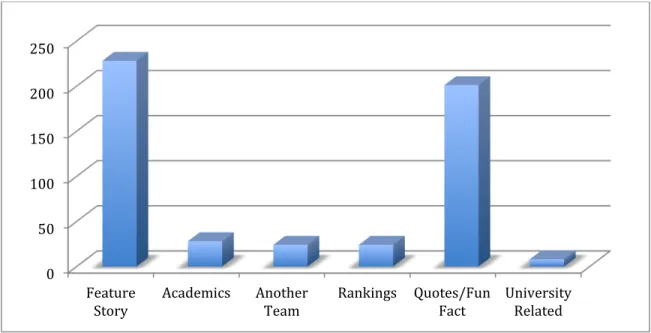
Non-Meet Related Categories. In the non-meet related categories, feature stories were most common with 228 tweets, or 44.4% of the tweets in that category, as Figure 3 shows. Quotes/fun facts were next with 201 (39.2%). This category included quotes of
the day, random or fun facts about the team, and statements regarding the team that were not tied to a feature story or that fell into another category. Academic-related tweets
another team each had 24 for 4.7% each. University-related tweets only came to eight total for all teams, with 1.6%. As mentioned previously, only two teams did not have live results tweets as their most common form of content, Utah and Air Force. Utah’s most
common form of content was “Quotes/Fun Facts” (33.7%), and the Air Force’s most common form of content was “Pictures” (56.5%).
Figure 3. Non-Meet Related Categories – Overall
Further analyses determined LSU and Penn State had the most feature stories, with 32 and 31 respectively, while two teams had no tweets coded as feature stories
(Michigan and Texas Men). Ten additional teams had five or fewer tweets in the feature story category, but 12 teams, including LSU and PSU, had 10 or more feature story tweets. As mentioned, the subcategories of academics, another team and rankings had
less than 30 total tweets across all teams (see Table 3). Nearly two-thirds of the teams had no tweets about another team, indicating little interaction even with other teams at
their school. This may be an opportunity for teams to gain followers of other teams and 0
50 100 150 200 250
Feature
bring more awareness to their athletic department as a whole, which in turn could benefit their program. Nine teams also did not have any tweets relating to academics, while the teams that did each had three or fewer tweets total in this category. As collegiate athletics
continues to stress the importance of balancing athletics and academics, including more tweets related to academics – whether it’s awards-related or not— may be something
teams should consider.
Table 3
Non-Meet Related – Team Breakdown
Team
Feature
Story Academics
Another
Team Rankings
Quotes/ Fun Fact
University Related
Florida 13 3 7 0 22 0
Kentucky 2 0 2 0 1 0
Michigan 0 1 0 0 7 0
TexasA&M 8 0 0 4 2 0
FSU 18 1 0 1 4 0
LSU 32 1 0 3 10 0
Wisconsin 11 1 1 5 8 0
Texas- M 0 0 0 0 1 0
Utah 2 1 4 0 39 2
Texas -W 3 3 0 0 0 0
Ok. State 3 0 0 0 1 0
Oklahoma 13 3 1 3 0 0
Virginia 14 1 2 0 22 3
Air Force 5 0 0 0 2 2
Washington 13 2 0 1 2 0
Oregon 3 0 1 2 11 0
Illinois 12 0 0 1 2 0
Iowa State 5 0 2 0 28 0
Miami (all) 1 1 0 0 7 0
Alabama 11 3 0 1 0 0
Penn State 31 2 0 1 14 0
Duke 11 3 4 1 4 0
Louisville 10 1 0 0 2 1
UCF 3 0 0 1 6 0
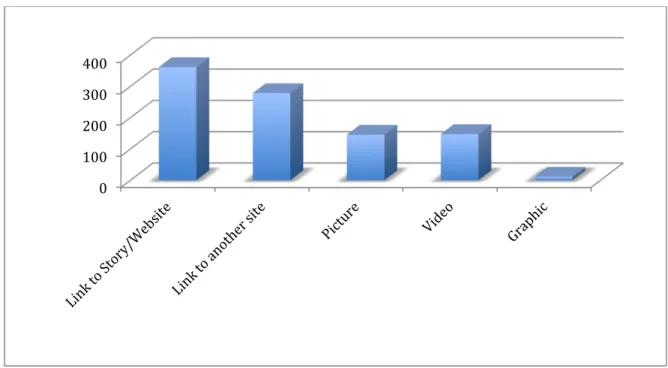
Multimedia Links. Overall, 303 tweets included some form of multimedia content, as Figure 4 shows. Of these tweets, 147 (48.5%) included video, 145 (47.9%) included pictures, and 11 (3.6%) included a graphic. The most common forms of
additional links were: links back to the team website; pictures; and links to another website. A total of 361 tweets linked back to the team’s website while 278 tweets
provided a link to another website.
Figure 4. Additional Links
Photos and videos were the most popular of the multimedia facts listed previously.
Of the tweets studied, 147 included a video and 145 included a photo. Wisconsin (17), Virginia (16), Miami (15), Utah (14) were the leaders in numbers of photos tweeted. It
was interesting to find that four teams (Kentucky, Florida State, Iowa State and Duke) all did not post any photos in the tweets studied. Five teams other teams did not post any videos (Michigan, Texas Men, Texas Women, Air Force and Washington). Florida had
the most videos, with 21, while Florida State (20) and Penn State (17) also had quite a few videos. LSU (13) and Wisconsin (11) were the only other two teams with more than 10 videos. Overall, Penn State had the most photos (17) and videos (17) combined. This
school, however, was lacking in interaction with fans and followers, as the account had only one retweet and five tweets at or in response to followers.
It was interesting to see how many teams had no interaction with their followers, i.e. did not retweet or tweet in response to or at a follower at all. As Table 4 shows, three teams (Air Force, Washington and Alabama) had no interaction at all, and 10 teams had
less than 10 interactions with followers (Kentucky, Michigan, Florida State, Texas Men, Texas Women, Oklahoma State, Iowa State, Penn State, Louisville and TCU). Oregon
by far had the most interaction with followers, with 280 retweets and 27 tweets at or in response to followers. Two other teams had more than 100 total retweets and interactions. Florida had 95 retweets and 12 interactions, and Wisconsin had 42 retweets with 59
Table 4
Multimedia- Team Breakdown
Team
Retweets/
Interactions Photos Video
Florida 107 0 21
Kentucky 7 0 8
Michigan 1 5 0
Texas A&M 25 1 1
Florida State 1 0 20
LSU 26 6 13
Wisconsin 101 17 11
Texas Men 4 2 0
Utah 39 14 1
Texas Women 3 1 0
Oklahoma State 6 2 1
Oklahoma 14 3 5
Virginia 37 16 4
Air Force 0 13 0
Washington 0 5 0
Oregon 307 8 2
Illinois 25 3 5
Iowa State 2 0 22
Miami (all) 40 15 2
Alabama 0 4 3
Penn State 6 17 17
Duke 17 0 6
Louisville 7 2 3
UCF 13 4 1
TCU 3 7 1
Note: Oregon was the only team to have more unoriginal (retweets or interactions) than original tweets. Oregon had 307 unoriginal and 237 original tweets.
Correlation with Athletic Success
hand, eight women’s and 11 men’s teams did not even earn points at the NCAA Championships. The correlation of women’s final NCAA finish and their followers was .7057, and the correlation of men’s final NCAA finish and their followers was .2219.
This indicates a positive, correlation between the two factors. This means strong athletic success does not necessarily cause teams to have more followers. Teams should still
market and communicate their athletic success in order to draw attention to their program and their accomplishments, but team’s with less success should feel encouraged by this minimal correlation in that their lack of success doesn’t mean they can’t still have a high
Table 5
Final Team Rankings
Team Final Rank- Women Final Rank- Men
Florida 12 1
Kentucky NR NR
Michigan NR 33
Texas A&M 2 3
Florida State 14 4
LSU 1 2
Wisconsin NR NR
Texas Men N/A 9
Utah NR NR
Texas Women 11 N/A
Oklahoma State NR NR
Oklahoma 7 NR
Virginia NR 56
Air Force NR 54
Washington NR NR
Oregon 2 9
Illinois 30 11
Iowa State 38 49
Miami 38 NR
Alabama 40 NR
Penn State 29 21
Duke 63 NR
Louisville 50 NR
UCF 19 NR
TCU 30 64
Note: Final rankings are team finishes at the 2012 NCAA Division I Outdoor Track and Field Championships
Correlation of Retweets/Interactions, Videos, Photos and Accounts Followed
how many accounts the team was following all had very small, but positive, R values. The highest correlation was in how many photos were posted (R= .3210), which may indicate this is a form of content followers wish to see. The second highest correlation
was in how many other accounts the team was following (R= .2803), which gave a strong indication that following more accounts can add to one’s followers. This may be true for
several reasons, including creating awareness of the account and showing interest in others’ accounts can lead to more interest in the team’s account. The correlation of number of retweets and interactions was only .0821, and the correlation of the number of
videos posted was just .0436.
Note: All account data gathered in June 2012.
Table 6
Team Follower and Following Data
Team Followers Following
Florida 3,444 107
Kentucky 3,126 329
Michigan 2,084 87
Texas A&M 1,954 241
Florida State 1,816 44
LSU 1,754 362
Wisconsin 1,503 104
Texas Men 1,473 18
Utah 1,382 341
Texas Women 1,279 17
Oklahoma State 1,178 16
Oklahoma 1,071 79
Virginia 1,007 97
Air Force 951 112
Washington 944 49
Oregon 937 223
Illinois 937 98
Iowa State 926 43
Miami (all) 871 380
Alabama 864 29
Penn State 838 156
Duke 814 117
Louisville 785 17
UCF 767 57
Discussion Summary
The purpose of this study was to perform a content analysis of top Division I track
and field teams (N=25) on Twitter to determine the primary practices that may improve marketing and communication with followers. The reason for studying the top 25 teams
in terms of Twitter followers, as opposed to the top 25 teams in terms of final NCAA finish, is that is provided the opportunity to apply the results of this study to teams that aren’t as successful athletically.
The results of this study show that the most common form of content in these 25 teams’ Tweets was by far live results. Only one team, Air Force, did not produce any live
results tweets in the 12-month period studied. Of the remaining 24 teams, about 20% or more of their original content tweets were live results. In addition, only one team had a coding category that was more common than live tweets: Utah had 28.6% live results
tweets but had 33.7% Random facts/Quotes. Given that live results were a major part of all but one team, teams with fewer followers may want to consider incorporating more
live results into their Twitter usage as these teams did. This will engage followers
throughout meets, and is a quick and simple way to increase excitement and attention for the teams and their track and field meets. Since messages are limited to 140 characters,
Twitter is ideal for short and immediate updates throughout the meet. As Fahri wrote, Twitter’s “speed and brevity make it ideal for pushing out scoops and breaking news to
users spread information quicker, particularly when their followers retweet the original message to all of their unique followers as well. A further study could analyze if the person running the Twitter account has an affect on the amount of live results tweets.
Many track and field sports information directors don’t travel with the teams, and if they are the primary person running the account that may cause less live results tweets than if
a coach or team staff member was running the account.
As stated, quotes/fun facts had the most tweets of the non-meet related categories with 200. These tweets were not related to a separate story, but their short statements
provided information, inspiration or just random facts to followers. Although an entire story online may not be necessary, sometimes it is still important to share the information
in these tweets. Hambrick determined from a 2012 study that, “Sport consumers rely on online social networks to receive and share information, and their heightened popularity almost dictates that organizations use them to reach current and prospective consumers”
(2012). Their audience may not read an entire article with the information, but a tweet can provide some of the same information in a quicker, more accessible medium which
consumers rely on.
Another interesting aspect of this study’s results was that the top team 25 finishers at the 2012 NCAA Division I Track and Field Championships were not necessarily the
teams with the most followers on Twitter, indicating that athletic success was not primarily responsible for having more followers. This should encourage teams that may