RISKS, CHALLENGES, TRADEOFFS, AND OPPORTUNITIES IN DYNAMIC, ADAPTIVE WATER SUPPLY SYSTEMS
Harrison B. Zeff
A dissertation submitted to the faculty at the University of North Carolina at Chapel Hill in partial fulfillment of the requirements for the degree of Doctor of Philosophy in the Department
of Environmental Sciences and Engineering in the Gillings School of Global Public Health.
Chapel Hill 2016
Approved by:
Greg Characklis
Patrick Reed
Wally Thurman
Alex Arapoglou
Jackie MacDonald
iii ABSTRACT
Harrison B. Zeff: Risks, Challenges, Tradeoffs and Opportunities in Dynamic, Adaptive Water Supply Systems
(Under the direction of Gregory Characklis)
The rising costs and regulatory burdens associated with new water supply infrastructure
are making it increasingly difficult to meet growing water demands through the development of
new supply capacity. Instead, adaptive techniques such as temporary conservation and water
transfers are playing a larger role in the water supply planning. While adaptive techniques have
many advantages over infrastructure-centric approaches, they also present municipal water
utilities with a number of challenges. This dissertation aims to formulate problems that illustrate
the tradeoffs between multiple management objectives and help utilities meet performance
criteria through the use of novel tools and methods. While this work focuses mostly on a group
of interconnected water utilities in the ‘Research Triangle’ North Carolina, the results are
generalizable to water supply problems across many regional scenarios.
Adaptive techniques like conservation and the purchase of water transfers introduce
substantial and unpredictable reductions in revenue (conservation) and cost increases (transfers).
Municipal water provision is extremely capital-intensive with large, fixed costs driven by debt
service payments. Increased levels of financial risk may affect the ability of a utility to meet
debt service payments, reducing their credit rating and increasing the cost of future borrowing.
Chapter 2 explores the role of financial mitigation tools in drought management strategies
iv
formulations, we show how the tradeoffs between financial risk and several other management
objectives are affected by self-insurance contingency funds and a novel type of third-party index
insurance. Pricing incentives (i.e. drought surcharges) can also serve as a financial mitigation
tool while simultaneously promoting more efficient conservation. Chapter 3 examines how the
additional revenue raised through surcharges may reduce utility incentives to purchase water
transfers, potentially harming overall consumer welfare. In Chapter 4, the short-term
management strategies developed in Chapters 2 and 3 are integrated into a long-term
infrastructure sequencing model. Important interactions between management and planning
decisions are incorporated using an adaptive, risk-based framework. This dissertation
demonstrates how the added complexity involved with developing adaptive decision-making
v
ACKNOWLEDGEMENTS
This research was undertaken with financial support from the National Oceanographic
and Atmospheric Administration’s (NOAA) Climate Office, Sectoral Applications Research
Program (Award No. NA110AS2310144), as well as the National Science Foundation’s Water,
vi
TABLE OF CONTENTS
LIST OF TABLES ... ix
LIST OF FIGURES ...x
CHAPTER 1: INTRODUCTION ...1
1.1 INTRODUCTION ...1
1.2 REFERENCES ...7
CHAPTER 2: NAVIGATING FINANCIAL AND SUPPLY RELIABILITY TRADEOFFS IN REGIONAL DROUGHT MANAGEMENT PORTFOLIOS……… ...11
2.1 INTRODUCTION ...11
2.2 METHODS ...14
2.2.1 Research Triangle Case Study ...15
2.2.1.1 Water Supply Infrastructure in the Research Triangle ...15
2.1.1.2 The Research Triangle Water Supply Model ...17
2.2.2 Problem Formulation ...21
2.2.2.1 Decision Variables ...23
2.2.2.2 Objective Functions ...27
2.2.3 Multiobjective Evolutionary Algorithms ...30
2.2.4 Computational Experiment ...31
2.3 RESULTS ...32
2.3.1 Formulations I and II: Benefits of Utility Cooperation ...32
vii
2.3.3 Constrained Solutions ...37
2.3.4 Individual Solutions ...39
2.4 CONCLUSIONS...43
2.5 REFERENCES ...45
CHAPTER 3: HOW SHORT TERM PRICING EFFICIENCY DISTORTS LONG-RUN UTILITY INCENTIVES ...51
3.1 INTRODUCTION ...51
3.2 THE WELFARE AND REVENUE EFFECTS OF RATIONING BY PRICE AND FIAT ...55
3.3 EMPIRICAL MEASUREMENT...60
3.4 RESULTS ...65
3.5 DISCUSSION ...67
3.6 CONCLUSION ...70
3.7 REFERENCES ...75
CHAPTER 4: INTEGRATING INFRASTRUCTURE DEVELOPMENT, CONSERVATION, AND WATER TRANSFERS INTO ADAPTIVE POLICY PATHWAYS ...75
4.1 INTRODUCTION ...75
4.2 METHODS ...78
4.2.1 Research Triangle Water Supply Model ...79
4.2.1.1 Water Supply Infrastructure in the Research Triangle ...79
4.2.1.2 Streamflow and Demand Projections...82
4.2.1.3 Risk-of-failure triggers...85
4.2.2 Problem Formulation ...87
viii
4.2.2.2 Objective Functions ...92
4.2.3 Parallel and Self-Adaptive Evolutionary Multiobjective Optimization ...98
4.2.4 Computational Experiment ...99
4.3 RESULTS ...100
4.3.1 Objective value tradeoffs: Benefits of Utility Cooperation ...100
4.3.2 Probabilistic Decision Pathways ...104
4.4 DISCUSSION ...110
4.5 CONCLUSIONS...111
4.6 REFERENCES ...113
CHAPTER 5: CONCLUSIONS AND FUTURE DIRECTION ...118
APPENDIX 1: MODEL SOURCE CODE ...124
ix
LIST OF TABLES
Table 1. Model objectives………..21
Table 2. Problem formulations……….……….22
Table 3. Model decision variables……….23
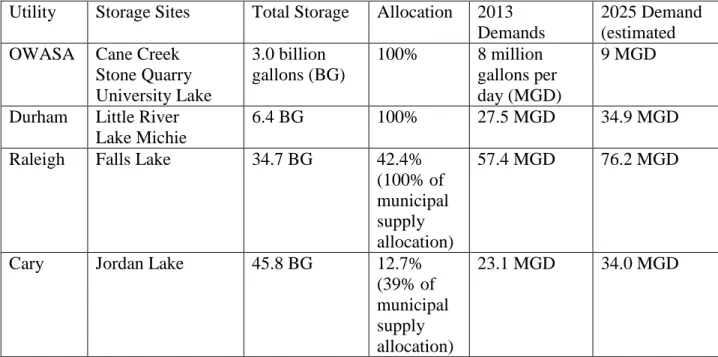
Table 4. Storage capacities and demand growth for the four ‘Research Triangle’ water utilities………..33
Table 5. User group characteristics during drought……….………..62
Table 6. Potential new infrastructure options in the Research Triangle………82
Table 7. Decision variables………89
Table 8. Model objectives………..94
x
LIST OF FIGURES
Figure 1. Water supply infrastructure in the Research Triangle region of North Carolina, including the service areas of the four water utilities (Durham, Raleigh, Cary, and OWASA), surface water reservoirs, water treatment plants,
and regional treated water conveyance interconnections………...16
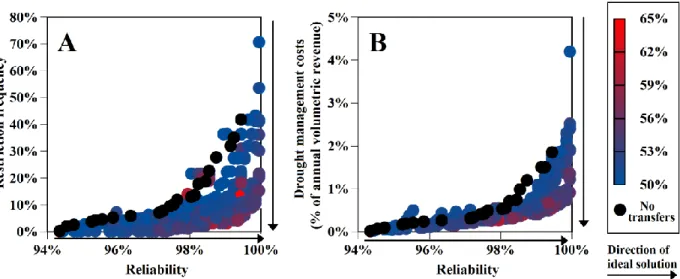
Figure 2. Tradeoffs between performance objectives reliability and restriction frequency (2A) as well as reliability and drought management costs (2B) for
different total Jordan Lake allocations (color).………...………...34
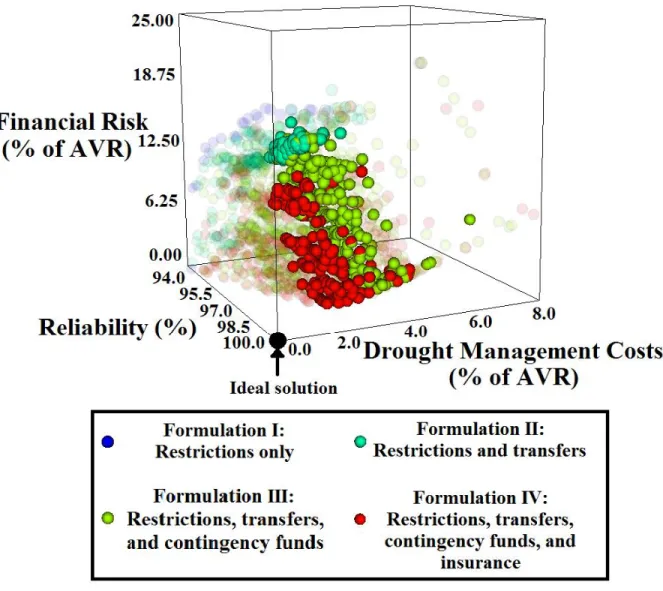
Figure 3. Three-dimensional tradeoffs between reliability, drought management
costs, and financial risk for each of the four problem formulations………...……...36
Figure 4. Three dimensional tradeoffs between reliability, drought management costs, and financial risks, with solutions that do not meet utility constraints
(>99.0% reliability, <20% restriction frequency) ‘greyed-out’……….……39
Figure 5. Parallel axis plot of the five performance objectives with expected
contingency fund size included as a variable of interest for utilities………...……..41
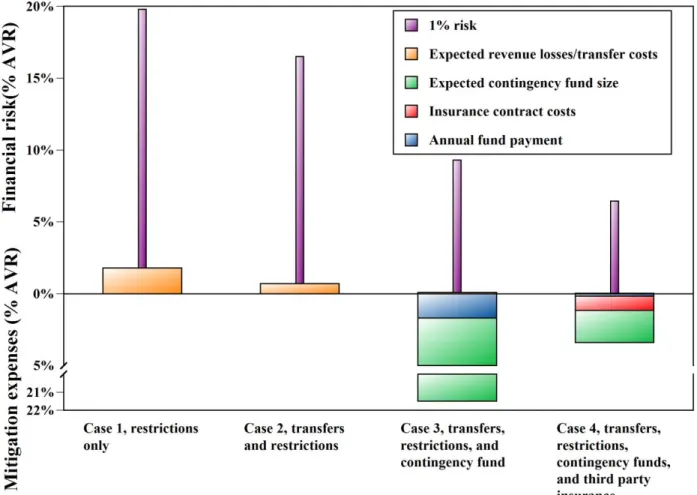
Figure 6. Bar chart showing the makeup of financial risks and mitigation costs
for each of the four portfolio solutions chosen as ‘cases’ from each formulation……….43
Figure 7. Lost utility revenue and consumer surplus resulting from reductions in consumption from mandatory restrictions on outdoor use and from consumption
reductions caused by drought surcharges to indoor and outdoor use………....56
Figure 8. Transfer of consumer surplus to utility revenue when consumption reductions
are caused by surcharges only and surcharges AND mandatory use restrictions………...58
Figure 9. Lost consumer surplus from foregone use, lost utility revenue, and transfer of consumer surplus to utility revenue when surcharges and mandatory restrictions
are used to achieve a given quantity of consumption reduction for a single use type…..……….59
Figure 10. Surplus losses and utility revenue losses ($/kgal) compared to transfer
costs, as a function of the portion of reductions attributable to surcharges………...…66
Figure 11. Map of the Research Triangle study area, showing service areas for Raleigh, Durham, Cary, and OWASA; nine surface water reservoirs; six water
treatment plants, and regional interconnections between water distribution systems………...…80
Figure 12. Relationship between long-term infrastructure planning and short-term
utility operations…...………...………..87
xi
threshold is reached, a construction period begins, after which the development
pathway moves to a new infrastructure state (expansion of Lake Michie - large)……….……...91
Figure 14. Example infrastructure development pathways for Durham and Raleigh, without utility cooperation on infrastructure development and with
utility cooperation on infrastructure development………..………...…92
Figure 15. Objective values for all solutions in all three formulations, objective values for solutions that meet utility requirements (reliability > 99%, worst case cost overruns < 10%, and restriction frequency < 20%), and objective values for
a single representative solution from each formulation.……….……….102
Figure 16. Solutions that meet utility requirements (reliability > 99%, worst case cost overruns < 10%, and restriction frequency < 20%), as a function of peak
financing costs and Jordan Lake allocation……….104
Figure 17. Probabilistic policy pathways under weak cooperation.………107
1
CHAPTER 1: INTRODUCTION
Traditionally, urban water supply management strategies have involved maintaining large
volumes of infrequently used capacity as a hedge against a particularly long or severe drought
(Gleick, 2003). However, the construction of large dams in the United States has been on the
decline for several decades (Lehner, 2008; Avakyan and Iakovleva, 1998), and new
infrastructure projects are faced with rising development costs and lengthy environmental
permitting processes (Scudder, 2005). It will be difficult for water utilities to keep pace with
continued demand growth in urban centers around the world solely, or even primarily, through
the development of new capacity (Postel, 2000, Gleick and Palaniappan, 2010; Vorosmarty et al.,
2000; Falkenmark, 1999). Instead, many utilities are transitioning towards a ‘soft-path’ for water
management, augmenting infrastructure development with a combination of conservation
programs (temporary and long-term) and efforts to allocate existing supplies more efficiently
(e.g. water transfers) (Lund and Israel, 1995; Wilchfort and Lund, 1997; Jenkins and Lund, 2000;
Jaber and Mohsen, 2001; Zarghami, 2010; Rosenberg et al., 2008). Diversified portfolios of
water supply alternatives provide greater adaptability to non-stationary hydrologic conditions
with less development at lower cost (Characklis et al., 2006; Kirsch et al., 2009; Kasprzyk et al.,
2009; Kidson et al., 2013), but they also introduce new challenges for an industry that has
historically been dominated by relatively predictable, infrastructure-centric solutions.
A majority of water utility costs are fixed, attributable to debt-service payments and
maintenance obligations for large infrastructure assets (Tiger, 2000). Revenue is generated
2
imposing an inherent tradeoff between revenue stability (fixed portion) and an incentive for users
to conserve (volumetric portion) (Mohayidin et al., 2009). Water rates are regulated and
typically set with the objective of cost-recovery, returning revenues that aim to cover the
predominately fixed costs of the utility (Beecher et al., 1994; Bishop and Weber, 1996). The
challenges associated with quickly changing prices constrain utilities in their ability to adapt,
making fluctuations in cost and/or revenue especially burdensome to their budgetary process
(Priest, 1993). Unexpected reductions in revenue (from conservation) or increased costs (from
transfers) can be very financially disruptive to these efforts at cost-recovery. The resulting
financial risk has serious implications for water utilities. Historically, water utility bonds have
been considered to be extremely safe investments and provide utilities with very low borrowing
rates (Leurig, 2012). However, potential risks associated with variability in costs and revenues,
particularly as a result of drought, introduce financial variability that can threaten utility credit
ratings (Fitch, 2011). In addition to reflecting poorly on utility management, credit rating
downgrades result in higher interest rates on utility bond offerings. Even small interest rate hikes
can have an outsized effect on utility budgets because bonds typically have long repayment
periods (20-25 years), and debt service payments make up a large portion of utility costs. These
factors act as a disincentive for utilities to adopt soft-path methods which otherwise have many
advantages.
The first chapter in this dissertation is devoted to illustrating how otherwise
Pareto-optimal water supply portfolios fail to meet utility-elicited performance criteria when they are
evaluated with respect to financial risk. A key contribution of this paper is to show that water
supply portfolios that rely on adaptive measures (e.g. conservation, water transfers) must also
3
utility performance objectives. In addition, results suggest that third-party index insurance can
be successfully used to reduce the annual costs of these financial tools. With respect to financial
mitigation, index insurance contracts are currently used in many industries, such as energy and
agriculture, to transfer weather-based financial risks to a third party (Khalil et al. 2007; Barnett
and Mahul 2007; Martin et al. 2001). Index insurance provides the buyer with payouts when an
observable, independent index (i.e. rainfall, temperature) passes a given threshold (Turvey et al.,
2006; Kellner and Mushoff, 2011). When indices can be identified that correlate well with
weather-based risks, index insurance contracts can be used by a utility to reduce some of the
financial risk. This work also involves the application of a contract based on an index that
accounts for storage and seasonal trends in water demand and hydrology. This contract structure
correlates payouts with the risk-based decisions water utilities make when adapting to drought.
In chapter one, the financial tools used to mitigate swings in revenue and costs are
limited to utility self-insurance (i.e. contingency funds) and third-party index insurance.
However, in some cases, utilities can also employ a set of pre-determined rate hikes (i.e. drought
surcharges) as a response to drought. Chapter 2 examines how drought surcharges can create
financial incentives for utilities to favor either conservation or transfer purchases during drought.
Drought surcharges are compelling to utilities for two reasons: (i) the pricing signals sent to
consumers allow conservation to be distributed more efficiently than with simple restrictions on
water use, like residential irrigation mandates (Sibly, 2006; Grafton and Ward, 2008; Krause et
al., 2003; Woo, 1994), and (ii) relatively inelastic urban water demand (Espey et al., 1997),
means that increased prices can raise revenues and partially compensate for the reduced water
sales attributable to conservation. However, from a system-wide perspective, surcharges may
4
transfers, are available. Conservation is typically viewed by utilities as a ‘more conventional’
response to drought, forming the backbone of most utilities’ drought response plans (OWASA,
2010; Westbrook et al., 2009; Goodwin and Cefalo, 2010; City of Raleigh, 2010). However,
supplies are sometimes distributed unevenly across a region, creating opportunities in which
water-stressed utilities can purchase water wholesale for less than the associated revenue losses
they would suffer as a result of imposing conservation measures. Smaller swings in revenue and
costs during drought could provide utilities with an incentive to make greater use of transfers to
offset some of the need for conservation. The use of drought surcharges can mitigate some or all
of the revenue losses from conservation, providing incentives to stability-seeking utilities to
favor surcharges over transfers, even if this is not in the best interests of their customers. And
although the use of drought surcharges reduces the consumer surplus losses from conservation
relative to using mandated restrictions, these losses can still be larger than the costs of transfers
in an absolute sense. Utilities have no direct way of measuring these losses, however, and the
status quo bias in favor of conservation as a response to drought could lead to surplus being
discounted by utility decision makers. In this way, the use of drought surcharges to promote
conservation has the potential to lead to a divergence between utility financial incentives and
those of their customers during periods of drought. Chapter 2 uses a model of individual water
consumption to estimate the effects of mandated water use restrictions and drought surcharges on
utility revenues and consumer welfare for a single municipal water utility. The results are then
compared with the costs of purchasing transfers from a nearby source with the intent of
describing how drought surcharges, which provide welfare improvements for consumers in the
5
the long term. With less of an incentive to purchase transfers, surcharges could also retard
investment in the infrastructure needed to increase access to transfer sources.
Long-term infrastructure planning has historically been driven by the need to develop
supplies that meet growing demands under even the most extreme conditions. The integration of
adaptive measures into planning processes requires the consideration of a dynamic response to
extreme conditions, and the question of when, what, and how much to build becomes an
increasingly complex problem. Existing infrastructure sequencing frameworks remain limited in
their capability to integrate short-term management decisions (Beh et al., 2014; Beh et al., 2015;
Ray et al., 2012; Mortazavi-Naeini et al., 2014; Kang and Lansey, 2014). Likewise,
management actions are often evaluated in static infrastructure environments (Lund and Israel,
1995; Wilchfort and Lund, 1997; Jenkins et al., 2004; Zarghami, 2010). Chapter 3 introduces a
risk-based method for integrating short-term management and long-term infrastructure
sequencing decisions. Building off the framework for developing dynamic adaptive policy
pathways (Haasnoot et al. 2013), risk-of-failure (ROF) metrics used to assess drought risk are
employed as ‘triggers’ that can be updated as new information about uncertain conditions is
observed. Continually updated metrics allow long-term water supply plans to exhibit ‘dynamic’
robustness by allowing model decisions to respond to changing conditions (Walker et al., 2013).
In this work, the ROF metrics are also able to incorporate the effects of model decisions,
allowing short-term management actions to be influenced as infrastructure development evolves
over the planning period. This gives the framework an explicit, quantitative basis for
adaptation. This link between short- and long-term actions becomes more complex with the
consideration of multiple decision-makers that are connected through shared infrastructure. The
6
regional objectives and to evaluate the benefits of coordinated decision-making in the short- and
long-term that would not be possible under traditional methods.
As urban water demands continue to grow, adaptive management strategies will play a
significant role in future water supply planning. These strategies have the potential to be greatly
beneficial, reducing costs while limiting the impact of development on the environment.
However, the adaptive decision-making process must be informed by an understanding of the
tradeoffs that occur across a significantly expanded objective space. Utility managers must now
decide how balance concerns over issues as disparate as financial risk, consumer welfare, and
regional cooperation. This dissertation provides a number of unique formulations of a traditional
regional water supply problem that attempt to shed light on these tradeoffs. The challenges
facing the four water utilities studied here require novel solutions that could be broadly
applicable in a rapidly urbanizing world with a burgeoning understanding of the growing
7
REFERENCES
Avakyan, A. B., & Iakovleva, V. B. (1998). Status of global reservoirs: The position in the late twentieth century. Lakes & Reservoirs: Research & Management, 3(1), 45-52.
Barnett, B. J. and O. Mahul (2007). Weather Index Insurance for Agriculture and Rural Areas in Lower Income Countries. American Journal of Agricultural Economics, 89(5), 1241-1247.
Beecher, J.A., Mann, P.C., Hegazy, Y., and J.D. Stanford (1994), Revenue effects of water conservation and conservation pricing: issues and practices. National Regulatory Research Institute, Columbus, Ohio, Report 94-18.
Beh, E.H.Y., Dandy, G.C., Maier, H.R., and F.L. Paton (2014). Optimal sequencing of water supply options at the regional scale incorporating alternative water supply sources and multiple objectives. Environmental Modelling and Software, 53, 137-153.
Beh, E.H.Y., Maier, H.R., and G.C. Dandy (2015). Adaptive, multiobjective optimal sequencing approach for urban water supply augmentation under deep uncertainty. Water Resources Research, 51.
Bishop, D.B. and J.A. Weber (1996). Impacts of Demand Reduction on Water Utilites. American Water Works Association, Denver, Colorado.
Boyer, Christopher N., Damian C. Adams, Tatiana Borisova, and Christopher C. Clark, (2012). "Factors Driving Water Utility Rate Structure Choice: Evidence from Four Southern U.S. States." Water Resources Management 26: 2747-760.
Brown, D.J., Heller, W.P., and R.M. Starr (1992). Two-part marginal cost pricing equilibria: existence and efficiency. Journal of Economic Theory, 57(1), 52-722.
Characklis, G., Kirsch, B.R., Ramsey, J., Dillard, K.E., and C.T. Kelley (2006). Developing portfolios of water supply transfers. Water Resources Research, 42 W05403.
City of Raleigh (2010). City of Raleigh’s Water Shortage Response Plan. NCDENR, Department of Water Resources, Raleigh, North Carolina.
Espey, M., Espey, J., & Shaw, W. D. (1997). Price elasticity of residential demand for water: A meta‐analysis. Water Resources Research, 33(6), 1369-1374.
8
Fitch (2011). U.S. Water and Sewer Revenue Bond Rating Criteria. Fitch Ratings, New York, New York. www.fitchratings.com.
Gleick, P. H. (2003). Global freshwater resources: soft-path solutions for the 21st century. Science, 302(5650), 1524-1528.
Gleick, P.H., and M. Palaniappan (2010). Peak water limits to fresh water withdrawal and use.
Proceedings of the National Academy of Sciences, 107(25), 11155-11162.
Goodwin, L., and M. Cefalo (2010). Town of Cary Water Shortage Response Plan. NCDENR, Department of Water Resources, Raleigh, North Carolina.
Grafton, R. Q., & Ward, M. B. (2008). Prices versus Rationing: Marshallian Surplus and Mandatory Water Restrictions*. Economic Record, 84(s1), S57-S65.
Griffin, R.C. (2001). Effective Water Pricing. Journal of the American Water Resources Association, 37(5), 1335-1347.
Haasnoot, M., Kwakkel, J.H., Walker, W.E., and J. ter Maat (2013). Dynamic adaptive policy pathways: A method for crafting robust decisions for a deeply uncertain world. Global Environmental Change, 23(2), 485-498.
Jaber, J.O. and M.S. Mohsen (2001). Evaluation of non-conventional water resources supply in Jordan. Desalination, 136(1), 83-92.
Jenkins, M. W. and J.R. Lund (2000). Integrating yield and shortage management under multiple uncertainties. Journal of Water Resources Planning and Management, 126(5), 288-297.
Jenkins, M.W., Lund, J.R., and R.E. Howitt (2004). Optimization of California’s water supply system: Results and insights. Journal of Water Resources Planning and Management, 130(4), 271-280.
Kang, D. and K. Lansey (2014). Multiperiod planning of water supply infrastructure based on scenario analysis. Journal of Water Resources Planning and Management, 140(1), 40-54.
Kasprzyk, J. R., Reed, P.M., Kirsch, B.R., and G.W. Characklis (2009). Managing population and drought risks using many-objective water portfolio planning under uncertainty. Water Resources Research, 45, W12401.
9
Khalil, A. F., Kwon, H-H, Lall, U., Miranda, M. J. and J. Skees (2007). El Nino-Southern Oscillation-based Index Insurance for Floods: Statistical Risk Analyses and Application to Peru. Water Resources Research, 43, W10416.
Kidson, R., Haddad, B., Zheng, H., Kasower, S., and R. Raucher (2013). Optimising Reliability: Portfolio Modeling of Contract Types for Retail Water Providers. Water Resources Management 27(9), 3209-3225.
Kirsch, B. R., Characklis, G.W., Dillard, K.E., and C.T. Kelley (2009). More efficient optimization of long-term water supply portfolios. Water Resources Research, 45(3), W03414.
Knight, F.H. (1921) Risk, uncertainty, and profit, Houghton Mifflin, Boston, MA.
Krause, K., Chermak, J. M., & Brookshire, D. S. (2003). The demand for water: Consumer response to scarcity. Journal of Regulatory Economics, 23(2), 167-191.
Lehner, B. (2008). GWSP Digital Water Atlas, GRanD Database (V1.0). Available online at
http://atlas.gwsp.org
Lempert, R.J., D.G. Groves, S.W. Popper, and S.C. Bankes (2006). A general analytic method for generating robust strategies and narrative scenarios. Management Science, 52(4), 514-528)
Leurig, S. (2012). Water Ripples: Expanding risks for U.S. water providers. Ceres, Boston, Massachusetts.
Lund, J.R., and M. Israel (1995). Water transfers in water resource systems. Journal of Water Resources Planning and Management, 121(2), 193-204.
Martin, S. W., Barnett, B. J. and K. H. Coble (2001). Developing and Pricing Precipitation Insurance. Journal of Agricultural and Resource Economics, 26(1), 261-274.
Milly, P. C. D., Julio, B., Malin, F., Robert, M., Zbigniew, W., Dennis, P., & Ronald, J. (2007). Stationarity is dead. Ground Water News & Views, 4(1), 6-8.
Mohayidin, G., J. Attari, A. Sadeghi, and A. Hussein (2009). Review of water pricing theories and related models. African Journal of Agricultural Research, 4(13), 1536-1544.
Mortazavi-Naeini, M., Kuczera, G., and L. Cui (2014). Application of multiobjective
optimization to scheduling capacity expansion of urban water resource systems. Water Resources Research, 50, 4624-4642.
10
Postel, S. L. (2000). Entering an era of water scarcity: the challenges ahead.Ecological applications, 10(4), 941-948.
Priest, G.L. (1993). The origins of utility regulation and the theories of regulations debate. The Journal of Law and Economics, 36, 289-326.
Ray, P., Kirshen, P., and D. Watkins (2012). Staged climate change adaptation planning for water supply in Amman, Jordan. Journal of Water Resources Planning and
Management, 138(5), 403-411.
Rosenberg, D. E., Howitt, R. E., and J.R. Lund (2008). Water management with water conservation, infrastructure expansions, and source variability in Jordan. Water Resources Research, 44(11).
Scudder, T. (2005). The future of large dams, Cromwell Press, London, UK.
Sibly, H. (2006). Urban water pricing. Agenda, 13(1), 17-30.
Suero, F. J., Mayer, P. W., & Rosenberg, D. E. (2012). Estimating and verifying United States households’ potential to conserve water. Journal of Water Resources Planning and Management, 138(3), 299-306.
Tiger, M. (2000). Utility financing confusion, NC Currents AWWA-WEA 40, 37-55.
Turvey, C.G., A. Weersink, and S.H. Chiang (2006). Pricing weather insurance with a random strike price: the Ontario ice-wine harvest, American Journal of Agricultural Economics 88, 696-709.
Vorosmarty, C.J., Green, P., Salisbury, J., and R.B. Lammers (2000). Global water resources: vulnerability from climate change and population growth. Science, 289(5477), 284-288.
Walker, W.E., Haasnoot, M., and J.H. Kwakkel (2013). Adapt or Perish: A Review of Planning Approaches for Adaptation under Deep Uncertainty. Sustainability, 5(3), 955-979.
Westbrook, V., Hicks, R., and J. Lim (2009). City of Durham Water Shortage Response Plan. NCDENR, Department of Water Resources, Raleigh, North Carolina.
Wilchfort, O. and J.R. Lund (1997). Shortage management modeling for urban water supply systems. Journal of water resources planning and management,123(4), 250-258.
Woo, C. K. (1994). Managing water supply shortage: Interruption vs. pricing. Journal of Public Economics, 54(1), 145-160.
11
CHAPTER 2: NAVIGATING FINANCIAL AND SUPPLY RELIABILITY TRADEOFFS IN REGIONAL DROUGHT MANAGEMENT PORTFOLIOS
2.1 Introduction
In many regions of the world, development has reached a point where water demand
regularly stresses the limits of available water supply (Gleick and Palaniappan, 2010;
Vorosmarty el al., 2000). Recent studies have advocated for managing through a wide range of
options that reduce the need for the continued expansion of supply-side infrastructure (Gleick,
2003; Kundzewicz et al., 2007; Postel, 2000). To this end, work in the area of integrated water
resource management has explored how adaptive techniques, such as demand management and
water transfers, can be integrated with existing supply infrastructure, often leading to
high-reliability strategies that reduce expected costs relative to supply-side approaches (Lund and
Israel, 1995; Wilchfort and Lund, 1997; Jenkins and Lund, 2000; Jaber and Mohsen, 2001;
Zarghami, 2010; Rosenberg et al., 2008; Padula et al., 2013). Similar research has investigated
the development of diversified ‘portfolios’ of water management ‘assets’ (Characklis et al.,
2006; Kirsch et al., 2009; Kasprzyk et al., 2009; Kidson et al., 2013), with results suggesting the
potential to provide greater adaptability to ‘non-stationary’ hydrologic conditions with less
supply capacity and lower expected costs. Although these more sophisticated strategies provide
important tools to facilitate sustainable water use (Gleick et al., 2009; NRC, 2012), they also
result in highly variable costs and revenues for water utilities (Leurig, 2010). The resulting
12
implement more innovative portfolio-type approaches (Hughes and Leurig, 2013), but mitigating
these financial risks is an area that has received relatively little attention in the literature.
Historically, utility costs have been relatively predictable, with large, fixed costs driven
by debt service payments on infrastructure investments (e.g. reservoirs, treatment facilities)
dwarfing the marginal costs of water provision (Beecher et al., 1994; Bishop and Weber, 1996).
Utility rates have typically been set with the goal of recovering these constant costs (Levin et al.,
2002; ASCE, 2013), but a more diversified supply management portfolio can disrupt this ‘cost
recovery’ model. For example, outdoor use restrictions, while an effective measure against
drought, can significantly reduce water consumption, and thus revenues, leading to budget
shortfalls as costs remain largely unchanged (Leurig, 2010). Similarly, augmenting supply
through the purchase of water transfers can lead to intermittent spikes in cost (Caldwell and
Characklis, 2014). These financial stressors are difficult to manage given their uncertainty in
both frequency and magnitude (Hughes and Leurig, 2013). This can be especially difficult for
water utilities, given their regulated status does not often afford them the flexibility to quickly
raise prices (or ‘rates’) to compensate (Priest, 1993). More diversified supply portfolios have
many advantages, but in order for them to reach their potential, utilities must better understand
and address the tradeoffs between diversification and the consequent financial risks.
Concerns over the financial disruptions associated with the use of transfers and water use
restrictions have recently led to investigations of how utilities might use tools such as pricing
schemes, contingency funds, or financial instruments (e.g., index insurance) to mitigate
variability in costs/revenues (Brown and Carriquiry, 2007; Zeff and Characklis, 2013).
However, integrating these tools into wider water management plans requires consideration of a
13
involved, must be coordinated across multiple regional actors. Water transfers take different
forms depending on the regional institutions governing water (Getches, 1997). For example,
transfers in the Western U.S. are largely ‘paper’ (i.e. administrative) transactions in which rights
to raw, untreated water are exchanged (Hamilton et al., 1999; Michelsen and Young, 1993;
Characklis et al., 1999), while in the Eastern U.S., water transfers primarily occur as the sale of
treated, pumped water between municipalities (Lund, 1988; Getches, 1997; Palmer and
Characklis, 2009). Under these conditions, transfers are constrained not only by the available
supply but also by the physical capacities of treatment and conveyance infrastructure (Reese et
al., 2001; Caldwell and Characklis, 2014). These constraints cause interdependencies in which
the actions of one utility can have unintended effects on others, driving the necessity for a
regional analysis.
This work seeks to develop and evaluate coordinated regional portfolios across the four
primary water utilities in the ‘Research Triangle’ region of North Carolina, one of the fastest
growing metropolitan regions in the United States and currently home to nearly 2 million people
(US Census, 2010). These utilities are attempting to meet projected water demand growth by
integrating water transfers and use restrictions with existing supply capacity. Included in the
portfolios is the consideration of the financial instability inherent to such strategies, as well as
tools for mitigating this instability. Regional portfolios are explored through an evaluation of the
tradeoffs between up to five competing operational and financial objectives, all of which were
identified through consultation with water utility personnel. Although results focus on a
particular region, the study’s themes (e.g., rapid population growth, constrained supply, and
14
(Gleick et al., 2009). As a result, this analysis provides a template for utilities seeking to navigate
the tradeoffs associated with more flexible, portfolio-style management approaches.
2.2 Methods
This study develops regional water management portfolios for the four primary water
utilities in the Research Triangle region of North Carolina. The portfolios are designed to
address tradeoffs between supply and financial risk by augmenting existing supply infrastructure
with various combinations of water use restrictions and inter-utility transfers. Additional
consideration is given to the use of financial instruments for mitigating the resulting instability in
revenues/costs. When restrictions and transfers are combined in adaptive portfolios, it may not
always be straightforward to determine strategies that provide an efficient mix of alternatives or
appropriate levels of financial mitigation. This study builds on prior published efforts that have
evaluated the effects of increasingly complex water supply strategies (Kasprzyk et al., 2009;
Mortazavi et al., 2012) to consider the challenges of meeting regional demands, the severity of
the financial risks associated with alternative management strategies, and the effectiveness of
financial instruments designed to reduce this risk. Drawing on the constructive decision aiding
approach to problem framing (Tsoukias, 2008; Roy, 2010), four water supply portfolio designs
are considered, with each portfolio design representing a problem ‘formulation’ that consider
new portfolio actions available to utilities as well as objectives used for the evaluation of
portfolio performance. The initial formulation serves as a base case that attempts to manage
drought with only existing supply infrastructure and water use restrictions (a typical scenario in
the Eastern U.S.). Through increasingly complex portfolio design, each subsequent formulation
illustrates the effects of demand management, water transfers, and the mitigation of financial
15
coordinated use of shared transfer infrastructure, and Formulations III and IV introduce the use
of two different types of financial tools. The analysis is designed such that lower dimensional
formulations are sub-sets of the higher dimensional formulation, evaluating different possible
frameworks for regional coordination of drought management, as suggested by Kasprzyk et al.
(2009; 2012).
2.2.1 Research Triangle Case Study
2.2.1.1 Water Supply Infrastructure in the Research Triangle
This study focuses on building regional coordination across the four water utilities that
serve the communities of Raleigh, Durham, Cary, and Chapel Hill/Carrboro (served by the
Orange and Water Sewer Authority, or OWASA). The utilities receive water from nine different
surface reservoirs straddling the Cape Fear and Neuse River basins (Figure 1). Most regional
sources are being stressed by growing demands, but the largest regional supply, Jordan Lake, is
significantly underutilized. The U.S. Army Corps of Engineers, which operates the reservoir,
designates a portion of the lake for municipal water supply, which is partially allocated to several
utilities. Cary, which uses Jordan Lake as its sole source of water supply, is allocated 35.5% of
Jordan Lake’s municipal water supply. Durham and OWASA are also granted ‘secondary’
allocations of 10 and 5%, respectively, for use in conditions of scarcity (NCDENR, 2002), but
neither has the infrastructure to directly access Jordan Lake (Figure 1). Raleigh currently has no
allocation. A large portion of Jordan Lake’s municipal water supply remains unallocated, and
state authorities are investigating the potential benefits of granting utilities increased access to
16
Figure 1: Water supply infrastructure in the Research Triangle region of North Carolina, including the service areas of the four water utilities (Durham, Raleigh, Cary, and OWASA), surface water reservoirs, water treatment plants, and regional treated water conveyance interconnections.
Cary is also the only utility that operates a water intake on Jordan Lake, and other utilities
seeking access must do so via the Cary-Apex water treatment plant (WTP), with the treated
water then transferred via a network of ‘interconnections’ (i.e., pipelines). Previous work has
17
utilities (Palmer and Characklis, 2009; Kirsch et al., 2013; Caldwell and Characklis, 2014). The
inclusion of treated water transfers complicates portfolio planning by introducing infrastructure
constraints. The Cary-Apex WTP has a capacity of 56 million gallons per day (MGD), and
risk-based rules for sharing the available treatment capacity among potential buyers are discussed in
previous work (Palmer and Characklis, 2009). Capacity sharing rules are based on a weighted
strategy that assigns a greater share of unused WTP capacity to the purchasing utility with a
greater ‘risk-of-failure’ (ROF), calculated as the probability that a utility’s reservoir storage will
drop below 20% of capacity at any point over the subsequent 12 months using current storage,
historical inflow records, and projected demands. Transfer rates are also constrained by the
conveyance capacities of interconnections between the municipal systems. The Cary system has
a 10 MGD interconnection to Durham’s system and a 10.8 MGD interconnection with Raleigh.
There is no direct connection between the Cary and OWASA systems, but Durham and OWASA
have an interconnection of 7 MGD, forcing Durham and OWASA to share capacity in the
Durham-Cary connection using the same rules governing the shared Cary-Apex WTP capacity.
For technical reasons, OWASA must maintain a minimum output of 3 MGD from its own WTP,
meaning that at least 3 MGD of water consumption must come from its own reservoirs (and not
from Jordan Lake water transfers). Conveyance constraints make the consideration of output
minimums at the Raleigh and Durham WTPs unnecessary.
2.2.1.2 The Research Triangle Water Supply Model
The Research Triangle Water Supply Model (‘model’) uses a Monte Carlo approach to
simultaneously simulate storage levels in all nine regional reservoirs. This approach allows the
model to incorporate detailed operations in the linked-reservoir system, such as infrastructure
18
conditions. The model simulates reservoir levels on a weekly timestep, returning probabilistic
results driven by the use of 1,000 distinct, synthetically generated streamflow records. The
weekly timestep minimizes the computational cost while still retaining the ability to closely
approximate changes to reservoir levels during drought. Large storage volumes give utilities a
cushion against short-term variability in streamflow, and a weekly timestep also roughly
correlates to the scale of utility decisions regarding water use restrictions and transfer purchases.
The synthetic streamflow records are developed using a modified ‘Fractional Gaussian Noise’
(mFGN) method that recreates the standard moments, as well as the autocorrelation, observed in
a log-adjusted 80-year historical record (Kirsch et al., 2013). Many standard autoregressive
models make assumptions of complete stationarity and impose constant correlation levels
between each time lag. Changes to evapotranspiration and/or infiltration, critical in determining
the rainfall/runoff relationship in a watershed, may impart seasonal patterns on the
autocorrelation that cannot be adequately recreated using these types of autoregressive models.
The mFGN approach applies the correlation structure observed in a historic record to an
uncorrelated timeseries, and thereby more effectively reproduces the seasonal variation in
autocorrelation required to capture streamflow dynamics, particularly under more extreme
hydrologic conditions (e.g. drought). This approach also allows for the generation of multiple
distinct streamflow records of any length, expanding the range of hydrologic conditions
experienced by the system beyond the historic record.
Streamflow records are generated so the model can be evaluated on a weekly timestep
over the 13-year period from 2013-2025, the minimum period over which the region is expected
19
Weekly municipal water demand is computed considering annual growth and seasonal
trends. Estimated growth in average annual water consumption, driven by expected population
growth, has been provided by all four utilities. Seasonal multipliers, calculated from historical
demand data, are applied to average annual demand projections to replicate intra-annual trends.
Weekly variations from these trends are estimated using joint probability density functions
(PDFs) linking demand and reservoir inflow. Joint PDFs are derived for each utility from
historical data, as described in Zeff and Characklis (2013). Different joint PDFs are used for
irrigation (April-October) and non-irrigation (November-March) seasons.
Synthetic streamflow records, surface evaporation, and consumptive withdrawals are
combined with mandatory reservoir releases and discharges from wastewater treatment plants to
create a water balance allowing for the simulation of water storage levels in each of the nine
surface reservoirs. Because the reservoirs are situated in a linked system, inflows into some
reservoirs and streamflow measured at monitored gauges include natural flows as well as
‘controlled’ flows coming from upstream reservoir releases and wastewater discharges.
Controlled flows are removed from the historical record used in the generation of synthetic flow
records to create records reflective of only natural flows (NCDENR and Hydrologics, Inc, 2009).
Controlled flows from reservoirs and wastewater treatment plants are then added to synthetically
generated streamflows during simulation runs based on the simulated conditions. Mandatory
reservoir releases attributable to agreements with downstream users and environmental
regulators are based on season and downstream flow conditions, while wastewater discharges are
based on utility water use and the individual treatment plant’s recovery factor, as determined
from historical records (NCDENR and Hydrologics, Inc, 2009). Storage models for Durham and
20
Characklis, 2009; Caldwell and Characklis, 2014), and Raleigh’s total water supply (municipal
supply allocation at Falls Lake, Lake Wheeler, and Lake Benson) was validated against model
output from the OASIS model developed by Hydrologics (NCDENR and Hydrologics, Inc,
2009) and used by the North Carolina Department of Environmental Resources (NCDENR) for
planning purposes. Allocations to Jordan Lake, used as a supply source for Cary as well as
transfer sources for Raleigh, Durham, and OWASA, are modeled based on inflow, evaporation,
and consumptive withdrawals only, with each allocation taking (or losing) a proportional amount
of inflow and evaporation. Reservoir releases from Jordan Lake are drawn from a separate
‘Water Quality’ allocation that does not impact municipal supply allocations and are not
modeled.
Each utility’s revenue is estimated based on monthly billing data over the period
2008-2011, which contain consumption patterns by customer class (residential, commercial/industrial,
indoor/outdoor, etc.) and pricing tier. Revenue losses are computed based on the difference
between the potential revenues from unrestricted use and the revenues received when
drought-related restrictions are employed. The utilities primarily employ increasing block fee structures,
but some utilities charge different fees for irrigation, multi-family residential housing, or
connections outside of the city limits. Considering all of these factors, utility revenues are
determined from a weighted average of use across all pricing tiers, which changes according to
seasonal water use patterns. When water use restrictions are triggered, this weighted average
also changes based on the distribution of use reductions among the price tiers. Transfers are
assumed, based on discussions with utilities, to have a constant volumetric price of $3,000 per
21
residential consumer. Durham also charges OWASA an additional ‘wheeling’ fee of $500 per
MG ($0.50/kgal) for water being passed through their system on its way from Cary to OWASA.
2.2.2 Problem Formulation
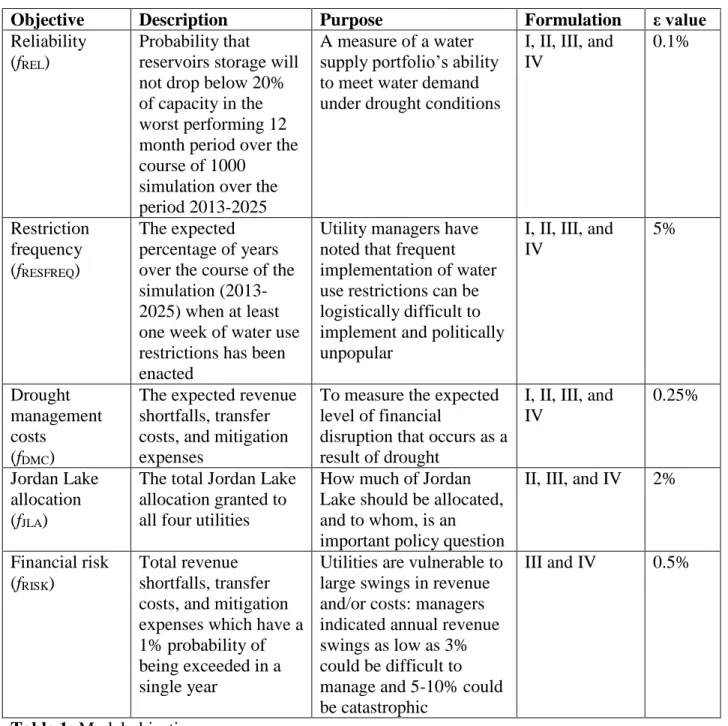
Table 1: Model objectives
Water supply portfolios are designed to explore individual and coordinated regional supply
management decisions that balance tradeoffs between utility objectives. Four distinct portfolio
Objective Description Purpose Formulation ε value
Reliability (fREL)
Probability that reservoirs storage will not drop below 20% of capacity in the worst performing 12 month period over the course of 1000
simulation over the period 2013-2025
A measure of a water supply portfolio’s ability to meet water demand under drought conditions
I, II, III, and IV 0.1% Restriction frequency (fRESFREQ) The expected percentage of years over the course of the simulation (2013-2025) when at least one week of water use restrictions has been enacted
Utility managers have noted that frequent implementation of water use restrictions can be logistically difficult to implement and politically unpopular
I, II, III, and IV 5% Drought management costs (fDMC)
The expected revenue shortfalls, transfer costs, and mitigation expenses
To measure the expected level of financial
disruption that occurs as a result of drought
I, II, III, and IV
0.25%
Jordan Lake allocation (fJLA)
The total Jordan Lake allocation granted to all four utilities
How much of Jordan Lake should be allocated, and to whom, is an important policy question
II, III, and IV 2%
Financial risk (fRISK)
Total revenue shortfalls, transfer costs, and mitigation expenses which have a 1% probability of being exceeded in a single year
Utilities are vulnerable to large swings in revenue and/or costs: managers indicated annual revenue swings as low as 3% could be difficult to manage and 5-10% could be catastrophic
22
‘formulations’, each adding to the drought management options available to utilities, are
evaluated with a suite of up to five objectives. The purpose and explanations of the objective
functions are described in Table 1. The consideration of all five objectives for each of the four
utilities would constitute a 20 objective optimization problem, which is beyond the capabilities
of modern Pareto-ranking based optimization tools (Teytaud, 2006) as well as the cognitive
limits of decision makers (Miller, 1956). An effective strategy of dimensional reduction can be
achieved by reformulating individual objective values into regional portfolio objectives. For
each objective, the regional objective value takes the value of the worst-performing utility,
guaranteeing that all utilities attain an individual objective value equal to or better than the
regional objective value. For example, if the regional reliability objective is 99%, then all four
utilities will have reliabilities equal to or greater than 99% (higher reliability values are better).
The regional objectives reduce the dimension of the multi-city planning problem while
guaranteeing that individual utility solutions converge towards optimally identified objectives
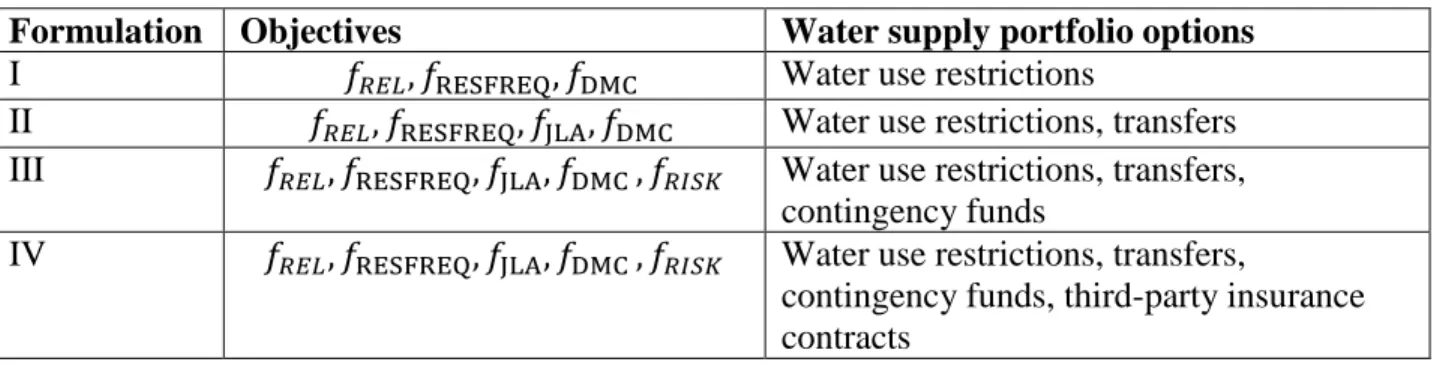
(Woodruff et al., 2013). The problem formulations, with their respective decision variables and
objective functions, are summarized in Table 2.
Table 2: Problem formulations
Formulation Objectives Water supply portfolio options
I 𝑓𝑅𝐸𝐿, 𝑓RESFREQ, 𝑓DMC Water use restrictions
II 𝑓𝑅𝐸𝐿, 𝑓RESFREQ, 𝑓JLA, 𝑓DMC Water use restrictions, transfers
III 𝑓𝑅𝐸𝐿, 𝑓RESFREQ, 𝑓JLA, 𝑓DMC , 𝑓𝑅𝐼𝑆𝐾 Water use restrictions, transfers,
contingency funds
IV 𝑓𝑅𝐸𝐿, 𝑓RESFREQ, 𝑓JLA, 𝑓DMC , 𝑓𝑅𝐼𝑆𝐾 Water use restrictions, transfers,
23 2.2.2.1 Decision Variables
The decision variables in each formulation describe the operational and financial makeup
of each individual utility’s water management portfolio (Table 3). These decision variables are
used to calculate up to five objective functions, such that
F(x) = (fREL, fRESFREQ, fJLA, fDMC , fRISK) (1)
𝐱 = (𝑅𝑖, 𝑇𝑖, 𝐴𝑖, 𝐶𝑖, 𝐼𝑖)
where fREL = utility storage reliability; fRESFREQ = frequency of the implementation of water use restrictions; fJLA = Jordan Lake allocation; fDMC = expected costs of drought management (revenue losses, transfer costs, and mitigation expenses); fRISK = financial risk (drought management costs reached in highest 1% of simulations); i = utility index (i = 1, 2, 3, 4); R = ROF conditions that trigger water use restrictions; T = ROF conditions that trigger transfer purchases; A = Jordan Lake allocation (% of available capacity); C = funds to be used in ‘self-insurance contingency funds’ to mitigate revenue shortfalls and transfer costs ($); I = inflow conditions that trigger payouts from third party insurance contracts used to mitigate revenue shortfalls and transfer costs
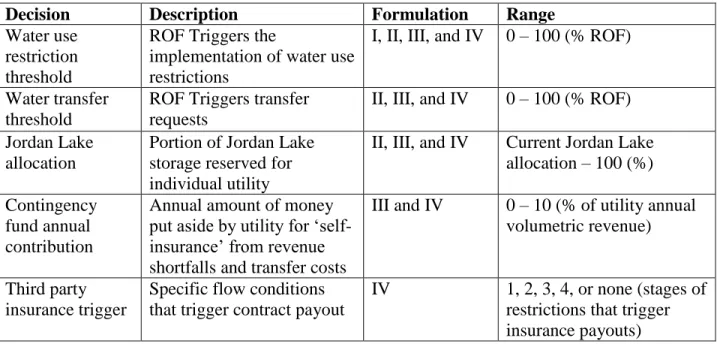
Table 3: Model decision variables
Water use restrictions are used to reduce water consumption below normal demand
levels. The restrictions primarily target outdoor irrigation and commercial/industrial consumers
Decision Description Formulation Range
Water use restriction threshold
ROF Triggers the
implementation of water use restrictions
I, II, III, and IV 0 – 100 (% ROF)
Water transfer threshold
ROF Triggers transfer requests
II, III, and IV 0 – 100 (% ROF)
Jordan Lake allocation
Portion of Jordan Lake storage reserved for individual utility
II, III, and IV Current Jordan Lake allocation – 100 (%)
Contingency fund annual contribution
Annual amount of money put aside by utility for ‘self-insurance’ from revenue shortfalls and transfer costs
III and IV 0 – 10 (% of utility annual volumetric revenue)
Third party insurance trigger
Specific flow conditions that trigger contract payout
24
and are implemented in stages, where larger reductions in overall consumption are expected as
drought conditions worsen. Total consumption reductions during each restriction stage are
assumed to be deterministic in the model and are outlined in ‘Water Shortage Response Plans’
(WSRP) published online by each utility (Orange Water and Sewer Authority, 2010; Goodwin
and Cefalo, 2010; Westbrook et al., 2009; City of Raleigh, 2013). Water use restrictions are
triggered using the ROF metric (ROF ϵ [0,1]), calculated as the probability that a utility’s
reservoir storage will drop below 20% of capacity at any point over the subsequent 12 months.
The ROF metric has been used by utilities in the Research Triangle and is described in detail in
Caldwell and Characklis (2014). When ROF exceeds a specified threshold (e.g., 10%), water
use restrictions are triggered. In order to lift a restriction stage, reservoir storage must reach a
level where the ROF exceeds the trigger for that stage by 5% of total reservoir capacity to avoid
potentially confusing customers by toggling back and forth between stages of conservation.
Transfers are also triggered using the ROF metric. When transfer purchases are initiated,
utilities will continue to purchase transfers until storage in their own reservoirs rises to a level at
which ROF exceeds the trigger threshold. Although transfers of treated water are possible from
any source in the region, all transfer activity in this model originates from Jordan Lake, the only
regional supply with a substantial volume of unused capacity. Transfer water is treated at Cary’s
plant, and moved via interconnections to the purchasing utility. Durham and OWASA currently
have allocations to Jordan Lake, but Raleigh does not. The amount of Jordan Lake water used
for transfer allocations is of interest both as a modeling constraint and a potential policy question
to determine how future allocations could be granted.
If a single utility requests transfers, they will receive as much of their request as possible
25
transfers, infrastructure capacity (both Cary-Apex WTP and conveyance) is divided between the
utilities in proportion to their ROF levels (i.e. high risk translates to more transfers), as described
by Palmer and Characklis (2009). A floor of 25% is placed on the proportion of capacity (either
treatment or conveyance) that is made available to any individual utility. One benefit of the
simulation approach used here is the ability to capture the dynamics involved with a number of
users sharing a source with variable capacity constraints.
Lost revenue from restrictions and the increased costs arising from transfers are
dependent on the length and severity of drought conditions, and the resulting financial impact in
any given year can grow quite large under conditions of extreme drought. Utilities can take
advantage of different options to mitigate this financial risk, including drought surcharges,
contingency funds, and third-party financial insurance contracts. A comparative analysis of the
effectiveness of these techniques is performed in Zeff and Characklis (2013). Although
surcharges were evaluated in that work, utility managers have continually expressed pessimism
that surcharges of the order required to maintain financial stability during drought remain
politically infeasible. Consequently, no pricing options were evaluated in this work, limiting the
financial mitigation strategies considered to some combination of (i) self-insurance through
contingency funds and (ii) third-party financial insurance contracts.
Contingency funds are a type of financial mitigation that utilities use to buffer against
financial uncertainties in a variety of areas, some more quantifiable than others, often with a
single ‘reserve’ fund used for multiple purposes. In this case, utilities contribute a portion of
their revenue to build up a contingency fund that can be used to supplement revenues or cover
additional costs in years when restrictions or transfers occur. A utility’s annual fund
26
annual volumetric revenue (AVR). The funds carry over from year-to-year, and unused funds
are assumed to accumulate 5% interest annually. Constant annual fund contributions are
attractive to utilities from a budget planning perspective, but it is important to note that
maintaining a fund large enough to mitigate the worst-case financial impacts requires annual
contributions significantly greater than the expected value of drought-related variability in costs
and/or revenues. If contingency funds are not designed with extreme conditions in mind,
extended droughts or a succession of dry years could draw down a fund more quickly than
expected and leave the utility financially vulnerable.
An alternative form of mitigation is third-party financial insurance, in which utilities pay
a third party an upfront fee (i.e. ‘premium’) in exchange for a payout when specified (drought)
conditions prevail. Insurance contracts based on streamflow indices are described in previous
work (Zeff and Characklis, 2013) and use reservoir inflows and estimates of reservoir
withdrawals to estimate reservoir storage. When storage estimates drop below the contractually
specified threshold, payouts are made to the utility. These contracts are structured such that
payouts are higher in years when drought conditions are worse and revenue shortfalls from
restrictions are larger, effectively transferring the financial risk from the utility to a third party
insurer. In exchange, the third-party charges a price for the contract equal to the expected value
of the contract, plus a risk/return premium based, at least in part, on the volatility of the contract
payouts (Alaton et al., 2002; Cao and Wei, 2004). By basing contract payouts on storage
‘threshold’ levels, the contracts are easily scalable to provide mitigation against different levels
of financial risk (Zeff and Characklis, 2013). Contracts can be used alone or in combination with
contingency funds as ‘hybrid’ schemes. Hybrid schemes allow utilities to insure against extreme
27
against lesser, more frequent variations in costs/revenues using a contingency fund. By
removing the need to both keep funds on hand in preparation of extreme events and pay a third
party to insure against smaller, more frequent financial risks, utilities can reduce the size of their
contingency funds and the overall cost of third party contracts. These hybrid schemes have the
potential to lower the overall costs of mitigation compared to either individual strategy without
sacrificing exposure to the financial implications of diverse water supply portfolios.
2.2.2.2 Objective functions
Each objective function is calculated from the results of 1,000 different 13-year
(2013-2025) simulations. All four problem formulations are evaluated with respect to at least three
objectives, reliability (fREL), restriction frequency (fRESFREQ), and drought management costs
(fDMC). Formulation II introduces a fourth objective to evaluate regional Jordan Lake allocations
(fJLA), and Formulations III and IV include a fifth, measuring exposure to financial risk (fRISK).
All five objectives were developed in consultation with utility personnel, who also provided
input on constraints for some objectives, beyond which portfolio solutions would be unlikely to
be implemented. These constraints included (i) portfolio reliability over 99% and (ii) restriction
frequency under 20% (enacting restrictions less frequently than one year in five). Although they
did not identify absolute constraints on financial risk, they also identified that (iii) revenue
losses/additional cost of over 10% of AVR in a single year could place an extremely large
burden on the budgetary process.
The reliability objective is measured as the probability that reservoir storage will reach the
‘failure point’ described in ROF calculations (< 20% supply capacity). In the simulation,
demand is modeled to increase over time commensurate with population growth, causing a
28
reliability value is calculated for each 12-month period over the course of the simulation. The
reliability objective value for each utility is determined to be their least reliable year over the
course of the simulation, such that
max fREL= min
j [min (y ∑
Vi,j,y
1000)
1000
i=1 ] (2)
where V = 0 if there was a week in a given year of a particular simulation where reservoir storage drops below 20% of capacity and 1 if not; y = year index, y = 1, 2, 3…13; i = simulation run index, i= 1, 2, 3, …, 1000; j = utility index, j = 1, 2, 3, 4.
Utilities have also expressed a need to control the frequency with which restrictions are
implemented to minimize the burden placed on consumers and avoid measures that are
unpopular with the public. Restriction frequency is defined as the fraction of years that will have
at least one week of restrictions over the course of the simulation, such that
min fRESFREQ = max
j [∑ ∑
Ui,j,y
13*1000 13
y=1 1000
i=1 ] (3)
Where U = 1 if there was a week in a given year of a particular simulation where water use restrictions were implemented and 0 if not
Drought management costs refer to the expected financial impact of all non-infrastructure
water portfolio assets, including revenue losses from restrictions, transfer costs, contingency
fund contributions, and third party insurance contract costs. Although these costs are relatively
small compared to the large, fixed costs which dominate utility budgets, drought management
costs are a measure of the expected financial variability resulting from drought management
efforts, plus any mitigation costs. Revenue losses from restrictions and transfer costs are not
counted as drought management costs if there are sufficient mitigation funds (i.e. contingency
fund accumulation, insurance contract payouts) to cover the financial losses. For more
29
calculated each year as a percentage of a utility’s annual volumetric revenue (AVR). Annual
values are then averaged over the course of the entire 13-year simulation, such that
min 𝑓𝐷𝑀𝐶= max
𝑗 {∑ ∑
𝐴𝐶𝑖,𝑗,𝑦+𝐶𝐶𝑖,𝑗,𝑦+max(𝑅𝐿𝑖,𝑗,𝑦+𝑇𝐶𝑖,𝑗,𝑦−𝐶𝑃𝑖,𝑗,𝑦−𝐶𝐹𝑖,𝑗,𝑦,0)
13∗1000∗𝑇𝑅𝑖,𝑗,𝑦
13 𝑦=1 1000
𝑖=1 } (4)
Where AC = annual contribution to a contingency fund ($); CC = insurance contract cost ($); RL = revenue losses from water use restrictions ($); TC = transfer costs ($); CP = insurance contract payout ($); CF = available contingency funds ($); and TR = total annual volumetric revenue ($)
Although all problem formulations include a drought management cost objective, some of the
terms drop out of (4) in Formulations I-III. Formulation I does not include transfers or any form
of mitigation, removing the terms TC, AC, CC, CF, and CP. Formulation II includes transfer
costs, but the financial mitigation terms (AC, CC, CF, and CP) are unused. Formulation III adds
mitigation, but only self-insurance through contingency funds, leaving out the terms CC and CP.
Formulation IV includes all terms as described in (4).
Formulations II-IV include transfers between municipalities, and an additional objective, Jordan
Lake allocations, is introduced to measure how much of Jordan Lake will collectively need to be
allocated to utilities in support of transfers. The unallocated portion of Jordan Lake’s water
supply pool is of interest as state regulators must soon make a decision regarding potential
increases to allocations allotted to regional municipalities. Due to this focus on the unallocated
portion of Jordan Lake, an objective is created to account for the minimum Jordan Lake
allocations necessary to support a given volume of transfers by summing the four individual
utility’s Jordan Lake allocations, such that
30
Where A = Jordan Lake allocation (MG) and CL = the municipal water supply capacity of Jordan Lake (MG)
In Formulations III and IV, water management portfolios include financial risk mitigation in the
form of contingency funds (Formulation III) and/or third party insurance contracts (Formulation
IV). To quantify the effect of this mitigation on financial variability, an additional objective
function is used to measure utility exposure to financial risk. Financial risk refers to the
single-year drought management costs that have a 1% probability of being exceeded over a 13-single-year
simulation period. In financial literature, this is sometimes referred to as Value-at-Risk (VaR),
calculated as
min fRISK = max
j {(SYCi∶ P{SYCi > SYC} = 0.01)j} (6)
Where SYC is a modified version of (4) that calculates the largest single-year cost over the course of an individual 13 year simulation, such that
SYC𝑖,𝑗 = max
𝑦 (
𝐴𝐶𝑖,𝑗,𝑦+𝐶𝐶𝑖,𝑗,𝑦+max(𝑅𝐿𝑖,𝑗,𝑦+𝑇𝐶𝑖,𝑗,𝑦−𝐶𝑃𝑖,𝑗,𝑦−𝐶𝐹𝑖,𝑗,𝑦 ,0)
𝑇𝑅𝑖,𝑗,𝑦 ) (7)
2.2.3 Multiobjective Evolutionary Algorithms
Tradeoffs between the planning objectives identified in this work are evaluated using a
multiobjective evolutionary algorithm (MOEA) that returns the Pareto-approximate (or
non-dominated) set of solutions. MOEAs have been applied to a variety of complex water resources
engineering problems (Nicklow et al., 2010), with specific applications to, among others,
groundwater monitoring (Kollat and Reed, 2006; Wu et al., 2005; Reed and Minsker, 2004),
water resource system design (Farmani et al., 2005; Suen and Eheart, 2006), and hydrologic
model calibration (Tang et al., 2006; Efstratiadis and Koutsoyiannis 2010). This study makes
use of the Borg MOEA (Hadka and Reed, 2012; Hadka and Reed, 2013; Hadka et al., 2013),