Shortest paths through synonymous genomes
Martijn Zuiddam and Helmut Schiessel
Institute Lorentz for Theoretical Physics, Leiden University, Niels Bohrweg 2, 2333 CA Leiden, the Netherlands
(Received 27 April 2018; revised manuscript received 11 December 2018; published 30 January 2019)
The elasticity of the DNA double helix varies with the underlying base pair sequence. This allows one to put mechanical cues into sequences that in turn influence the packaging of DNA into nucleosomes, DNA-wrapped protein cylinders. Nucleosomes dictate a broad range of biological processes, ranging from gene regulation, recombination, and replication to chromosome condensation. Here we map base pair sequences onto graphs and use shortest paths algorithms to determine which DNA stretches are easiest or hardest to bend inside a nucleosome. We further demonstrate how genetic and mechanical information can be multiplexed by studying paths through graphs of synonymous codons. Using this method we find that nucleosomes can be placed by mechanical cues nearly everywhere on the genome of baker’s yeast (Saccharomyces cerevisiae).
DOI:10.1103/PhysRevE.99.012422
I. INTRODUCTION
The geometrical and mechanical properties of DNA double helices depend on their underlying base pair (bp) sequences. Certain bp combinations lead to intrinsically curved DNA and other combinations to DNA that is stiffer or softer than average. This allows for a second layer of information to be written along DNA molecules in addition to the classical layer, the genes that encode for the proteins.
An important biological consequence of sequence-dependent DNA mechanics is its impact on the positioning of nucleosomes that sequester a large fraction of eukaryotic DNA (e.g., 3/4 for humans). Each nucleosome consists of 147 bp of DNA wrapped almost two times around a globular octamer of histone proteins leading to a DNA spool of about 10 nm in diameter [1]. The wrapped piece of DNA is about one persistence length long; thus bending energies are sub-stantial [2]. As a result, nucleosome stability greatly depends on sequence-dependent differences in the elasticity and shape of the wrapped DNA double helix. In addition, the DNA molecule mainly makes contact with the histone octamer via its backbones [1], which are chemically independent of its bp sequence. All this suggests that the affinity of a sequence to be part of a nucleosome is mainly reflected by the ease with which the DNA can be wrapped into a nucleosome. The total number of possible affinities is huge: there are 4147∼1088 distinct DNA sequences that could be part of a nucleosome.
The sequence-dependent affinity leads to a nonrandom positioning of nucleosomes along genomic DNA. This can be clearly seen by reconstituting nucleosomes on long DNA from their pure components via salt dialysis and then producing nu-cleosome maps using genome-wide assays that extract DNA stretches which were stably wrapped in nucleosomes (see, e.g., [3]). One determines the nucleosome occupancy at each bp position, which is the probability that the corresponding bp is covered by a nucleosome. There are two types of nu-cleosome positioning along DNA: rotational and translational positioning [4]. Rotational positioning is caused by the fact that a given DNA stretch is typically not intrinsically straight due to the intrinsic geometries of the involved bp steps. This
causes a preference for the nucleosome to sit in a certain orien-tation on the DNA, i.e., it prefers a set of positions 10 bp apart (as the histone binding occurs via the DNA backbones and DNA is a helix with an about 10 bp periodicity). Translational positioning is caused by DNA stretches that have overall a higher affinity for nucleosomes. This correlates well with their GC content [5,6].
Histone octamers are known to spontaneously “‘slide” along DNA [7] and therefore to sample different positions, allowing for the equilibration of nucleosomes, at least locally. Two mechanisms have been suggested, and both are based on thermally induced defects in the nucleosome: single bp twist defects (an extra or a missing bp) [8,9] and 10 bp bulges [10,11]. New simulation studies [12,13] strongly suggest that both mechanisms occur and that it depends on the underlying DNA sequence which one is preferred for a given DNA stretch.In vivo there are, in addition, chromatin remodelers that use ATP to move nucleosomes along DNA. New experi-ments [14] and simulations [15] suggest that at least some of them actively induce twist defects in the nucleosome. Chro-matin remodellers might help nucleosomes to equilibrate their location along DNA [16] but might also, together with other proteins that compete for the DNA, perturb the intrinsically preferred positioning of nucleosomes [17].
these organisms contain well-positioned nucleosomes around nucleosome-inhibiting barriers. These barriers are spread all over the genome of those organisms, and nearby nucleosomes are not just statistically ordered as in yeast, but instead they are positioned by characteristic patterns of GC- and TA-rich regions. In humans these positioned nucleosomes alone account for about 30% of all the nucleosomes mappedin vivo. The purpose of the current study is to demonstrate the ex-treme malleability of DNA mechanics and geometry allowing for mechanical cues for nucleosomes along the bp sequence. For instance, we demonstrate that such cues can even be mul-tiplexed with classical genetic information. In Refs. [22] and [23] we had already presented some first results for putting mechanical cues on top of genes and for creating special nucleosomes. However, we still missed a fast method to do this systematically. Nevertheless we were able to demonstrate that multiplexing was possible due to the simultaneous occur-rence of three effects: the sequence properties of genomes, the degeneracy of the genetic code, and the plasticity of the mechanical code (see Ref. [22] for details).
In this paper we present a set of methods that allows to find special nucleosomes for any short-range one-dimensional energy or probabilistic nucleosome model. In Sec. II we present our specific model of choice. Then in Sec.III A we demonstrate how for given integerkone obtains theklowest andk highest energy sequences. For DNA molecules longer than 147 bp we construct the deepest possible energy well leading to the best-positioned nucleosome (Sec.III B). Next we modify bp sequences on genes to position nucleosomes al-most everywhere on the yeast genome without modifying the encoded proteins (Secs.III CandIII D). All this is achieved by mapping the corresponding bp sequences on appropri-ately weighted graphs and using a (k-)shortest path algo-rithm. Earlier attempts to obtain lowest-energy nucleosome-positioning sequences [24] or to reposition nucleosomes on a DNA molecule [22] rely on Monte Carlo simulations, which carry serious disadvantages compared to our methods. Such simulations do not allow one to prove which sequences have the lowest or highest energy without evaluating the huge set of all possible sequences. A shortest path algorithm, however, is not only deterministic and exact, but also extremely effi-cient [for example, Dijkstra’s algorithm with Fibonacci heap implementation has a complexity of O(|M| + |N|log|N|), where M and N denote the number of edges and vertices, respectively [25]].
II. MODEL
We showcase our methods by using the recent probabilistic trinucleotide model [26] that was obtained through Monte Carlo simulations of a coarse-grained nucleosome model with sequence-dependent DNA elasticity [22]. In this nucleosome model the DNA is represented by the rigid bp model [27], which treats each bp as a rigid plate, the spatial position and orientation of which are described by six (three translational and three rotational) degrees of freedom. It assumes only nearest-neighbor interactions with a quadratic deformation energy between successive bps. The sequence dependence of the model comes into play because the stiffness and intrinsic shape of a given bp step depend on its chemical identity.
DNA
histone octamer
binding site
FIG. 1. Nucleosome model [22] used to construct the probabilis-tic trinucleotide model [26]. Each rigid plate represents a bp, the locations of the constraints (corresponding to bound phosphates) are shown by beads, two per binding site. The cylinder is a rough representation of the protein core but was not simulated explicitly (except through the binding sites).
The DNA is forced into a superhelix through a set of 28 constraints that represent the 14 binding sites to the histone octamer (see Fig. 1) which were extracted from the nucle-osome crystal structure without introducing free parameters [22]. These constraints correspond to bound phosphates in the DNA backbone (see Ref. [22] for details). This model has been widely tested against experiments, e.g., it successfully predicts relative nucleosome affinities of various sequences [22] (as measured in Refs. [18,28,29]), the rotational po-sitioning rules of nucleosomes [22,30] (see Refs. [18,31]), translational positioning [6] (see Refs. [3,32,33]), sequence-dependent nucleosome breathing [34] (see Refs. [35,36]), and force induced unwrapping [23,37] (see Ref. [38]).
To construct the probabilistic trinucleotide model [26] from the coarse-grained nucleosome model [22] we per-formed a Monte Carlo simulation that randomly mixes confor-mational and sequence moves (mutation Monte Carlo method [22]). With this method we created a large number of high-affinity sequences allowing us to accurately determine the occurrence probabilities of mono-, di-, and trinucleotides along the nucleosomal DNA. The overall probability of a sequence to be part of a nucleosome can then be estimated by a two-step Markov process [26] (see AppendixA). Moreover, the energy cost of wrapping a sequence S of nucleotides Si ∈B= {A, T , C, G}, i=1, . . . , L with L=147, into a nucleosome is given by
E(S)=
L−2
n=1
En(Sn+2, Sn+1, Sn). (1)
The En’s are “conditional” trinucleotide energies (see Ap-pendixA) which serve as weights of our graphs below. We set the energy of the ground state sequence to zero. For convenience we defineEn=0 forn <1 andn > L−2.
III. RESULTS
A. Lowest and highest energy sequences
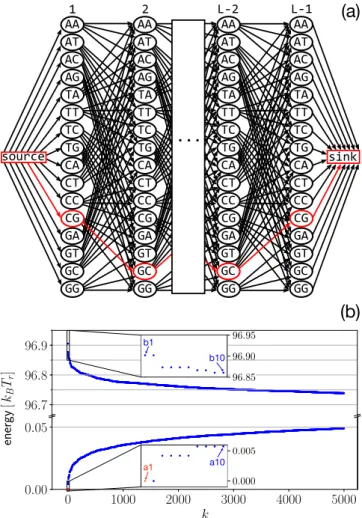
FIG. 2. (a) Graph representation of the 4147DNA sequences that can be wrapped into a nucleosome. Weights are assigned such that each path fromsourcetosinkhas a length equal to the total energy of the corresponding sequence. The path in red (gray in grayscale) corresponds to the ground state sequence a1 from Fig.3. (b) En-ergies of the 5000 cheapest (bottom) and the 5000 most expensive sequences (top). The insets show the 10 best and worst sequences; see Fig.3.
(XY)i for allX, Y ∈B, andi∈ {1,2, . . . , L−1}. We draw the following directed edges (withX, Y, Z∈B): fromsource to (XY)1with weight zero, from (XY)L−1tosinkwith weight zero, and for alli∈ {1,2, . . . , L−2}from (XY)ito (Y Z)i+1 with weightEi(X, Y, Z).
A path fromsourcetosinkcorresponds to a sequence, and its length equals the energy cost of that sequence. Therefore, the lowest energy sequence corresponds to the shortest path from source to sink, which can be found using a shortest path algorithm. Because the graph contains no cycles, the shortest path algorithm can also be used to find the longest path, i.e., the highest energy sequence. Using ak-shortest path algorithm, we can even findk∈N+of the lowest and highest energy sequences. We use Yen’s algorithm with Dijkstra’s as the underlying shortest path algorithm leading to a time complexity ofO(kN(M+N)+NlogN)[39]. The energies corresponding to the 5000 best and worst sequences are shown in Fig. 2(b). They resemble the tails of a Gaussian error function, suggesting that the probability density function of the energies resembles a (somewhat skewed) Gaussian.
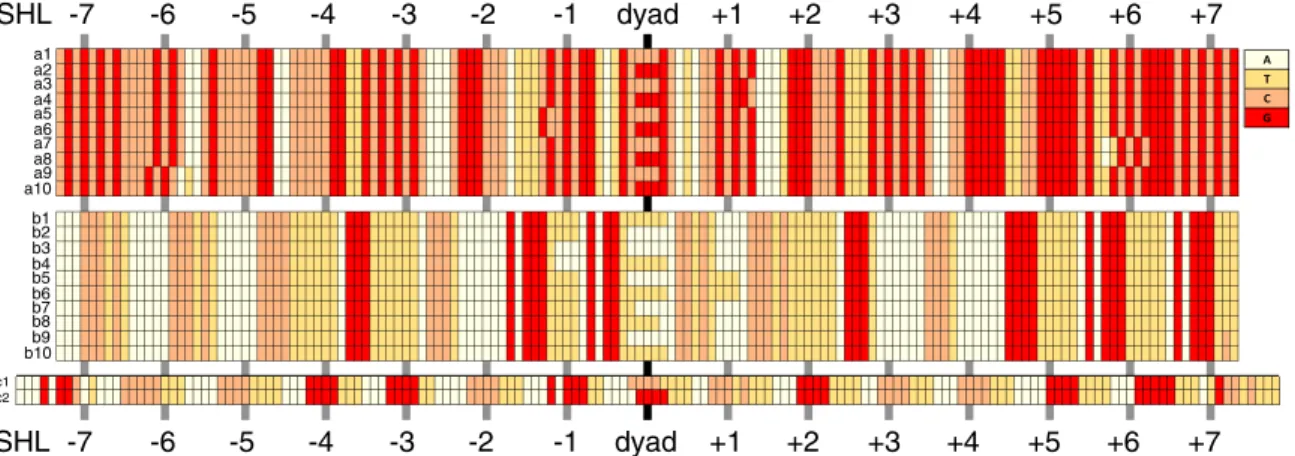
Ten of both the lowest and highest energy sequences are depicted in Fig.3; see also Fig.2(b). BecauseLis odd, there is a bp in the center of the nucleosome leading to two ground state sequences and two highest energy state sequences. The lowest energy sequences a1 to a10 have a very high C/G content (about 80%), which is favored by nucleosomes [5,6]. The most common dinucleotides are CC/GG, GC, and CG. We find GC steps mainly where the major groove bends to-wards the histone octamer, which agrees with the nucleosome positioning rules [18,31], but they appear also at many other positions. On the other hand, the highest energy sequences b1 to b10 feature a high A/T content. The most common dinucleotides are AA and TT. We find A tracts with a length of 5 to 6 bps, which are known to repel nucleosomes [40]. Moreover A/T “disobeys” the position rules [18] by avoiding locations where the minor groove faces inward.
As a cautionary remark we stress here that these extreme sequences might not outperform high-affinity sequences found experimentally (such as the Widom 601 sequence [41]), since errors in the underlying parametrization may be ampli-fied when studying extreme cases; see also Ref. [24].
B. The best positioned nucleosomes
After finding the ground state sequences we determine next the most strongly positioned nucleosome. We consider a sequence longer thanL=147 and call a nucleosome posi-tioned at a particular location when all the energies of a set of neighboring positions are higher. Specifically, as energy landscapes show typically undulations with a 10 bp period [22,24] we introduce sequencesSof lengthL+10 or longer and aim to find a position that has a much lower energy than its 10 closest positions.
Let Sp be a subsequence of S of length L, from po-sition p to p+L. We call a nucleosome positioned at p if the energy E(Sp) is lower than the energies at positions p−5, p−4, . . . , p+5 (excludingp). Its energy difference to the smaller value of the two energy maxima (to the left and to the right) we call its depth D (formally defined in Appendix B). As an example, consider a nucleosome on ground state sequence a1, extended by placing it in a tandem repeat. As the black curve in Fig.4shows, this leads to deep minimum with depthDclose to 30kBT.
It turns out that one can find even deeper minima. To obtain narrow bounds on the deepest possible minimum, we intro-duce graphs, with different weights, such that we minimize the quantity
min
S [2E(S
p
)−E(Sp+h)−E(Sp+j)] (2)
with h∈ {−5,−4, . . . ,−1}, j ∈ {1,2, . . . ,5}. What allows us to find the deepest possible minimum is the symmetry of our system, caused by the DNA helical shape: placing a nucleosome i positions to the left or right from a local minimum will have comparable energy costs. Because of this, when we perform Eq. 2 for h= −j we obtainE(Sp+h)≈ E(Sp+j), which, combined with Eq. (2), allows us to find a great estimate for the deepest minimum.
FIG. 3. a1–a10: 10 lowest energy sequences, b1–b10: 10 highest energy sequences, c1/c2: best positioned nucleosomes. Because of symmetry, sequences a1 and a2 have the same energy and so on. At integer superhelical locations (SHL) the major groove of the DNA bends towards the histone octamer. SHL 0 is the nucleosome dyad.
consists of the nodessource,sink, and (XY)ifor allX, Y ∈B, and for alli∈ {−4,−3, . . . , L+3, L+4}. For allX, Y, Z∈ B we draw the following directed edges: from source to (XY)−4with weight zero, from (XY)L+4tosinkwith weight zero, and for all i∈ {−4,−3, . . . , L+3} from (XY)i to (Y Z)i+1 with weight Ei,h,j (X, Y, Z), where we define the function
Ei,h,j ≡2Ei−Ei−h−Ei+j.
A shortest path through Gh,j+ minimizes the quantity 2E(Sp)−E(Sp+h)−E(Sp+j). By looking at all possible graphsGh,j+ , forh, j ∈ {−5,−4, . . . ,−1,1,2, . . . ,5}we can show that the maximum depth is achieved by taking the short-est path throughG−+5,5, which is given by 83.47±0.03kBTr [the tiny possible error is due toE(Sp+h) only being approx-imately equal to E(Sp+j); see Appendix C]. The resulting shape, as well as those for other graphs, is shown by Fig.4. Remarkably a mere 5 bp shift leads to an energy change of 86% of the total energy range of 96.9kBTr [Fig.2(b)].
This path (c1/c2 in Fig. 3) is very different from the ground state sequence a1/a2. It contains few GC or CG steps and has a much higher A/T content, which is concentrated around half-integer superhelical locations (SHLs). At most such locations one finds the motive TTAA, which is known to strongly position nucleosomes in a certain rotational set-ting by intrinsically bending the DNA double helix [42]. The dinucleotides along c1/c2 share closely the nucleosome positioning rules [18], which are in fact rotational positioning rules caused by an intrinsic DNA shape [42,43].
−5 −4 −3 −2 −1 0 1 2 3 4 5 steps away from intended minimum 0
20 40 60
80 G+
−5,5
G+ −4,4 G+
−3,3
G+
−2,2
G+
−1,1
ground state
energy
[
kB Tr
]
FIG. 4. The energy landscapes as a result of a shortest path through graphs G−+i,i, i=1,2, . . . ,5, are shown, as well as the landscape of ground state sequence a1.
C. Lowest and highest energy on genes
We found that the difference between the lowest and highest possible energy is very high, suggesting that DNA mechanics allows for substantial mechanical cues to position nucleosomes. Now we ask to which extent such mechanical information can still be present under an important biological constraint: conservation of genetic information. Protein cod-ing sequences are highly degenerate with 18 of the 20 amino acids being represented by not just one codon but by a set of synonymous codons. A 147 bp stretch consists of codons, wherecan be either 49 or 50 (in the latter case two codons are only partially inside that stretch). To find the lowest and highest energy sequences that code for the same protein, we use a graphGgene which contains all synonymous codons of the given gene section. An example is depicted in Fig.5(a).
energy
[
kB Tr
]
Ggene is defined as follows. Let Ri denote the set of all synonymous codons at the ith codon position. Ri contains at least one and at most six elements. The node set ofGgene consists of the elementssource,sink, andCifor allCi∈Ri, i∈ {1,2, . . . , }. For all these nodes we draw the following directed edges: from source to C1 with weight zero, from C to sink with weight w(C, Cx) (Cx can be any codon: by definition, its energy will always be zero), and for alli∈ 1,2, . . . , −1 from Ci to Ci+1 with weight w
i(Ci, Ci+1).
The weightwiis given by
wi(C, D)=E3i−2(C1, C2, C3)+E3i−1(C2, C3, D1) + E3i(C3, D1, D2). (3)
whereCj andDj denote thejth base of the codonsCandD. The length of a path fromsourcetosinkinGgene equals the energy of the corresponding sequence.
We now apply the shortest path algorithm to find the lowest and highest energy at each position on a 500 bp-long stretch of gene YAL002W in baker’s yeast (Saccharomyces cerevisiae); see Fig.5(b). We find at each position synonymous paths that substantially lower or increase the original energy such that the available energy range is about one half of the total energy range in nucleosome affinities. Note that the 10 bp undulations of the original landscape are still visible in undulations of the lowest and highest energies.
D. Nucleosome positioning on genes
We have presented a method to obtain the lowest and high-est energy sequences while conserving genetic information. Now we ask whether it is possible to create a minimum (of given depthD) at any bp position on the yeast genome. To an-swer this question we introduce graphGgene+ , a modification of Ggene, which includes some neighboring positions and keeps the gene intact (see Fig. 8 in AppendixD for an example). The node set ofGgene+ consists of the elementssource, sink, andCi for allCi∈Riand for alli∈ {−1,0, . . . , +2}.
For allCj ∈Rj withj ∈ {−1,0, . . . , +3}we draw the following directed edges: from source to C−1 with weight zero, fromC+2 tosinkwith weight w+2(C+2, C+3), and for all i∈1,2, . . . , +1 from Ci to Ci+1 with weight wi(Ci, Ci+1). The weightw
iis given by
wi(C, D)= 5
i=−5
ciwi(C, D). (4)
where we setc0=1 andci 0 fori=0.
Our previous methods to create minima fail at many bp locations where minima appear at wrong positions, because genetic sequences are asymmetric [red dashed curve from Fig. 6(a) depicts results for ground state sequences]. We resolve this by systematically changing theci values at each iteration step. If, e.g., a minimum appearsi bp to the right of the desired position, we decrease the constantci by 0.1 and run the shortest path algorithm again with the modified weights. This gives the algorithm an “incentive” to increase the energy at that position. For details see AppendixE.
The resulting depthsD(in units ofkBTr) after performing this analysis on all genes of yeast that contain no introns
0 10 20 30 40
depthD 0
20 40 60 80 100
values
≤D
[
%
]
M
et
Tr
p
Asn Asp Cys Gln Glu His Lys Phe Ty
r
Ile
stop Ala Gly Pro Thr Va
l
Arg Leu Ser
codon
N
syn1
2
3
4
6
all
(b)
(a)
D>30
D<0 [kBTr]
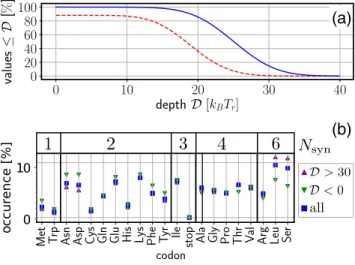
FIG. 6. (a) Percentage of all positions on genes from yeast S. cerevisiaewhere we created at least a minimum of depth D. Full method (blue continuous curve) and synonymous ground state se-quence only (red dashed curve). (b) Full method: probability of a given amino acid to occur for positions with deep minima, D> 30kBTrand no minima,D<0, compared to all values.Nsyndenotes the number of synonymous codons.
(7 640 994 nucleosome positions in total) are shown in Fig. 6(a). In 99.9943% of the cases we find a minimum, D0; for only 438 positions we do not succeed, i.e.,D<0. Minima are deeper than D10 for 99.897%, D20 for 85.67%, andD30 for 14.71%.
What about the small fraction where we fail to produce a minimum? In fact, theoretically it is possible to construct sequences with an unchangeable energy landscape, e.g., a chain made up entirely from methionine units, that can be encoded only by ATG’s. As can be seen in Fig. 6(b), gene sections where we fail to create a minimum,D<0, reflect the presence of amino acids with low degeneracyNsyn,Nsyn2, whereas the presence of amino acids with six synonymous codons,Nsyn=6, allows for deep minima withD>30.
IV. CONCLUSION
We have presented a powerful approach to study DNA mechanics, namely, to describe sequences by paths through graphs. The weights along the edges of the graphs need to be derived from a mechanical model (as done here) or from experimental data. Specifically we used this approach to determine the best and the worst sequences to be wrapped into nucleosomes and to construct the best positioned nucleosome. Importantly we showed that the degeneracy of the genetic code allows us to put mechanical cues even on top of genes to position stable nucleosomes almost anywhere on the genome of yeast with single-bp resolution. The very small fraction of places where this is not possible corresponds to gene stretches that contain a higher than average fraction of codons that have no or only one synonymous variant.
[45], DNA with an affinity to form rings [30,46], or bent linker DNA in chromatin fibers [47,48].
ACKNOWLEDGMENTS
This work is part of the Delta ITP consortium, a program of the Netherlands Organisation for Scientific Research (NWO), which is funded by the Dutch Ministry of Education, Culture and Science (OCW).
APPENDIX A: DEFINITION OF THE ENERGY
In this paper, we aim to find sequences with “special” energies, e.g., the sequences with the lowest and highest possible energies. To calculate the energy of a sequence, we use the probabilistic trinucleotide model by Tompitak et al. [26], which is based on the sequence preferences of a coarse-grained nucleosome model, parametrized by experimental parameters derived from protein-DNA crystals [27]. Because it is a trinucleotide model, we are able to represent the total energy of a sequence as a sum of “conditional” trinucleotide energies, which function as the (main ingredients of the) weights in our graphs. Here we will formally define these energies.
LetBbe the set of all nucleotides,B= {A, T , C, G}. For the trinucleotide model, it is assumed that the probability of a nucleotide depends only on the previous two. DefiningSas a sequence of lengthL, consisting of nucleotidesSi ∈Bwithi from 1 to 147, this gives a probability for the full sequence:
P(S)=
L−2
n=1Pn(Sn+2∩Sn+1∩Sn)
L−3
n=1Pn(Sn+2∩Sn+1)
(A1)
wherePn(Sn+2∩Sn+1∩Sn) is the joint (trinucleotide) proba-bility to obtainSn+2,Sn+1, andSnat positionn, andP(Sn+2∩ Sn+1) the joint (dinucleotide) probability to obtain Sn+2, Sn+1 at positionn. However, since the original trinucleotide model by Tompitaket al.does not enforce the symmetry of the coding and noncoding strand, we introduce symmetrized probabilities:
Pn(Sn∩Sn−1∩Sn−2)= 12[Pn(Sn∩Sn−1∩Sn−2)]
+1
2[Pn(Sn−2∩Sn−1∩Sn)] (A2) and
Pn(Sn∩Sn−1)=12[Pn(Sn∩Sn−1)+Pn(Sn−1∩Sn)], (A3)
where
Sn ≡
⎧ ⎪ ⎨ ⎪ ⎩
A148−nifSn=T T148−nifSn=A C148−nifSn=G G148−nifSn=C
(A4)
such that
Pn(S)=
L−2
n=1Pn(Sn+2∩Sn+1∩Sn)
L−3
n=1Pn(Sn+2∩Sn+1)
. (A5)
Following Tompitaket al., we use the probability to calculate a free energy, using E(S)= −kBTrln [P(S)]+const. We
rewrite the energy as
E(S)=
L−2
n=1
En(Sn+2, Sn+1, Sn)+const, (A6)
where
En(Sn, Sn+1, Sn+2)
=
⎧ ⎪ ⎨ ⎪ ⎩
−kBTrln[P(Sn+2∩Sn+1∩Sn)] ifn=1 −kBTrln
P(Sn+2∩Sn+1∩Sn)
P(Sn+1∩Sn) if 1< n <146
0 else
. (A7)
We define const such that the energy E is zero if S is the ground state.
Forn=1,En is the energy cost related to the first three bases of a sequenceS, for 1< n <146, it is a “conditional” energy, and it is zero elsewhere. We use these terms as weights of our graph, while keeping in mind that the sum of these weights will provide the well-defined total energyE.
APPENDIX B: DEFINITION OF THE DEPTH OF A MINIMUM
In the main text, we use the depth of a minimum Das a measure for how well the nucleosome is positioned at this minimum. Here we will formally defineD.
Let S be some sequence of length greater than L+10 (withL=147). Let Sp be a subsequence ofS of length L starting at positionp.
We call a nucleosome positioned atpif the energyE(Sp) is lower than the energies at positionsp−5, p−4, . . . , p+ 5 (excluding p). We denote the energy corresponding to a nucleosome containing the sequenceSpbyEp≡E(Sp). For a minimum atpminof sequenceSwe are interested in its depth, D(Spmin). Now we can formally define the depth as
D(Spmin)≡minEmax
left (S
pmin),Emax
right(S)
, (B1)
where
Emax
left (S)≡max[Epmin−i(S) fori∈ {1,2, . . . ,5}]−Epmin(S),
(B2)
Emax
right(S)≡max[Epmin+i(S) fori∈ {1,2, . . . ,5}]−Epmin(S).
(B3)
APPENDIX C: THE DEEPEST POSSIBLE MINIMUM
Here we show how to obtain the deepest possible mini-mum, with only a tiny possible error, by taking the shortest paths through the graphsGh,j+ defined in the main text.
A nucleosome is best positioned at a minimum pmin if D(Spmin) is maximal. We assume that the deepest possible
minimumD(Sdeepest) is found for a sequenceSdeepest. Further-more, we assume that
Emax
AA AT AC AG TA TT TC TG CA CT CC CG GA GT GC GG
-4 -3 L+3 L+4
AA AT AC AG TA TT TC TG CA CT CC CG GA GT GC GG AA AT AC AG TA TT TC TG CA CT CC CG GA GT GC GG AA AT AC AG TA TT TC TG CA CT CC CG GA GT GC GG source sink ...
FIG. 7. Visualization of a graphG+h,j
and
Emax
right(Sdeepest)=Epmin+j(Sdeepest)−Epmin(Sdeepest) (C2)
forh∈ {−5,−4, . . . ,−1},j ∈ {1,2, . . . ,5}.
Let us denote the shortest path throughGh,j+ bySh,jwith the minimum atpmin. A shortest path throughGh,j+ will minimize the quantity 2Epmin−Epmin+h−Epmin+j. Because of this, we
have
Emax left
Spmin h,j
+Emax right
Spmin h,j
Emax left
Spmin
deepest
+Emax right
Spmin
deepest
.
(C3)
SinceSpmin
deepest is the sequence with the greatest depth, we have
minEleftmaxSpmin h,j
,ErightmaxSpmin h,j
minEleftmaxSpmin
deepest
,ErightmaxSpmin
deepest
. (C4)
Combining Eq. (C3) and (C4) leads to bounds on the depth of the deepest possible minimum:
minEleftmaxSpmin h,j
,ErightmaxSpmin h,j
Emax left
Spmin
deepest 1 2 Emax left
Spmin h,j
+Emax right
Spmin h,j
. (C5)
We took the shortest path through all graphsGh,j+ for allh∈ {−5,−4, . . . ,−1},j ∈ {1,2, . . . ,5}. Of all the graphs,G−5+,5 provided the deepest minimum. Using the above equation, we obtained 83.47±0.03kBTras the deepest possible minimum.
APPENDIX D: GRAPHS
We have defined the graphs Gh,j+ , extensions of G with differently assigned weights, for h, j ∈ {−5,−4, . . . ,−1,1,2, . . . ,5}. A visual depiction is shown by Fig.7. The graphGgene+ , an extended version ofGgene, is depicted by Fig.8.
FIG. 8. Visualization of a graphGgene. This graph corresponds to creating a minimum at the seventh nucleosome position on the gene YAL002W of yeast.
APPENDIX E: CREATE LOCAL MINIMA ON TOP OF GENES
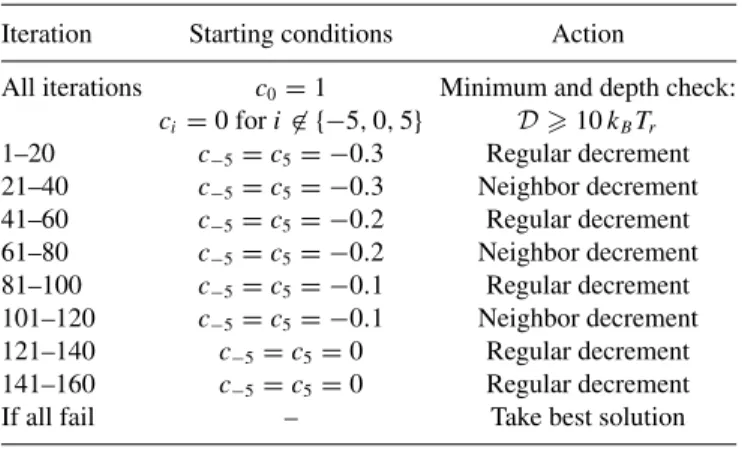
To create local minima at a position on a gene, we came up with a specifically tailored method where we alter the values of the constantsciwith each iteration. This will result in a differently weighted graph each iteration and different shortest paths. The algorithm uses at most 160 iterations per position. The iterations are grouped in eight parts, with differing starting conditions and different increment rules. See TableIfor an overview of this method.
All iterations start with c0=1,ci =0 fori∈ {−5,0,5}. Iterations 1–20 start withc−5=c5 = −0.3. At the start of it-eration 21–40, all constants are reset, and we again begin with c−5=c5= −0.3. Iterations 41–60 and 61–80 have c−5= c5= −0.2, 81–100 and 100–120 havec−5=c5= −0.1, and 121–140 and 141–160 havec−5=c5=0. The different start-ing conditions are intended to first try to create deep minima through a larger incentive to have high walls, but if this fails, settle for lower minima.
At the beginning of each and every iteration a check is per-formed. The energy landscape corresponding to the shortest path is evaluated to find whether a local minimum has been created at the right position. If there is such a local minimum, we evaluate how deep it is. If it is deeper than 10kBTr, we accept the corresponding sequence. If the local minimum is not deep enough, we evaluate which side of the energy well has the lowest wall. If the left or right wall is lowest, we set
TABLE I. Schematic form of specifically tailored method to create deep local minima at a position on a gene. The method works by altering the weightswiof graphGgeneby changing the constants
ci; see Eq. (4).
Iteration Starting conditions Action
All iterations c0=1 Minimum and depth check:
ci=0 fori∈ {−5,0,5} D10kBTr
1–20 c−5=c5= −0.3 Regular decrement
21–40 c−5=c5= −0.3 Neighbor decrement
41–60 c−5=c5= −0.2 Regular decrement
61–80 c−5=c5= −0.2 Neighbor decrement
81–100 c−5=c5= −0.1 Regular decrement
101–120 c−5=c5= −0.1 Neighbor decrement
121–140 c−5=c5=0 Regular decrement
141–160 c−5=c5=0 Regular decrement
0 20 40 60 80 100 120 140 160
iteration
10−6
10−4
10−2
100
solution
found
[%]
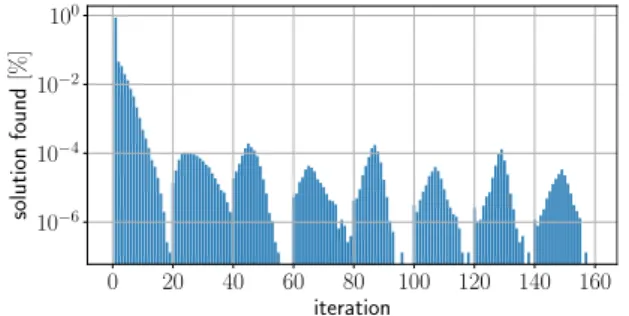
FIG. 9. For each possible iteration, the percentage of positions solved (i.e., with a deep enough minimum found) is depicted. All positions on genes from yeastS. cerevisiae (ignoring genes with introns) where evaluated. The bulk of the positions were completed at the first iteration.
c−5 →c−5−0.1 orc5→c5−0.1, respectively, and move to the next iteration. If there is no local minimum, we perform one of the two distinct schemes: “regular decrement” and “neighbor decrement.” We perform a “regular decrement” at
iterations 1–20, 41–60, etc., and a “neighbor decrement” at all other iterations.
The regular decrement is defined as follows: if the position with the lowest energy ispmin+iinstead of the intended po-sitionpmin, we performci →ci−0.1. Differently stated, we give our algorithm an incentive to raise the energy at positions where the energy is lower than at pmin. The main problem of the regular decrement is that the lowest energy position often alternates betweenpmin+1 andpmin−1. Making the decrements smaller turned out to be ineffective in solving this problem, so instead we define the “neighbor decrement.”
The neighbor decrement is the same as the regular decre-ment, with one difference: if the position with the lowest energy is pmin±1 instead of the intended positionpmin, we performci±2→ci±2−0.1.
It is possible that, after 160 iterations, no deep enough minimum is found. Then we take the deepest minimum we encountered (if any exists) as our result. The percentage of positions resolved at which iteration is depicted by Fig.9. It shows that the bulk of the positions were completed at the first iteration.
[1] K. Luger, A. W. Mäder, R. K. Richmond, D. F. Sargent, and T. J. Richmond,Nature (London)389,251(1997).
[2] H. Schiessel,J. Phys.: Condens. Matter15,R699(2003). [3] N. Kaplan, I. K. Moore, Y. Fondufe-Mittendorf, A. J. Gossett,
D. Tillo, Y. Field, E. M. LeProust, T. R. Hughes, J. D. Lieb, J. Widom, and E. Segal,Nature (London)458,362(2009). [4] P. T. Lowary and J. Widom, Proc. Natl. Acad. Sci. USA94,
1183(1997).
[5] G. Drillon, F. Argoul, B. Audit, and A. Arneodo, BMC Genomics17,526(2016).
[6] M. Tompitak, C. Vaillant, and H. Schiessel, Biophys. J.112,
505(2017).
[7] G. Meersseman, S. Pennings, and E. M. Bradbury,EMBO J.11,
2951(1992).
[8] I. M. Kuli´c and H. Schiessel, Phys. Rev. Lett. 91, 148103
(2003).
[9] G. B. Brandani, T. Niina, C. Tan, and S. Takada,Nucleic Acids Res.46,2788(2018).
[10] H. Schiessel, J. Widom, R. F. Bruinsma, and W. M. Gelbart,
Phys. Rev. Lett.86,4414(2001).
[11] I. M. Kuli´c and H. Schiessel,Biophys. J.84,3197(2003). [12] J. Lequieu, D. C. Schwartz, and J. J. de Pablo,Proc. Natl. Acad.
Sci. USA114,E9197(2017).
[13] T. Niina, G. B. Brandani, C. Tan, and S. Takada,PLoS Comput. Biol.13,e1005880(2017).
[14] J. Winger, I. M. Nodelman, R. F. Levendosky, and G. D. Bowman,eLife7,e34100(2018).
[15] G. B. Brandani and S. Takada, PLoS Comput. Biol. 14,
e1006512(2018).
[16] E. Segal and J. Widom,Trends Genet.25,335(2009). [17] K. Struhl and E. Segal,Nat. Struct. Mol. Biol.20,267(2013). [18] E. Segal, Y. Fondufe-Mittendorf, L. Chen, A. Thaström, I. K.
Moore, Y. Field, J. Z. Wang, and J. Widom,Nature (London) 442,772(2006).
[19] R. D. Kornberg and L. Stryer,Nucleic Acids Res. 16, 6677
(1988).
[20] G. Chevereau, L. Palmeira, C. Thermes, A. Arneodo, and C. Vaillant,Phys. Rev. Lett.103,188103(2009).
[21] F. G. Brunet, B. Audit, G. Drillon, F. Argoul, J.-N. Volff, and A. Arneodo,Biophys. J.114,2308(2018).
[22] B. Eslami-Mossallam, R. D. Schram, M. Tompitak, J. van Noort, and H. Schiessel,PLoS ONE11,e0156905(2016). [23] M. Tompitak, L. de Bruin, B. Eslami-Mossallam, and H.
Schies-sel,Phys. Rev. E95,052402(2017).
[24] A. V. Morozov, K. Fortney, D. A. Gaykalova, V. M. Studitsky, J. Widom, and E. D. Siggia,Nucleic Acids Res.37,4707(2009). [25] M. L. Fredman and R. E. Tarjan,J. ACM34,596(1987). [26] M. Tompitak, G. T. Barkema, and H. Schiessel,BMC Bioinf.
18,157(2017).
[27] W. K. Olson, A. A. Gorin, X.-J. Lu, L. M. Hock, and V. B. Zhurkin,Proc. Natl. Acad. Sci. USA95,11163(1998). [28] T. E. Shrader and D. M. Crothers,Proc. Natl. Acad. Sci. USA
86,7418(1989).
[29] T. E. Shrader and D. M. Crothers,J. Mol. Biol.216,69(1990). [30] J. A. J. Wondergem, H. Schiessel, and M. Tompitak,J. Chem.
Phys.147,174101(2017).
[31] S. C. Satchwell, H. R. Drew, and A. A. Travers,J. Mol. Biol. 191,659(1986).
[32] A. Valouev, S. M. Johnson, S. D. Boyd, C. L. Smith, A. Z. Fire, and A. Sidow,Nature (London)474,516(2011).
[33] S. Ercan, S. Lubling, E. Segal, and J. D. Lieb,Genome Res.21,
237(2011).
[34] J. Culkin, L. de Bruin, M. Tompitak, R. Phillips, and H. Schiessel,Eur. Phys. J. E40,106(2017).
[35] K. J. Polach and J. Widom,J. Mol. Biol.254,130(1995). [36] J. D. Anderson and J. Widom,J. Mol. Biol.296,979(2000). [37] L. de Bruin, M. Tompitak, B. Eslami-Mossallam, and
H. Schiessel,J. Phys. Chem. B120,5855(2016).
[38] T. T. M. Ngo, Q. Zhang, R. Zhou, J. G. Yodh, and T. Ha,
Cell 160,1135(2015).
[39] J. Y. Yen,Manag. Sci.17,712(1971).
[41] P. T. Lowary and J. Widom,J. Mol. Biol.276,19(1998). [42] M. Zuiddam, R. Everaers, and H. Schiessel,Phys. Rev. E96,
052412(2017).
[43] G. S. Freeman, J. P. Lequieu, D. M. Hinckley, J. K. Whitmer, and J. J. de Pablo, Phys. Rev. Lett. 113, 168101
(2014).
[44] N. B. Becker, L. Wolff, and R. Everaers,Nucleic Acids Res.34,
5638(2006).
[45] S. Todolli, P. J. Perez, N. Clauvelin, and W. K. Olson,Biophys. J.112,416(2017).
[46] G. Rosanio, J. Widom, and O. C. Uhlenbeck,Biopolymers103,
303(2015).
[47] H. Meng, K. Andresen, and J. van Noort,Nucleic Acids Res. 43,3578(2015).
![FIG. 1. Nucleosome model [22] used to construct the probabilis- probabilis-tic trinucleotide model [26]](https://thumb-us.123doks.com/thumbv2/123dok_us/8303607.2199199/2.911.495.801.112.282/fig-nucleosome-model-construct-probabilis-probabilis-trinucleotide-model.webp)