Digital histologic analysis reveals morphometric patterns of
age-related involution in breast epithelium and stroma
Rupninder Sandhu, M.B.B.S., Ph.D.1, Lynn Chollet-Hinton, M.S.P.H.2,*, Erin L. Kirk, M.S.2, Bentley Midkiff, B.S.3, and Melissa A. Troester, Ph.D., M.P.H.1,2,3
1UNC Lineberger Comprehensive Cancer Center, Chapel Hill, NC
2Department of Epidemiology, University of North Carolina at Chapel Hill, NC
3Department of Pathology and Laboratory Medicine, University of North Carolina, Chapel Hill, NC
Abstract
Complete age-related regression of mammary epithelium, often termed post-menopausal involution, is associated with decreased breast cancer risk. However, most studies have qualitatively assessed involution. We quantitatively analyzed epithelium, stroma, and adipose tissue from histologically normal breast tissue of 454 patients in the Normal Breast Study (NBS). High-resolution digital images of normal breast Hematoxylin & Eosin stained slides were partitioned into epithelium, adipose tissue, and non-fatty stroma. Percentage area and nuclei per unit area (nuclear density) were calculated for each component. Quantitative data were evaluated in association with age using linear regression and cubic spline models Stromal area decreased (p=0.0002) and adipose tissue area increased (p<0.0001), with an approximate 0.7% change in area for each component, until age 55 when these area measures reached a steady state. While epithelial area did not show linear changes with age, epithelial nuclear density decreased linearly beginning in the third decade of life. No significant age-related trends were observed for stromal or adipose nuclear density. Digital image analysis offers a high-throughput method for
quantitatively measuring tissue morphometry and for objectively assessing age-related changes in adipose tissue, stroma, and epithelium. Epithelial nuclear density is a quantitative measure of age-related breast involution that begins to decline in the early premenopausal period.
Keywords
Breast tissue; age-related involution; breast epithelium; stroma; histologic analysis; morphometry
Corresponding author: Dr. Melissa Troester, 2104 H McGavran Greenberg, Campus box 7435, 135 Dauer Drive, Chapel Hill, NC, 27599, Phone: 919-966-7408; Fax: 919-966-2089, [email protected].
*RS and LCH are co-first authors on this manuscript and contributed equally to this work
Conflict of Interest Statement: All the authors declare that there is no conflict of interest (financial or personal).
Publisher's Disclaimer: This is a PDF file of an unedited manuscript that has been accepted for publication. As a service to our customers we are providing this early version of the manuscript. The manuscript will undergo copyediting, typesetting, and review of
HHS Public Access
Author manuscript
Hum Pathol. Author manuscript; available in PMC 2017 February 01.
Published in final edited form as:
Hum Pathol. 2016 February ; 48: 60–68. doi:10.1016/j.humpath.2015.09.031.
Author Manuscript
Author Manuscript
Author Manuscript
1. Introduction
The human breast undergoes age-related involution, often defined as decreased acinar diameter and decreasing number of acini per terminal ductal lobular unit (TDLU), with concomitant decreases in mammographic density(1). Both epithelial involution and decreased mammographic density have been associated with lower breast cancer risk(1-3). In epidemiologic studies of breast cancer risk, mammographic density has been more widely studied than histologic measures of involution. Studies of age-related involution have been impeded by lack of objective and high throughput histologic measures, and by lack of biospecimens for understanding normal breast dynamics with aging(3). Increasingly, normal breast tissue is available for epidemiologic research(1, 4-6), and therefore reproducible and objective histologic assessment methods are of increasing importance.
We sought to identify morphometric features of mammary gland that vary with age and that could be used as quantitative, objective surrogates for acinar diameter or acini per TDLU. We applied novel digital imaging algorithms to breast tissue specimens from over 450 women, including more than 1000 distinct hematoxylin and eosin (H&E) slides. We quantified multiple histological features, and did not restrict our analysis to epithelial features, seeking to also understand how epithelial features relate to other stromal and adipose tissue features. Therefore, our findings identify correlations between morphometric features of stroma and epithelium and illustrate that breast tissue ages as a continuous process beginning in the third decade of life, with epithelium, stroma, and adipose tissue each possessing a unique trajectory of change. Our analysis suggests that the density of nuclei within epithelial regions may function as an objective, high throughput and quantitative measure of epithelial involution.
2. Materials and Methods
2.1. Study population
The UNC Normal Breast Study (NBS) is a study of breast cancer microenvironment and normal breast tissue conducted at UNC Hospitals in Chapel Hill, NC. Women were eligible for inclusion if they were English-speaking, at least 18 years of age, undergoing breast surgery at UNC Hospitals, and consented to donate breast tissue during their surgery. Patients with breast surgeries (mastectomy, lumpectomy, excisional biopsy, reduction mammoplasty, or other cosmetic breast surgery) scheduled between October 2009 and April 2013 were contacted for participation by study personnel during a pre-surgery appointment with their surgeon. Of 526 patients, 19 (3.6%) declined participation prior to study consent, and written informed consent was obtained for the remaining 507 patients. A total of 33 patients did not have sufficient available breast tissue at the time of surgery and were ineligible after consent. Thus, the original NBS study population included 399 women with breast cancer and 75 women with benign breast histology for a total of 474 participants.
All participants donated grossly normal-appearing breast tissue (as assessed by pathology assistants at UNC Hospitals) and two tubes of blood for lymphocytes, red blood cells, plasma, and serum at the time of surgery. Tissues were snap frozen and/or paraffin embedded, and each patient donated at least one tissue sample, or multiple specimens, if
Author Manuscript
Author Manuscript
Author Manuscript
available. For breast cancer patients, tissue specimens were collected at specified distances from the tumor: <1cm from tumor for patients receiving lumpectomies and <1cm, >1-2cm, >2-4 cm, and >4cm from tumor for patients receiving mastectomies. Patients with benign breast histology donated tissue from one or two distinct breast sites as available. When possible, bilateral breast tissue was collected.
Participants completed a telephone interview to provide demographic, lifestyle, and breast cancer risk factor exposure data, and medical records abstraction was performed to obtain patients' medical history, mammographic screening, breast cancer-related treatment, tumor pathology, and breast surgery data. Follow-up of medical records is currently ongoing and conducted annually for 10 years after surgery to obtain patient vital status and updated breast cancer recurrence, metastasis, new cancer primaries, and cancer-related treatment data. All study protocols were approved by the UNC School of Medicine's Institutional Review Board.
2.2. Tissue processing and slide preparation
Frozen tissue specimens of approximately 100 mg were cut over dry ice, and sections were collected at both ends of the specimen to construct two 20 micron slides per tissue specimen. The 20 micron section width was selected to maintain tissue integrity from non-fixed tissues and to ensure histologically-representative samples as very few samples were unable to produce viable sections at 20 micron width. The central portion of the tissue specimen was used for nucleic acid extraction as described elsewhere(7). If frozen specimens were not available (2.0% of patients), paraffin-embedded tissues were used for sectioning and digital annotation. We compared frozen and paraffin-embedded sections from a set of patients (n=90) and found no significant differences in tissue composition according to sectioning protocol (data not shown). All slides were hematoxylin and eosin (H&E) stained and histological slides (1-8 per patient) were scanned into high-resolution digital images using the Aperio Scan-Scope XT Slide Scanner (Aperio Technologies) in the UNC Translational Pathology Laboratory. The slides were scanned at ×20 magnification (0.5 μm/pixel
resolution) using line-scan camera technology capturing 1 mm stripes across the entire slide; the stripes are aligned, stored, and accessed as an entire digital slide (U.S. Patent 6,711,283).
http://www.archpatent.com/patents/6711283. The image bit depth for the slides was 8 bits.
The ScanScope XT employs a linear-array scanning technique that generates digital slide images that have no tiling artifacts and that are essentially free from optical aberrations along the scanning axis. The scanned slides had quality factor of over 90 indicating good focusing. Slides with poor resolution or significant folded tissue (n=16) were manually identified and excluded from analysis.
2.3. Breast tissue percent area and nuclear density by stroma, adipose tissue, and epithelial region
A previously published algorithm was utilized to partition slides into epithelium, stroma, and adipose tissue regions(4, 5, 7). Briefly, slides were first manually annotated at high magnification using Aperio Imagescope V11.0.2.725, with different annotation layers representing the epithelium, adipose tissue, stromal tissue as well as the total tissue area outline. Aperio's Genie Classifier was then trained to perform automated analyses to
Author Manuscript
Author Manuscript
Author Manuscript
partition epithelium, adipose tissue, nonfatty stroma, and glass. Glass was excluded from the total area. Test set digital slides were evaluated by two pathologists who provided semi quantitative estimates of the percentages of adipose tissue (10% bin width), epithelium (1% bin width), and nonfatty stroma (10% bin width). The results of these three methods (Genie, manual-annotation of digital slides, and pathologist semi-quantitative visual review of H&E slides) showed excellent concordance between manual annotation and algorithm annotation, with a final accuracy of 99.4% (Pearson correlation coefficient ranged 0.96–0.98) compared to manual images(4, 5, 7). Correlations between pathologist visual, semi-quantitative review and algorithm results were also very high (≥ 95%), except for epithelium where semi-quantitative estimates by pathologists used a bin width of 5% and Genie was much more precise and accurate. Thus, the algorithm out-performs semi-quantitative visual assessment by a pathologist and matches almost perfectly with manually annotated, pathologist reviewed images(4, 5). To identify the number of nuclei per unit area in stroma, epithelium and adipose tissue, a standard, validated nuclear detection algorithm included with Genie was utilized. The nuclear counts along with the area for each component (epithelium, stroma and adipose tissue) were used to calculate epithelial, stromal, and adipose tissue nuclear
density in cells per mm2. No exclusions were made based on cell type (because such
exclusions would require IHC staining and validation), however the minimum nuclear size
(um̂2) was set to 15, and the max nuclear size (um̂2) was set to 150 for this algorithm which
should minimize larger cell contributions.
2.4. Statistical analysis
Histologic metrics evaluated in association with age included percentage area and nuclear density for three components (epithelium, stroma, adipose tissue). Data were available for two H&E-stained slides per tissue specimen (one section from each end of the sample). Prior to analysis, intraclass correlation coefficients (ICCs) were calculated to assess consistency between replicate sections(8). Duplicate slides were averaged to create one percentage area and one nuclear density estimate per stromal, adipose tissue, and epithelial compartment per specimen. To be consistent across all the NBS patients, the tissue specimen closest to tumor (for breast cancer patients) or the first sampled tissue site (for patients without breast cancer) was selected for inclusion for patients with specimens taken from multiple sites. After manual review of these slides, four breast cancer patients were found to have tissue with high epithelial content (>50%) that did not appear histologically normal and thus were excluded. Following all exclusions, the final analysis population included 454 participants (387 patients with ipsilateral breast cancer and 67 with benign breast histology).
Linear regression models were used to estimate the association between age at surgery and percentage area and nuclear density. Age was modeled categorically by decades (<40, 40-49, 50-59, 60-69, ≥70 years) with a linear test for trend, and as a binary variable dichotomized at age 50 years. To assess modification of the age-histology relationship by disease status (presence/absence of breast cancer), sensitivity analyses were conducted excluding patients without breast cancer. To visualize the relationship between age and each stromal, adipose, and epithelial measure, cubic spline models were used with a knot
specified at 55 years, selected by visual inspection of the data, which suggested that stromal and adipose tissue composition measures appeared to have an inflection point at
Author Manuscript
Author Manuscript
Author Manuscript
approximately 55 years of age. Pearson correlations were calculated to assess the strength of pairwise relationships between stromal, adipose tissue, and epithelial percentage area and nuclear density measures. Statistical significance was defined as p<0.05, and statistical analyses were performed using SAS software, version 9.3 (SAS Institute, Inc., Cary, North Carolina) or R, version 3.0.1 (for spline models).
3. Results
3.1. Patient and Histologic Characteristics
The majority of participants (85.2%) had breast cancer at the time of their surgery, and the remaining participants had either benign breast conditions (e.g., hyperplasia, simple cysts, or fibroadenomas; 5.1%), normal breast tissue from a reduction mammoplasty or prophylactic mastectomy (6.6%), or a previous history of a treated breast cancer at least one year prior to the consented surgery (3.1%; Table 1). Average age at time of surgery was highest among breast cancer patients (55.3 years) and lowest among women receiving reductions or prophylactic surgeries (42.0 years). Patients with breast cancer were significantly older (p<0.01) and slightly more likely to be non-white. Given the large number of cancer patients, clinical characteristics are presented in Table 2. Among breast cancer patients, tumors tended to be small (≤2.0 cm) and early stage, with 85.1% of women having stage 0-2 disease. The tumors were also predominantly ER and PR positive as well as HER2 negative, reflecting expected distributions among breast cancer patients.
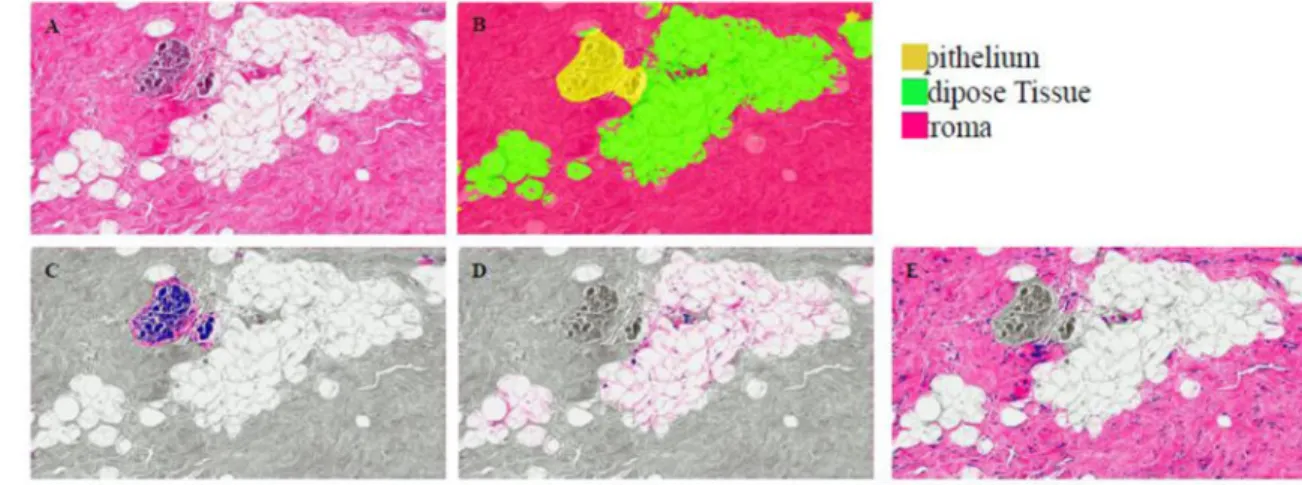
Figure 1A shows a representative tissue, together with the classification of stroma, adipose tissue and epithelial regions (Figure 1B). Nuclear density was calculated based on the
number of nuclei per mm2 in particular regions, segmented as shown in Figure 1C-E
(epithelium, adipose tissue and stroma, respectively). On average, adipose tissue represented the largest tissue fraction for percentage area (mean 51.6%), followed by stroma (35.2%) and epithelium (13.2%; Table 3). The percentage area estimates were most variable (greatest range on an absolute scale) for stromal and adipose tissue area. Sensitivity analyses
examining average percentage area and nuclear density according to disease status (participants with breast cancer vs. study as a whole) were not substantially altered when excluding reduction mammoplasty patients (Table 3). Similarly, we compared normal breast tissue from 14 patients who were treated before surgery to all other patients in the Normal Breast Study and observed no differences (data not shown). Table 3 also shows that estimates were highly correlated (high intraclass correlation) between replicate measures in the same patient.
3.2. Associations between age and tissue morphometry
Linear regression models showed significant associations between age and epithelial characteristics (Table 4). Namely, there were strong associations between age and decreasing density of nuclei in epithelial regions (linear trend p <0.0001). Sensitivity analyses repeating all linear regression models after excluding reduction mammoplasty cases did not alter these findings (Supplemental Table 1). Epithelial nuclear density was also associated with increased stromal percentage area and decreasing adipose tissue area (Table
Author Manuscript
Author Manuscript
Author Manuscript
5). Epithelial nuclear density appeared to be a stronger measure of age-related involution than epithelial percentage area, which showed no significant age-associations.
Stromal characteristics also changed significantly with age. Stromal percentage area was significantly lower among women over 50 years of age (9% lower) compared to younger women. Adipose tissue mirrored age-related changes in stroma (9% higher in women over 50). The symmetry of stromal and adipose tissue change is underscored by a strong inverse association between stromal and adipose tissue percentage area (Table 5). Stromal nuclear density was not significantly associated with age (linear trend p = 0.08), but did increase slightly with increasing age. Changes in adipose tissue nuclear density were modest and did not vary with age.
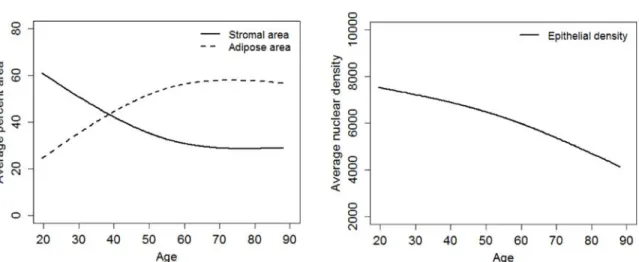
While we used nominal categorical coding by decade to model age due to nonlinearity of the decade-histology associations, we also visualized temporal changes using boxplots
(Supplemental Figure 1) and cubic spline models. These models visually confirmed associations between age and breast tissue composition (Figure 2). Stromal and adipose tissue area showed contrasting associations with age: stromal area decreased by an increment of 0.7% per year up to age 55 years (p = 0.0002) after which the trend stabilized at approximately 30.0% stromal area for older ages (Figure 2A). In contrast, adipose tissue area increased by 0.7% per year before age 55 years (p < 0.0001) and plateaued at
approximately 60% adipose tissue area at ages over 55 years. Epithelial nuclear density
decreased significantly and monotonically at a rate of 35.3 cells per mm2 prior to age 55 (p
= 0.05), after which the rate increased (for ages over 55 years, -65.9 cells per mm2, p =
0.0007; Figure 2B). Modeling the association between age and stromal nuclear density, adipose tissue nuclear density, and epithelial percentage area with cubic splines revealed no significant age-related changes in these measures (Supplemental Figure 2).
4. Discussion
Our findings suggest that the density of nuclei within epithelial regions represents a robust, automated method for assessing age-related involution. Furthermore, several features of breast tissue morphometry (as represented by stromal percentage area, adipose tissue percentage area, and epithelial nuclear density) change dynamically and continuously with age, as stromal and epithelial tissue fractions appear to be replaced by adipose tissue. This mirrors the age-related decline in fibroglandular tissue measurable as mammographic density, but interestingly, suggests that stroma-rich tissues are also more likely to have more nuclei/cellularity in epithelial regions. Increased epithelial cellularity may be a critical factor mediating risk. In fact, investigators have hypothesized that age-dependent mammary gland involution may function in a manner that is analogous to a prophylactic mastectomy(9, 10). As involution progresses, epithelial proliferation and susceptible cell populations are reduced, leading to a partial mastectomy-like phenotype. Further evidence for the importance of involution comes from the efficacy of chemopreventive drugs such as tamoxifen, which effectively induces chemically-induced involution(11-13).
Most histologic studies of age-related involution have focused on understanding changes in epithelium(9, 14-17). Our results confirm dramatic epithelial changes in epithelial nuclear
Author Manuscript
Author Manuscript
Author Manuscript
density with aging, but also illustrate that aging produces important changes in all the histological components of breast(10, 18-21). Decreasing stromal area appears to be a key feature of stromal involution. The observation that stromal nuclear density increases with age, suggests that an early feature of stromal involution is decreased deposition of
extracellular matrix. At later ages, stromal nuclear density plateaus, perhaps because stromal cellularity begins to parallel declining extracellular matrix. Meanwhile, steady
age-dependent increases in adipose tissue area reflect the involution of fibroglandular tissue as a whole. Taken together, these observations show a dynamically evolving breast tissue, with no ‘steady state’, even after menopause.
The continuing evolution of breast tissue after menopause is important in light of the common conceptualization of menopause as a dichotomous (before/after) event in
epidemiologic studies. Our data agrees with findings of others(1), showing that a dichotomy may not be useful in characterizing mammary gland change over time. Hormonal changes, and thus age-related histologic changes, begin in the third decade of life(10, 22) and persist after menopause. In fact, our recent gene expression analyses showed no significant changes in human breast tissue by menopausal status, but found dramatic gene expression changes with aging among premenopausal women(23). The current study also showed that while
stromal changes reach a stable state near the time of menopause (∼50-55 years of age),
epithelial nuclear density continues to change.
Our observations are in line with several previous investigations using qualitative or semi-quantitative measures of age-related involution. With respect to epithelium, Gertig et al. observed that epithelial proportion decreased with age(18), a pattern that was not replicated in our study (employing the percent area as a metric for epithelial proportion). However, patients in Gertig et al. had biopsies with no evidence of breast cancer, and women above 50 years of age constituted just 32% (above 60 years constituted only 7%) of the study
population. In contrast, our study population was much older, with women above 50 years of age constituting 62% (above 60 years constituted 33%) of the study population. The
nonmonotonic relationship between age and epithelial area observed in our study was particularly pronounced in the oldest women, where area tended to level off and then increase slightly. In the Polish Women Breast Cancer Study, Sun et al. also observed patterns of age-associated changes in epithelium similar to our observations in the current study(5). These findings suggest that while epithelial area may predict gene expression patterns(5), it is not a robust measure of age-dependent involution. Moreover, the epithelial percent area is dependent on other components (stromal percent area and adipose tissue percent area) whereas epithelial nuclear density has an advantage being less susceptible to the bias based on these other components.
Considering stromal changes in age, Gertig et al. observed that stromal proportion in breast was inversely related to age at biopsy and that declines in stromal proportion were greater after 50 years of age(18). Among participants in the Polish Women Breast Cancer Study, Sun et al. observed stromal proportion decreased with age and adipose tissue proportion increased with age, but leveled off after age 50(5). Despite these slight differences, the general patterns across studies are relatively consistent. However, stromal changes with age and involution have received little study, despite their theoretical importance(24). While the
Author Manuscript
Author Manuscript
Author Manuscript
current study and those described above have used automated computer algorithms, age-related involution has been most commonly assessed by a pathologist. An important study was recently published that evaluated age-related changes in epithelial content of healthy volunteers. In this large study including more than 1000 participants, Figueroa et al. showed that the epithelial content quantified by the terminal ductal lobular unit measures (terminal ductal lobular unit counts, terminal ductal lobular unit span and acini counts/terminal ductal lobular unit) declined with advancing age(1). These authors also observed that the declines began in the third decade of life and continued well into menopause, in line with our findings for epithelial nuclear density. Further comparisons between healthy volunteers and patients at higher risk (i.e. biopsy patients or cancer patients) are needed to evaluate whether age-related involution patterns are generalizable across studies of women with different disease status.
While few studies have quantified changes in histology, many have studied composition using mammographic density as a surrogate. Li et al observed that the increasing age is associated with a decrease in percent mammographic density that reflects variation in fibroglandular content(25). Several studies have shown that higher percent mammographic density is associated with increased amounts of stroma and epithelium(26) and have shown that mammographically dense tissue decreases with age(19, 27, 28). While mammographic density is typically considered to measure ‘fibroglandular’ components, lumping stromal and epithelial components(18), an advantage of high-throughput, histologic quantification is separation of epithelial and stromal components. Here we observed that stromal percentage is associated with epithelial content, consistent with the associations for mammographic density.
Previous studies have suggested that involution and involution-associated measures such as mammographic density may represent an intermediate or surrogate endpoint for breast cancer risk(20, 28, 29). It has been hypothesized that exposures that delay age-related involution may increase breast cancer risk(9, 29). Interesting support for this hypothesis comes from animal studies that have demonstrated histological responses to carcinogenic environmental exposures(30, 31). Morphometric analysis such as that presented here may facilitate integration of human observational findings and experimental findings in animals.
Our study should be interpreted in light of some limitations. First, inclusion of participants already undergoing breast surgery limits risk to participants, but may bias our findings or limit their generalizability to low risk women. Previous studies have shown that patients undergoing surgical procedures may be more likely than normal donors to have proliferative disease with or without atypia(32). Nonetheless, the age-related patterns we observed in epithelium are similar in magnitude to quantitative measures of epithelial involution in previous studies with healthy volunteers(1). It is also noteworthy that some hormonal effects on mammographic density have only been observed among high risk women(33),
suggesting that studies among higher risk women may provide important information even when results differ from those among a lower risk population.
Future studies should evaluate whether histologic features of cancer-adjacent normal tissue differ from those of healthy volunteers and should also consider how histologic features are
Author Manuscript
Author Manuscript
Author Manuscript
affected by adjacent tumor, including tumor subtype or clinical characteristics(34). However, larger sample sizes may be needed; while this study included more than 400 women and more than 1000 histologic images, we found substantial variation between women, suggesting that statistical power for more subtle associations requires substantially larger studies. It is also important to consider sources of intraindividual variation. Women may have both mammographically dense and non-dense regions in their breast tissue(35). These regions may experience age and/or age-related involution differently.
In conclusion, our study provides a novel approach for assessing age-related involution and describes age-related patterns in percentage area and nuclear density of breast tissue within a population of women with histologically normal-appearing breast tissue. It is important to understand how normal tissue responds to breast cancer risk factor exposures as these dynamics may mediate breast cancer risk.
Supplementary Material
Refer to Web version on PubMed Central for supplementary material.
Acknowledgments
The authors gratefully acknowledge Mark E. Sherman for helpful comments on the manuscript. This research was supported by the Avon Foundation, North Carolina University Cancer Research Fund, National Cancer Institute (R01 CA179715) and National Institutes of Environmental Health Sciences (U01 ES019472-01).
Grant numbers and sources of support: Avon Foundation, North Carolina University Cancer Research Fund, National Cancer institute (R01 CA179715) and National Institutes of Environmental Health Sciences (U01 ES019472-01).
References
1. Figueroa JD, Pfeiffer RM, Patel DA, Linville L, Brinton LA, Gierach GL, Yang XR, Papathomas D, Visscher D, Mies C, Degnim AC, Anderson WF, Hewitt S, Khodr ZG, Clare SE, Storniolo AM, Sherman ME. Terminal duct lobular unit involution of the normal breast: implications for breast cancer etiology. J Natl Cancer Inst. 2014; 106:1–11.
2. Ghosh K, Vachon CM, Pankratz VS, Vierkant RA, Anderson SS, Brandt KR, Visscher DW, Reynolds C, Frost MH, Hartmann LC. Independent association of lobular involution and mammographic breast density with breast cancer risk. J Natl Cancer Inst. 2010; 102:1716–1723. [PubMed: 21037116]
3. Henson DE, Tarone RE. Involution and the etiology of breast cancer. Cancer. 1994; 74:424–429. [PubMed: 8004616]
4. Sun X, Gierach GL, Sandhu R, Williams T, Midkiff BR, Lissowska J, Wesolowska E, Boyd NF, Johnson NB, Figueroa JD, Sherman ME, Troester MA. Relationship of mammographic density and gene expression: analysis of normal breast tissue surrounding breast cancer. Clin Cancer Res. 2013; 19:4972–4982. [PubMed: 23918601]
5. Sun X, Sandhu R, Figueroa JD, Gierach GL, Sherman ME, Troester MA. Benign breast tissue composition in breast cancer patients: association with risk factors, clinical variables, and gene expression. Cancer Epidemiol Biomarkers Prev. 2014; 23:2810–2818. [PubMed: 25249325] 6. Jindal S, Gao D, Bell P, Albrektsen G, Edgerton SM, Ambrosone CB, Thor AD, Borges VF,
Schedin P. Postpartum breast involution reveals regression of secretory lobules mediated by tissue-remodeling. Breast Cancer Res. 2014; 16:R31. [PubMed: 24678808]
7. Casbas-Hernandez P, Sun X, Roman-Perez E, D'Arcy M, Sandhu R, Hishida A, McNaughton KK, Yang XR, Makowski L, Sherman ME, Figueroa JD, Troester MA. Tumor intrinsic subtype is
Author Manuscript
Author Manuscript
Author Manuscript
reflected in cancer-adjacent tissue. Cancer Epidemiol Biomarkers Prev. 2015; 24:406–414. [PubMed: 25465802]
8. Lee J, Koh D, Ong CN. Statistical evaluation of agreement between two methods for measuring a quantitative variable. Comput Biol Med. 1989; 19:61–70. [PubMed: 2917462]
9. Milanese TR, Hartmann LC, Sellers TA, Frost MH, Vierkant RA, Maloney SD, Pankratz VS, Degnim AC, Vachon CM, Reynolds CA, Thompson RA, Melton LJ 3rd, Goode EL, Visscher DW. Age-related lobular involution and risk of breast cancer. J Natl Cancer Inst. 2006; 98:1600–1607. [PubMed: 17105983]
10. Ginsburg OM, Martin LJ, Boyd NF. Mammographic density, lobular involution, and risk of breast cancer. Br J Cancer. 2008; 99:1369–1374. [PubMed: 18781174]
11. McGinley JN, Thompson HJ. Quantitative assessment of mammary gland density in rodents using digital image analysis. Biol Proced Online. 2011; 13:4. [PubMed: 21663682]
12. King V, Kaplan J, Pike MC, Liberman L, David Dershaw D, Lee CH, Brooks JD, Morris EA. Impact of tamoxifen on amount of fibroglandular tissue, background parenchymal enhancement, and cysts on breast magnetic resonance imaging. Breast J. 2012; 18:527–534. [PubMed: 23002953]
13. Pike MC, Pearce CL. Mammographic density, MRI background parenchymal enhancement and breast cancer risk. Ann Oncol. 2013; 24(Suppl 8):viii37–viii41. [PubMed: 24131968]
14. Tarulli GA, De Silva D, Ho V, Kunasegaran K, Ghosh K, Tan BC, Bulavin DV, Pietersen AM. Hormone-sensing cells require Wip1 for paracrine stimulation in normal and premalignant mammary epithelium. Breast Cancer Res. 2013; 15:R10. [PubMed: 23369183]
15. Vaught DB, Stanford JC, Young C, Hicks DJ, Wheeler F, Rinehart C, Sanchez V, Koland J, Muller WJ, Arteaga CL, Cook RS. HER3 is required for HER2-induced preneoplastic changes to the breast epithelium and tumor formation. Cancer Res. 2012; 72:2672–2682. [PubMed: 22461506] 16. Vargo-Gogola T, Rosen JM. Modelling breast cancer: one size does not fit all. Nat Rev Cancer.
2007; 7:659–672. [PubMed: 17721431]
17. Kohn EA, Yang YA, Du Z, Nagano Y, Van Schyndle CM, Herrmann MA, Heldman M, Chen JQ, Stuelten CH, Flanders KC, Wakefield LM. Biological responses to TGF-beta in the mammary epithelium show a complex dependency on Smad3 gene dosage with important implications for tumor progression. Mol Cancer Res. 2012; 10:1389–1399. [PubMed: 22878587]
18. Gertig DM, Stillman IE, Byrne C, Spiegelman D, Schnitt SJ, Connolly JL, Colditz GA, Hunter DJ. Association of age and reproductive factors with benign breast tissue composition. Cancer Epidemiol Biomarkers Prev. 1999; 8:873–879. [PubMed: 10548315]
19. Boyd N, Martin L, Chavez S, Gunasekara A, Salleh A, Melnichouk O, Yaffe M, Friedenreich C, Minkin S, Bronskill M. Breast-tissue composition and other risk factors for breast cancer in young women: a cross-sectional study. Lancet Oncol. 2009; 10:569–580. [PubMed: 19409844]
20. Boyd NF, Lockwood GA, Martin LJ, Byng JW, Yaffe MJ, Tritchler DL. Mammographic density as a marker of susceptibility to breast cancer: a hypothesis. IARC Sci Publ. 2001; 154:163–169. [PubMed: 11220655]
21. McCormack VA, dos Santos Silva I. Breast density and parenchymal patterns as markers of breast cancer risk: a meta-analysis. Cancer Epidemiol Biomarkers Prev. 2006; 15:1159–1169. [PubMed: 16775176]
22. Pike MC, Krailo MD, Henderson BE, Casagrande JT, Hoel DG. ‘Hormonal’ risk factors, ‘breast tissue age’ and the age-incidence of breast cancer. Nature. 1983; 303:767–770. [PubMed: 6866078]
23. Pirone JR, D'Arcy M, Stewart DA, Hines WC, Johnson M, Gould MN, Yaswen P, Jerry DJ, Smith Schneider S, Troester MA. Age-associated gene expression in normal breast tissue mirrors qualitative age-at-incidence patterns for breast cancer. Cancer Epidemiol Biomarkers Prev. 2012; 21:1735–1744. [PubMed: 22859400]
24. Krtolica A, Parrinello S, Lockett S, Desprez PY, Campisi J. Senescent fibroblasts promote epithelial cell growth and tumorigenesis: a link between cancer and aging. Proc Natl Acad Sci U S A. 2001; 98:12072–12077. [PubMed: 11593017]
25. Li T, Sun L, Miller N, Nicklee T, Woo J, Hulse-Smith L, Tsao MS, Khokha R, Martin L, Boyd N. The association of measured breast tissue characteristics with mammographic density and other
Author Manuscript
Author Manuscript
Author Manuscript
risk factors for breast cancer. Cancer Epidemiol Biomarkers Prev. 2005; 14:343–349. [PubMed: 15734956]
26. Boyd NF, Martin LJ, Bronskill M, Yaffe MJ, Duric N, Minkin S. Breast tissue composition and susceptibility to breast cancer. J Natl Cancer Inst. 2010; 102:1224–1237. [PubMed: 20616353] 27. Vachon CM, Pankratz VS, Scott CG, Maloney SD, Ghosh K, Brandt KR, Milanese T, Carston MJ,
Sellers TA. Longitudinal trends in mammographic percent density and breast cancer risk. Cancer Epidemiol Biomarkers Prev. 2007; 16:921–928. [PubMed: 17507617]
28. Boyd N, Martin L, Stone J, Little L, Minkin S, Yaffe M. A longitudinal study of the effects of menopause on mammographic features. Cancer Epidemiol Biomarkers Prev. 2002; 11:1048–1053. [PubMed: 12376506]
29. Martin LJ, Boyd NF. Mammographic density. Potential mechanisms of breast cancer risk associated with mammographic density: hypotheses based on epidemiological evidence. Breast Cancer Res. 2008; 10:201. [PubMed: 18226174]
30. Vorderstrasse BA, Fenton SE, Bohn AA, Cundiff JA, Lawrence BP. A novel effect of dioxin: exposure during pregnancy severely impairs mammary gland differentiation. Toxicol Sci. 2004; 78:248–257. [PubMed: 14718648]
31. Reed CE, Fenton SE. Exposure to diethylstilbestrol during sensitive life stages: a legacy of heritable health effects. Birth Defects Res C Embryo Today. 2013; 99:134–146. [PubMed: 23897597]
32. Degnim AC, Visscher DW, Hoskin TL, Frost MH, Vierkant RA, Vachon CM, Shane Pankratz V, Radisky DC, Hartmann LC. Histologic findings in normal breast tissues: comparison to reduction mammaplasty and benign breast disease tissues. Breast Cancer Res Treat. 2012; 133:169–177. [PubMed: 21881938]
33. Boyd NF, Martin LJ, Li Q, Sun L, Chiarelli AM, Hislop G, Yaffe MJ, Minkin S. Mammographic density as a surrogate marker for the effects of hormone therapy on risk of breast cancer. Cancer Epidemiol Biomarkers Prev. 2006; 15:961–966. [PubMed: 16702377]
34. Yang XR, Figueroa JD, Falk RT, Zhang H, Pfeiffer RM, Hewitt SM, Lissowska J, Peplonska B, Brinton L, Garcia-Closas M, Sherman ME. Analysis of terminal duct lobular unit involution in luminal A and basal breast cancers. Breast Cancer Res. 2012; 14:R64. [PubMed: 22513288] 35. Ghosh K, Brandt KR, Reynolds C, Scott CG, Pankratz VS, Riehle DL, Lingle WL, Odogwu T,
Radisky DC, Visscher DW, Ingle JN, Hartmann LC, Vachon CM. Tissue composition of mammographically dense and non-dense breast tissue. Breast Cancer Res Treat. 2012; 131:267– 275. [PubMed: 21877142]
Author Manuscript
Author Manuscript
Author Manuscript
Figure 1. Quantitative histological data obtained with novel morphometric methods
Panels A-E represent the images of the H&E slides taken at 10× resolution. A) Image of H&E slide with no annotations B) Image from panel A with annotation overlay of epithelial area in yellow, adipose tissue area in green and stromal area in pink as demonstrated in the key in the figure C) Image from panel A with annotation overlay of epithelial nuclei in blue D) Image from panel A with annotation overlay of adipose tissue nuclei in blue E) Image from panel A with annotation overlay of stromal nuclei in blue. C)-E) Areas shown in gray are excluded from analysis.
Author Manuscript
Author Manuscript
Author Manuscript
Figure 2. Cubic spline curves for stromal area, adipose area, and epithelial nuclear density by age
Spline curves were generated from cubic spline models with a knot specified at 55 years of age to visualize the relationship between age and breast tissue composition. Stromal area and adipose tissue area (A) are shown as percent of total area. Epithelial nuclear density (B)
is in nuclei per mm2 of epithelium.
Author Manuscript
Author Manuscript
Author Manuscript
Author Manuscript
Author Manuscript
Author Manuscript
Author Manuscript
Table 1
Distribution of patients in the Normal Breast Study (N=454).
Breast cancer diagnosis No cancer history
Patient group Active disease Previous history* Reduction/Prophylactic Benign condition
Total N (%) 387 (85.2) 14 (3.1) 30 (6.6) 23 (5.1)
Mean age ± SD 55.3 ± 12.5 50.1 ± 9.6 42.0 ± 13.4 48.2 ± 14.2
Race
White 240 (62.0) 10 (71.4) 21 (70.0) 14 (60.9)
Other 147 (38.0) 4 (28.6) 9 (30.0) 9 (39.1)
*
Author Manuscript
Author Manuscript
Author Manuscript
Author Manuscript
Table 2
Distribution of tumor characteristics among breast cancer patients in the Normal Breast Study (N=387).
N %
Tumor characteristics
Stage
0 67 17.4
1 166 43.2
2 94 24.5
3 48 12.5
4 9 2.3
Missing 3
Grade
1 65 17.1
2 150 39.4
3 166 43.6
Missing 6
ER status
Negative 93 24.5
Positive 287 75.5
Missing 7
PR status
Negative 131 34.6
Positive 248 65.4
Missing 8
HER2 status‡
Negative 246 80.4
Positive 60 19.6
Missing 14
Tumor size
≤2cm 212 55.1
>2-5cm 127 33.0
>5cm 46 11.9
Missing 2
Lymph node status
Negative 226 64.2
Positive 126 35.8
Missing 35
‡
Author Manuscript
Author Manuscript
Author Manuscript
Author Manuscript
Table 3
Average stromal, adipose tissue, and epithelial tissue components in the Normal Breast Study.
All patients (N=454)
Breast cancer patients (N=387)
Mean (SE)
Range
Mean (SE)
Range
ICC
* (95% CI)
Percentage area (%)
Stroma
35.2 (1.3)
0.0-92.9
35.0 (1.4)
0.0-92.9
1.0 (1.0, 1.0)
Adipose
51.6 (1.3)
6.0-97.6
51.9 (1.4)
6.0-97.6
0.9 (0.9, 0.9)
Epithelium
13.2 (0.5)
0.3-49.8
13.2 (0.5)
0.5-49.8
0.9 (0.9, 0.9)
Nuclear density (cells per mm
2)
Stroma
1,552.2 (43.8)
0-7,561.6
1,560.1 (47.6)
0-7,561.6
0.8 (0.8, 0.9)
Adipose
246.9 (4.9)
9.4-670.6
247.1 (5.4)
9.4-670.6
0.9 (0.8, 0.9)
Epithelium
6,214.8 (125.4)
1,517.0-13,674.3
6,244.3 (135.8)
1,850.1-13,674.3
0.8 (0.8, 0.9)
Author Manuscript
Author Manuscript
Author Manuscript
Author Manuscript
Table 4
Age associations with stromal, adipose tissue, and epithelial percentage area and nuclear density in the Normal Breast Study (N=454).
Stroma Adipose Epithelium N Mean (SE) Difference (SE) p Mean (SE) Difference (SE) p Mean (SE) Difference (SE) p
Percent area (%)
Age (binary) <50 (ref) 174 40.6 (2.2) 46.1 (2.1) 13.3 (0.8) ≥50 280 31.8 (1.7) -8.8 (2.7) 0.001 55.0 (1.6) 8.9 (2.6) 0.0007 13.2 (0.6) -0.2 (0.9) 0.9 Age (decades) <40 64 48.2 (3.4) 12.1 (4.3) 37.9 (3.0) -12.8 (4.2) 13.8 (1.5) 0.8 (1.5) 40-49 (ref) 110 36.2 (2.7) --50.8 (2.7) --13.0 (0.9) --50-59 132 34.3 (2.5) -1.9 (3.6) 52.8 (2.4) 2.0 (3.5) 13.0 (0.8) -0.09 (1.3) 60-69 99 32.0 (2.8) -4.2 (3.8) 55.4 (2.7) 4.6 (3.7) 12.6 (0.9) -0.4 (1.4) ≥70 49 25.1 (3.5) -11.1 (4.7) 60.2 (3.2) 9.4 (4.6) 14.8 (1.5) 1.7 (1.7) Trend test β (decades) -4.7 (1.1) * <0.0001 4.6 (1.1) * <0.0001 0.1 (0.4) * 0.9
Nuclear density (cells/mm
2) Age <50 (ref) 174 1,503.7 (65.3) 247.7 (8.6) 6,788.5 (213.3) ≥50 280 1,582.4 (58.3) 78.7 (89.9) 0.4 246.4 (5.9) -1.3 (10.1) 0.9 5,858.3 (150.5) -930.1 (253.8) 0.0002 Age (decades) <40 64 1,340.1 (106.0) -258.9 (145.7) 229.9 (14.8) -28.2 (16.4) 7,137.6 (346.6) 552.3 (406.9) 40-49 (ref) 110 1,598.9 (81.8) --258.1 (10.4) --6,585.3 (269.8) --50-59 132 1,517.6 (78.1) -81.3 (119.7) 240.0 (9.0) -18.1 (13.4) 6,399.4 (235.9) -185.9 (334.2) 60-69 99 1,615.5 (105.7) 16.5 (128.4) 247.2 (9.9) -10.9 (14.4) 5,575.2 (241.8) -1,010.1 (358.6) ≥70 49 1,690.0 (146.7) 91.0 (159.2) 262.2 (12.7) 4.1 (17.9) 4,972.7 (256.8) -1,612.6 (444.6) Trend test β (decades) 63.6 (36.2) * 0.08 3.8 (4.1) * 0.4 -523.2 (101.1) * <0.0001
* Represents difference in percent area or nuclear density per increasing age category (decades);
p
Author Manuscript
Author Manuscript
Author Manuscript
Author Manuscript
Table 5
Pearson correlation matrix assessing associations between each stromal, adipose, and epithelial tissue composition measure
*.
Stroma
Adipose
Epithelium
Percentage area
Nuclear density
Percentage area
Nuclear density
Percentage area
Nuclear density
Stroma
Percentage area
1.00
--Nuclear density
-0.38
1.00
--Adipose
Percentage area
-0.94
0.20
1.00
--Nuclear density
-0.65
0.45
0.56
1.00
--Epithelium
Percentage area
-0.24
0.51
-0.11
0.30
1.00
--Nuclear density
0.72
-0.02
-0.75
-0.41
0.03
1.00