User Reference Manual
Document Number: EnergyDirect-SCS-2014-07
Document Version: EnergyDirect 5.0
Copyright Notice
The information contained herein is confidential and proprietary to:
Southern Company
30 Ivan Allen Jr. Blvd., NW
Atlanta, GA 30308
This information may not be copied, excerpted, or reproduced by any means
including but not limited to: photocopy, electronic imaging, or other technology
present or future, without the express written permission of Southern Company.
Trademarks
Microsoft® and Visual FoxPro® are registered trademarks of Microsoft Corporation.
Excel is a product of Microsoft Corporation.
Table of Contents
1 OVERVIEW ... 1-1 1.1 System Overview ... 1-1 1.2 Authorized User Permission ... 1-1 1.3 Points of Contact ... 1-1 1.4 Essential Terms and Concepts ... 1-2 1.4.1 What is an EnergyDirect.com Account? ... 1-2 1.4.2 Types of Account Users ... 1-2 1.4.3 Subscriptions: ... 1-6 2 ENERGYDIRECT APPLICATION GETTING STARTED ... 2-9 2.1 Logging On – EnergyDirect Welcome Page ... 2-9 2.1.1 Browser Requirements ... 2-9 2.1.2 New Users? ... 2-10 2.1.3 About Your Profile ... 2-11 2.1.4 Forgot Password? ... 2-13 2.2 Adding Accounts ... 2-13 2.2.1 Adding accounts to your profile ... 2-13 2.2.2 Entering Account Details ... 2-18 2.3 The Landing Page ... 2-20 2.3.1 Understanding the Basic Layout ... 2-20 2.4 Retrieving Accounts ... 2-22 2.4.1 To view accounts in your profile, complete the following steps: ... 2-22 2.5 Ready to Go ... 2-22 3 SYSTEM FUNCTIONALITIES ... 3-23 3.1 Viewing Billing Information ... 3-23 3.2 Viewing Interval Data Information ... 3-24 3.2.1 Graph and Navigator Band Interaction explanation ... 3-26 3.2.2 Trend Analysis ... 3-28 3.2.3 Selecting Individual Meter: ... 3-33 3.2.4 Statistics Summary Slide Out Report ... 3-34 3.3 Bill Allocation ... 3-35 3.4 Viewing RTP Prices and Using the Snapshot Generator ... 3-36 3.5 Printing Account Graphs and Tables ... 3-39 3.6 Downloading Report Data (detailed description and steps) ... 3-40 4 ACCOUNT MAINTENANCE ... 4-42 4.1 ACCOUNT DETAILS ... 4-42 4.1.1 Editing an Account’s definition or removing an Account ... 4-42 4.1.2 Controlling Account Access ... 4-43 4.2 Changing an Account’s viewing privileges ... 4-44 4.2.1 Changing Account privileges by changing an Account’s Subscription level ... 4-44 4.3 ALERTS ... 4-45 4.3.1 Viewing Alert Thresholds ... 4-45 4.3.2 Removing and adding alert criteria ... 4-46 4.4 User Metrics ... 4-47 4.4.1 Setting up User Metrics ... 4-47 4.4.2 Creating Metrics reports and Adding User Metrics graphs to Summary View ... 4-50
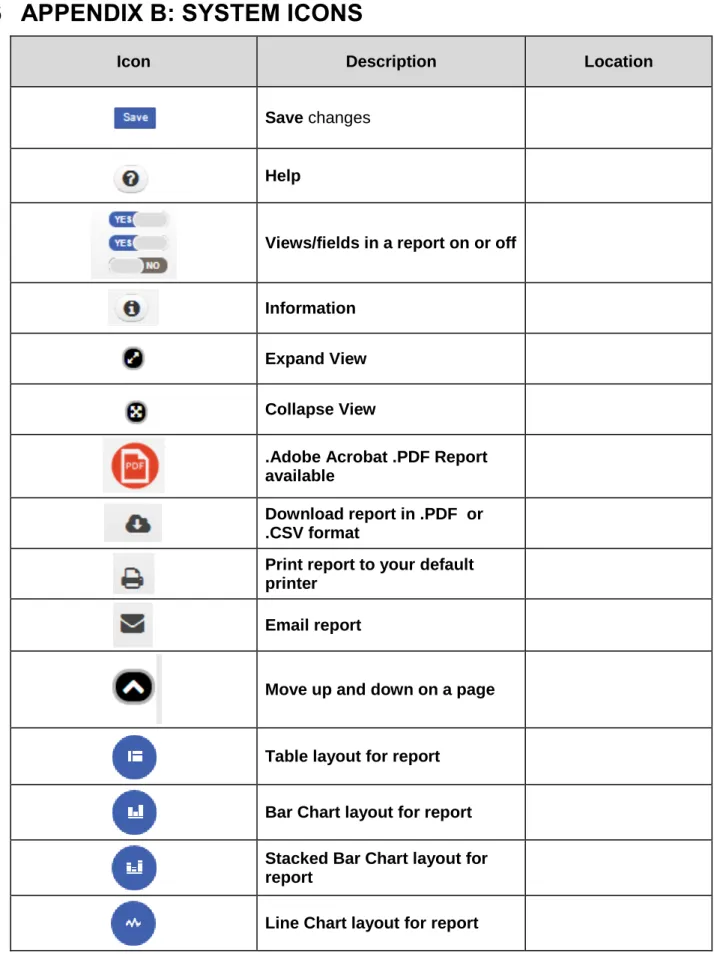
4.5 Creating and using Account Portfolios ... 4-55 4.5.1 Setting up a Portfolio ... 4-56 4.5.2 Using a Portfolio’s Summary View ... 4-57 4.5.3 Using other Portfolio Views ... 4-59 4.5.4 Printing Portfolio graphs and tables ... 4-59 4.5.5 Downloading Portfolio Reports ... 4-60 4.5.6 Editing a Portfolio ... 4-61 4.6 Defining an Account’s Summary View ... 4-61 4.6.1 What is in the Summary View? ... 4-61 4.6.2 Specifying the graphs that appear ... 4-63 5 ADDITIONAL FUNCTIONALITY ... 5-66 5.1 Message Center ... 5-66 5.1.1 Overview ... 5-66 5.1.2 Message Options-Schedules ... 5-67 5.1.3 Received Messages (Inbox/Notifications) ... 5-68 5.2 Maintaining your Profile ... 5-69 5.3 Contact Us... 5-69 5.4 EnergyDirect Premium RT (Real Time) ... 5-70 5.4.1 Getting to the Premium RT Information ... 5-70 5.4.2 Navigating Premium RT ... 5-71 5.4.3 Managing Alarms ... 5-72 5.4.4 Violation Reports ... 5-74 5.4.5 Manage Contacts ... 5-74 5.4.6 Manage Groups ... 5-75 5.4.7 The User Section ... 5-75 5.4.8 Additional Information ... 5-76 6 APPENDIX B: SYSTEM ICONS ... 6-78 7 APPENDIX C: GLOSSARY ... 7-80 8 INDEX ... 8-86
1
OVERVIEW
Thank you for using EnergyDirect.com!
The Web site is a valuable tool exclusively for Southern Company's business customers.
With this site, you can view your billing and energy usage information through charts and
graphs that you can customize for your particular needs. These analysis tools provide
valuable insights that let you track past and real time energy consumption, compare
usage between facilities, and make well-informed energy decisions.
This reference manual is designed to provide you instructions on how to use
EnergyDirect.com's many features. The tutorial is organized into the individual
task-oriented lessons below.
1.1 System Overview
EnergyDirect is an online energy management tool for business class customers. It enables you to access current and historical energy usage and cost information. The data that you access comes from stored records for your electric accounts and meters. It provides electric usage data combined with useful tools to analyze the effect of operating decisions to maximize cost savings. You can make informed decisions about your energy use and make the most from your energy purchase.
1.2 Authorized User Permission
Users of EnergyDirect must have an active business account within one of the Southern Company subsidiaries: Alabama Power, Georgia Power, Gulf Power or Mississippi Power. To access the account data through EnergyDirect, a user must register and account by providing profile information on the user, business and account specific information including the account number and web access code. For the protection of our user’s information, enhanced security measures have been implemented to include a formal approval process to the site information. More information on this process can be found in Section 4.1.
1.3 Points of Contact
For further information or assistance with EnergyDirect please use the following numbers to speak with one of our Customer Care representatives.
Alabama Power – #1-888-430-5787 (7:00am- 6:00pm) o Mail to: [email protected]
Georgia Power –#1-888-655-5888 (7:00am – 7:00 pm) o Mail to: [email protected]
o Mail to: [email protected]
Mississippi Power -#1-800-532-1502(7:30am – 5:30pm) o Mail to: [email protected]
Southern Company -#888-660-5890
o Mail to: [email protected]
1.4 Essential Terms and Concepts
This section will cover a few fundamental terms and concepts that you should know in order to use EnergyDirect.com effectively.
1.4.1 What is an EnergyDirect.com Account?
EnergyDirect.com lets you access current and historical energy usage and cost information online. The data that you access comes from stored records for your actual utility accounts and meters.
An EnergyDirect.com Account is EnergyDirect.com's fundamental management unit. Behind the scenes, each EnergyDirect.com Account is linked to the records for a single actual utility account and meter. However, an EnergyDirect.com Account puts a convenient and flexible face on the raw data. For example, for each EnergyDirect.com Account (from here on, simply called
Account), you can:
give the Account a useful name, such as "Decatur Warehouse."
decide how to view the usage and billing data behind the Account by choosing the particular customized graphs and reports that you want displayed
download or print displayed graphs and reports
be automatically alerted when usage or billing for an Account exceeds thresholds that you specify
real time alerts are available under the Premium RT Package
Note: Some features are only available for optional higher EnergyDirect.com subscription levels (as described in detail later in this lesson).
You decide which Accounts you want to include in your viewing list. Each time you sign in, EnergyDirect.com remembers and restores that list of Accounts and your preferred settings for each Account.
1.4.2 Types of Account Users
When an EnergyDirect.com Account is initially set up, the person who adds it becomes the
Primary User (the primary user should only be an employee of the company and not a contractor or consultant) for the Account. For example, the Primary User might be a company's Energy Manager, Owner, or Comptroller who sets up an EnergyDirect.com Account for each of the company's utility accounts and meters. The EnergyDirect.com Terms & Conditions require the primary user be an employee of the company.
facility type and facility square footage associated with the Account and set up the level of security linked to the account.
A Primary User on an Account has the following special capabilities:
Grants or Denies access to other users to access the account
Specifies the Subscription level of the account, which determines the features and viewing privileges that are available for the account.
How to Grant/Deny Access:
One way to grant account access to a user is to click Users & Permissions, type in user Name, Logon ID or email address and click Add User as shown below:
If a Secondary User requested access to the Account for which you are a Primary User (see “How to become a Secondary User on an Account”), you will receive an “Access Request” email:
Click Approve button to grant access to Secondary User or Deny to deny access.
This will take you to energyDirect.com Login page. Enter your logon User ID and Password and click” Log in”:
You will be presented with the page below. You can now close the browser window.
Another way to grant access to the Secondary User…Login to EnergyDirect.com and click Users & Permissions link in the left navigation bar for the Account for which Secondary User request access:
As a Primary User, you will be presented with the screen below. It will have a Pending access request from Secondary User.
Click Approve button (or Decline if needed) to grant user access to the Account.
Secondary User will receive an email notifying of access granted (or denied). This completes process of granting account access to the Secondary User. Account will be added to the Secondary User’s profile.
All other users on the Account are called Secondary Users. Each Secondary User has full viewing rights to all of the account's energy usage and billing information, and can establish their own Account name, set their own viewing preferences, and define their own custom reports (within the limits of the Account's Subscription level).
However, a Secondary User on an Account cannot change the Account's associated facility type or square footage, grant access to other users, or change the Account's Subscription level. As a Secondary User, before you can view information for your account you have to request account access and have it granted by the Primary User of the account. For steps on How to become a Secondary User on an Account see section 2.2.1 “Adding accounts to your profile”.
1.4.3 Subscriptions:
Subscription levels let you choose the features that you need. EnergyDirect has several account options tailored to meet your specific information needs.
Available Subscription Levels:
This no-cost package provides access to monthly and historical energy usage costs. This is useful in helping you make smart energy purchasing decisions, identifying usage and billing trends, and comparing facilities. Customers that have Accounts on a Real Time Pricing (RTP) rate can view their daily or hourly prices.
This optional package contains all of the features of the Standard package plus more available graphs, the ability to add Alert conditions and usage metrics and download historical energy usage in spreadsheet format. This lets you manage more complex energy purchases and easily identify exceptions for budgeting purposes.
This optional package contains all of the features of the Standard Plus package plus access to hourly usage information for previous month through meter reading. This "interval data" is useful for analyzing and comparing load shapes, tracking production trends, performing bill audits, and identifying energy efficiency opportunities. The Snapshot Generator serves as a planning tool to help assist you in planning your energy consumption. An account's energy usage and energy cost can be viewed
on an interval-by-interval basis. Accounts that have utility owned sub-metering can view usage from each individual contributor channel. The primary user on the account can also edit the channel name and give it a unique descriptor/name. The Bill Allocator can be used to allocate cost to different channels/departments based on usage or demand. This package requires special equipment called an interval meter.
This optional package provides a comprehensive set of options for viewing energy usage data. All of the features of the packages listed above are included. This package offers access to usage information as recently as the previous day. This information helps in measuring response to energy prices (RTP), verifying curtailment compliance, and auditing a facility's production performance. This package also requires special equipment called an interval meter.
This optional package provides the user with all the benefits of the packages listed above but adds the ability to look at usage in near-real-time. By installing additional equipment at the customer facility we can show usage for any pulse meter, set threshold alarms, all in near-real-time - as much as every five minutes this helps customers manage their load preventing a new billing demand from being set.
The Primary User for an Account has the opportunity to choose the initial Subscription level when they create the Account. Furthermore, only the Primary User can change an Account's Subscription.
Note: Your current Subscription for an Account may affect your use of this tutorial. For example, a lesson may describe tasks or features that are unavailable with your current Subscription.
2
ENERGYDIRECT APPLICATION GETTING STARTED
In this section, you will learn how to log on to EnergyDirect, Create a Username and Password, Retrieve a forgotten password, Become familiar with the defaulted site landing page, Adding accounts, Retrieving accounts, and Adding portfolio’s to your profile. Once you complete this set up process you will be ready to go!
2.1 Logging On – EnergyDirect Welcome Page
Access Energy Direct www.EnergyDirect.com
Get started by logging in and go.
Highlights of the Welcome Page:
Product Features
Plan and Price Comparison
Marketing Programs
Customer Testimonials
Secure Log In
2.1.1 Browser Requirements
EnergyDirect is supported by Internet Explorer version 9 and above including Edge as well as Google Chrome, FireFox and Safari. Users in IE versions below IE9 may
experience various issues and will need to upgrade their browser. As they attempt to log in to EnergyDirect, the following warning message will be displayed if their browser does not meet browser requirements:
2.1.2 New Users?
Get quick access by registering as a new user. Complete user profile information to
create a username and password for easy, quick account access. Tip: To bypass
this entry each time you access the account simply check the box located below the
field to save your username. For security purposes, your password will be required
each time you enter the site.
2.1.3 About Your Profile
Your EnergyDirect.com Profile, which you created when you first signed on,
contains important information about you that helps us to serve you better. Please
note that this information is stored on secure servers and is never shared with third
parties.
For us to continue serving you effectively, it is important that you maintain your
Profile information. For example, if your title, telephone, or email address changes,
you should update that information in your Profile.
To access and edit your Profile information, do the following:
1. Click your Name located on the top right corner of the page. Click User Settings
and your Profile information will appear.
3. You will prompted to log in again:
4. After logging in you will be presented with the page with your profile information.
Edit your profile, scroll down and click the Submit button:
5. Your profile is now updated.
2.1.4 Forgot Password?
Click on the Forgot Password link and it will take you to a new screen where you will enter your Username for which you would like to reset the password. After entering the name you will click the “Next >>” button. Internal Users will be asked to change their password using Control+Alt+Delete, External Users will be sent an email with the password reset.
2.2 Adding Accounts
When an account is setup in EnergyDirect.com for the first time you will be set up as the primary user allowing you to manage account. If the account is already in EnergyDirect.com and has a Primary user then you will be set up as a secondary user once the Primary user has granted you access to the account.
2.2.1 Adding accounts to your profile
Retrieve your account number (10 digit number) and access code (6 digit number) from you billing statement.
How to become a Secondary User on an Account:
If you already registered for EnergyDirect.com, log in to EnergyDirect.com and click Add Account link. If not registered yet, then create your profile and logon User Id as described in section 2.1.2 “New User?”.
Enter Account Number and Access Code (found on your monthly utility bill) for which an EnergyDirect.com Account already exists (because the Account has already been created by the person who is the Account's Primary User), click Next:
You will be presented with a screen below:
Primary User for the Account will receive an email with your request for access approval. Once account access is granted, you will receive Access Granted Confirmation email:
This completes adding Account to the Secondary User’s profile in EnergyDirect. As a
Secondary User, you can now view billing information and other information depending on the Account Subscription (see 1.4.3 Subscriptions section below).
Next time you log in to EnergyDirect.com you will get a notification in EnergyDirect – Number of Messages in the top navigation bar will be incremented by 1 as shown below:
This will notify you that the Primary User has granted you access to view the account.
You can now go into My Accounts, and the new account should appear in the account list:
2.2.2 Entering Account Details
Go to the Details located on the left navigation bar.Information and options that appear may vary slightly depending on whether an
EnergyDirect.com Account already exists for the Account Number and Account Access Code that you entered.
For example, if the Account already exists, the displayed information includes the name of the Primary User who "owns" the account. The sample below is for an existing account.
1. The Account Information and Utility Information sections show details from the utility account records for the Account Number and Account Access Code that you entered. Review this information to be sure this is the correct account. If it is not,
click and then select another account.
2. After confirming the correct utility account and meter are selected, enter a useful and descriptive name for the Account in the Account Description field. For example, an ACME Engineering account may have "ACME, Inc." on the electric bill, but you might want to call it "Consulting Division HQ."
3. If you are the Primary User for the Account, you can also edit the information in the
Square Footage. To do this, type the approximate square footage of the facility in the Sq. Ft. entry box if applicable (for instance, square footage would not apply to a meter for a pumping station).
Note. The Sq. Ft. entries will be used in future reporting and analysis features.
When finished entering any information, click .
Congratulations!
The Account is now added to your list (under Accounts in the Navigation Bar on the left side of the EnergyDirect.com page). Each time you sign in to our site, your full list of Accounts will appear. The new Account's currently defined Summary View appears in the main display panel. You can customize that view as described in the next lesson.
2.3 The Landing Page
2.3.1 Understanding the Basic Layout
* Specifics of this page will be covered in later tutorials. Once your user ID and password have been confirmed, you will enter EnergyDirect on the Billing Information page. This page is the defaulted landing page and will appear each time you log in to the site.
Account Specific Navigation Bar. Includes account actions: Billing Information, Interval Data, Snapshot Generator, Bill Allocation, Bill Estimation, Account Details, Alerts, Users and Permissions, Reports, Subscriptions, and RTP (if applicable).
Account User Setting Bar. This navigation bar includes user specific options such as an interactive Messaging Center (see section 5 for more information), Help Center, Contact Us links, Specific User Settings, and Logout Option. Highlighted in the red navigation includes your top 5 favorite accounts, options to view and add Portfolios and Accounts. Report and Charting Area. This area is defaults to General Billing Information. Default views can be modified and saved for quicker view when you enter the site the next time. In this area, you will utilize time controls to modify time periods, select the graph display format, download, Email or print the viewing information.
Account Detail Information. This displays account specific information such as subscription level, account, account representative, and most recent bill images.
B
A
C
D
A
D
C
B
2.4 Retrieving Accounts
Once accounts have been added to your profile you may begin to use the tools and features available to analyze your usage data. My accounts allow you to view one single account at a time. If you would like to view multiple accounts at one time a Portfolio will be required. (Please see Portfolios in 4.5 for more information.)
2.4.1 To view accounts in your profile, complete the following steps:
1) Select My Accounts from the top right red navigation bar.2) If you have more than one account in your profile, Accounts will appear in Alphabetical order. To View an account, simply hover your mouse over the account desired. A view button will appear on the account line.
3) Select View by clicking on the pop up view button.
4) Account will open to the Billing Information default landing page.
2.5 Ready to Go
By completing the above steps you have now successfully registered as an EnergyDirect user, created a unique username and password, added accounts to your profile, learned how to retrieve and view those accounts, and created portfolios for multi-site comparison. You are now ready to begin analyzing your electric usage.
3
SYSTEM FUNCTIONALITIES
3.1 Viewing Billing Information
The Billing Information page shows a table listing an Account's historical billing data. To view this page, do the following:
1. If the Account that you want to view Billing Information for is not selected, click on the name of that Account (under the My Accounts button in the Navigation Bar).
2. In the Left Navigation Bar, click
The Billing Information page appears. At the top of the page is a header showing the Account name, billing name and address, Customer Service contact, and Customer Primary Contact (Primary User for the Account). Below this header is a table of billing information, similar to the sample below.
If you like, you can change the type of information that is displayed and the time period for which it is displayed. To do this, use the Display and Time Period selection boxes to choose the
desired options, and then click the Submit button. If you want details about the information in the table, click the Explain Report link below the table.
A. Changes the different type of data to display.
Note: “Incremental Analysis” option is currently available only for GPC RTP accounts.
B. Changes how the data is displayed in the graph area, data view, bar chart, line chart, and area chart are the selectable options.
C. References the columns of data
a. You can click to sort by ascending or descending D. Display Options:
a. is the download feature, CSV or PDF file
Note: A PDF download is not available for reports with greater than 7 columns. b. brings up the print screen version of the data displayed
c. allows you to email your current view of the graph area d. allows you to change the settings of the current view
e. displays help options on the screen to better describe your current view
Note. The options that appear in the Display and Time Period drop down lists vary depending on the rate and Subscription for the Account.
3.2 Viewing Interval Data Information
Note. Interval data viewing features require a subscription level of Premium or higher and special equipment called an "interval meter". To upgrade to an interval meter, please contact your
Interval Data is a history of the electrical usage for a facility as recorded by a special interval meter. Typically, the meter records the usage in 15, 30 or 60 minute intervals. The meter
measures the usage (in kWh) constantly. After the interval ends, the meter stores the number of kWh of energy in a file. By the time you see the information, it is usually converted into a kW value for each interval.
Not all meters are capable of measuring every interval of information. Some meters can only record the total energy (kWh), and some meters can only record the single highest peak kW for the month.
An interval meter will record the kW value for each interval in the billing period. Some rates need all of this information, but some rates do not. In the same way, not all customers need access to the individual interval data. Some customers only want the summary data, like you would find on a bill.
To view interval data for an Account, do the following:
1. If the Account that you want to view Interval Data for is not selected, click on the name of that Account (under the My Accounts button in the Navigation Bar).
2. In the Left Navigation Bar, click Interval Data under the Billing Information arrow dropdown.
The Interval Data page appears. At the top of the page is a header showing the Account name, billing name and address, Customer Service contact, and Customer Primary Contact (Primary User for the Account). Below this header is a set of display controls and a graph, similar to the sample below:
If you like, you can change the type of information displayed and the time period for which it is displayed. To do this, use the Left Axis and Right Axis selection boxes to change the type of information that is displayed. You can choose between kW, kW and CBL, kVA, kVAR, and Power Factor on the Left Axis. The Right Axis, allows you to add Temperature, RTP Prices, and
Historical Load Data to the Report. To adjust the time period displayed, use the Calendar buttons below the Display Dropdown box.
If you have an account with multiple billing channels behind primary meter, you can choose to view these channels individually by clicking on the wording (not clicking the check box) of one from the 'Source Box' below the Time Period control panel. The data displayed will be for that channel/meter only.
3.2.1 Graph and Navigator Band Interaction explanation
Translated into words it means: For graphs > (Day Range Start) to <= (Day Range End), the data will be displayed as (Rollup).
If you select 6/1 – 6/23, the navigator will be rolled to hourly (although you will see it as days) and you will see navigator load shape as hourly. *The start and stop date control the navigator only.* The chart will be determined by the column “SHOW” and the interval
range associated w/ “SHOW”. In the example I just gave (6/1 – 6/23) SHOW will be 1 day. Logic is applied to find the most granular rollup based on “SHOW” and “MAX SELECT”. *The navigator selector bands determine the chart rollup.*
plotted points exceeds (Max # Selected). Once (Max # Selectable) is exceeded the data will roll up to the next level. However; not necessarily the “next” level. It could skip a level depending on max select. Logic will find most granular rollup for the selected range. If the user contracts the bands, the system will adjust to provide the most granular rollup
level that can be displayed.
If you hover cursor over the data point on the graph, it will display a box with description of what the data point represents: the value, the date/time stamp, if it represents Actual or calculated Average value, and the name of the determinant (e.g., <Meter #>-KW-TOT, RTP Price, etc.).
Graph on Interval Data page will display raw interval data only Level 1: Zero – 2 days
o Georgia Power Company shows 24 hours and hour intervals on X Axis, 30 minute intervals on the line graph and in the table with one full day in the navigator. Clicking on the Peak doesn’t drill in to a lower level.
o Georgia Power Company shows 48 hours and hour intervals on X Axis, 30 minute intervals on the line graph and in the table with one of the 2 days highlighted in the navigator (the one with the peak). Clicking on the Peak doesn’t drill in to a lower level.
Level 2: 2 to 31 Days
o Georgia Power Company shows 6 days and hour intervals on X Axis, 30 minute intervals on the line graph with the day with the peak shown 6 full days in the navigator with the focus on the day with the peak. Clicking on the Peak doesn’t drill in to a lower level. Clicking on the Peak doesn’t drill in to a lower level.
o Georgia Power Company shows 4 weeks (5/25-6/26) 31 days and 2 day intervals on X Axis, day intervals on the line graph with the month with the peak showing 2 days intervals in the navigator with the focus on the month with the peak. Clicking on the Peak drills in to the day with the peak shown with 30 minute intervals and the X Axis is now hours for the day with the peak. The Navigator is now showing 5 days with focus on the one day with the peak
o Georgia Power Company shows 12 months (7/1/13-6/27/14) and daily intervals on X Axis, with day intervals on the line graph with the day with the peak day shown. 12 full months in the navigator with 18-19 day tick marks with the focus on the month with the peak. No drill done yet
o Clicking on the Peak drills in to the day with the peak shown with 30 minute intervals on the line graph and the X Axis is now hours for the 24 hours with the peak. The Navigator is now showing 12 months with focus on the 18 day window with the peak
Level 4: 365 to 1,000 days
o Georgia Power Company shows 26 months (5/1/12-6/27/14) with weekly intervals on the X-Axis and on the line graph. 26 months shown on the Navigator with 2 months highlighted. Peak displayed as 7/22/12 @ 12am
o Clicking on the Peak the first time drills in to the day level with the peak shown with day intervals on the line graph and the X Axis is now days for the month with the peak. The Navigator is now showing 26 months with focus on the 2 week window with the peak
o Clicking on the Peak the second time drills in to the day with the peak shown with 30 minute intervals on the line graph and the X Axis is now hours for the 24 hours with the peak. The Navigator is now showing 26 months with focus on the 2 week window with the peak
Level 5: 1,000 – 3,650 days (show12 months –focus peak 1-max select 120)
o Georgia Power Company shows 40 months (4/28/2011-7/29/2014) with weekly intervals on the X-Axis and on the line graph. 40 months shown on the Navigator with 12 months highlighted. Peak displayed as 7/22/12 @ 12am
o Clicking on the Peak the first time drills in to the day level with the peak shown with day intervals on the line graph and the X Axis is now days for the month with the peak. The Navigator is now showing 40 months with focus on the 2 week window with the peak
o Clicking on the Peak the second time drills in to the day with the peak shown with 30 minute intervals on the line graph and the X Axis is now hours for the 24 hours with the peak. The Navigator is now showing 40 months with focus on the 2 week window with the peak
3.2.2 Trend Analysis
To view the Trend Analysis information select the ‘Trend Analysis’ tab on the right side of the page. This tab presents the load shape using raw interval data for selected dates and determinants for the left and right Y-axis.
3.2.3 Selecting Individual Meter:
If you have an account with multiple billing channels behind primary meter, you can choose to view these channels individually and compare it to the Total by clicking on the check box (not clicking the wording) of one from the 'Source Box' below the Time Period control panel. The data displayed will be for that channel/meter only.
To edit the Channel names to something more meaningful to you, simply choose 'Set-up', then 'Channel Edit'. Only the account's Primary User or the Client Manager on the account will be able to edit the Channel Name field.
3.2.4 Statistics Summary Slide Out Report
Click the Statistics tab on the right side of the pain. See sample image below.
The Statistics Summary slide out will give you details into the interval data you currently have displayed, such as: Bottom 3 maximum and minimum values; the average; total duration hours; total for that time frame, historical 3 year date range; etc. Note: if you have one or more meters or demands shown, they will be shown in the Statistics pop up.
3.3 Bill Allocation
The Bill Allocation feature will allocate cost to your various channels/departments based on usage or demand. This feature is available with Premium or higher subscription packages.
To view the Bill Allocation page, do the following:
1. If the Account that you want to allocate is not selected, click on the name of the Account (under the My Accounts link in the top right Navigation Bar).
2. In the left Navigation Bar, click Bill Allocation under the Billing Information arrow dropdown.
The Bill Allocation page appears. At the top of the page is a header showing the Account name, billing name and address, Customer Service contact, and Customer Primary Contact (Primary User for the Account). Below this header is the Bill Allocation report, similar to the sample below.
If you like, you can change the information that is displayed in the report:
To choose the monthly bill you would like to allocate, use the Amount For drop down. Choose to allocate the amount among your utility channels based on energy in kWh or by
Last, you may choose to allocate based on the usage during the utility billing period (default dates) or choose custom dates to match your production or accounting period. Click the 'Refresh Chart' button to generate the new report.
Note: The range of data is unlimited.
Click the 'Refresh Chart' button to generate the new report.
3.4 Viewing RTP Prices and Using the Snapshot Generator
Customers on a Real Time Pricing Tariff (RTP) can check their Day Ahead and Hour Ahead prices on the RTP prices page. The RTP page is available with all five subscription packages. To view this page, do the following:
1. If the Account that you want to view RTP prices for is not selected, click on the name of that Account (under the My Accounts link in the top right Navigation Bar).
2. In the left Navigator Bar, select the RTP link. (If you do not see the RTP link, it may be because your user ID has not been given RTP rights. To get RTP rights for your user ID, contact your Client Manager or customer service).
The RTP Page appears and will automatically be refreshed every 30 minutes while being displayed on the screen. At the top of the page is a header showing the Account name, Billing name and address, Customer Service contact and Customer Primary Contact (Primary User for the Account). Below this header is a table of current day price
information. On the right, there will be a graph of current day price information as well as next day's price information, similar to the sample below.
To view past or future prices, simply select a different day using the Calendar Selection tool. To download RTP Prices, click the icon and select the Historical Prices drop down as seen below.
To download past or future prices, simply select a different day using the Calendar Selection tool seen below. Please note the special instructions on the Historical Pricing pop up page for the different download formats, also seen below.
To view actual energy, baseline energy, incremental energy, and incremental cost, all in one report, click Snapshot under the Billing Information arrow dropdown, in the left Navigation Bar.
Note. The Snapshot Generator is only available with the Premium and Premium Plus subscription packages.
The Snapshot Generator page appears, detailing a monthly summary report, similar to the example below.
To view past data, simply select a different date range using the Calendar Selection tool and click the Submit button.
To view a more detailed, hour ending report of a single day, simply click on the highlighted day to drill down. Or, select that day using the Calendar Selection tool, click on the 'Detailed Report' radio button and click the 'Refresh' button to generate a new report.
3.5 Printing Account Graphs and Tables
EnergyDirect.com offers a print-ready version of the following Account views:
Summary View Billing Information Interval Data Bill Allocator RTP Prices Snapshot Generator
To access the print-ready view, first display the desired account screen above. Then, select the icon in the upper right hand corner of the screen where the following icons are located
.
print-ready view shows the account header in the upper left corner. For your company's security, a special footer also appears that lists the person who printed the report and the Account's Primary User.
To print a hardcopy of this view, select "Print" from the "File " menu, or click on your browser's printer icon.
3.6 Downloading Report Data (detailed description and steps)
EnergyDirect.com offers the option of downloading data from the following Account views to a file on your computer:
Billing Information
Interval Data
Bill Allocator
RTP Prices
Snapshot Generator
In the case of graphs, the data used to generate a graph is downloaded. In the case of a table (like the Billing Information view), the data in the table is downloaded.
To download data from a view, first display the desired view in the main EnergyDirect.com
screen. Then, click the icon in the upper right hand corner of the screen where the following
icons are located .
To Download a CSV file:
You will see a pop up once the Download Icon is clicked, select the CSV option. Shown in the sample image below.
Depending on the version of Windows you are on, the download may either be a pop up screen or be shown at the bottom of your screen. Follow the usual steps you would normally follow when opening or saving a downloaded CSV file.
To Download a PDF file:
You will see a pop up once the Download Icon is clicked, select the PDF option. Shown in the sample image below.
Once PDF is clicked, the PDF report will open in a separate browser tab. You can then save the PDF from there or print if you wish.
4
ACCOUNT MAINTENANCE
4.1 ACCOUNT DETAILS
4.1.1
Editing an Account’s definition or removing an Account
You may change the name of an Account or remove an Account from your list of Accounts. If you are the Primary User for the account, you may also change the type of facility and the square footage. To make such changes, do the following:
1. If the Account that you want to edit is not selected, click My Accounts in the top right Navigation Bar.
3. Make desired changes to the Account as follows:
To change the Account name, click the Edit button, enter the new Account name and press Save.
To change the square footage (only if you are the Primary User), click the Edit button next to the Square Footage field, then type the new square footage of the facility and then press Save.
To Upload a Logo to the Account, click the Upload button below the current Logo, select Browse in the pop up window, find the file you want, upload it and then press save.
4.1.2 Controlling Account Access
If you are the Primary User of an Account, you can add or remove authorized users who have access to the Account, as follows:
Important. Before you can grant access to new user, they must have already accessed EnergyDirect.com and signed up as a new user. To grant them access to an Account, you will need to know the EnergyDirect.com User ID that they use to sign in.
1. If the Account that you want to edit is not selected, click My Accounts in the top right Navigation Bar, click on the name of the Account.
2. In the left Navigation bar, click Users & Permissions. The Users & Permissions page appears, similar to the sample below.
3. Add or remove users as follows:
To terminate access to the Account for a current user, click Delete button for the appropriate user. The User Name disappears from the list.
Note. Terminating a user's access to an Account does not prevent the user from logging in to EnergyDirect.com. Instead, it simply removes the Account from the user's list of Accounts.
To grant access to a new user, enter the User ID of the new user in the Add User field, once you select the new User, click the + Add User button. The Grant Access to
Additional Users section expands to offer new options, as described next.
4.2
Changing an Account’s viewing privileges
4.2.1
Changing Account privileges by changing an Account’s
Subscription level
From time to time you may want to upgrade or downgrade your EnergyDirect.com subscription level for an Account. However, only the Primary User of an Account can change its subscription level. This is accomplished as follows:
Note. If you are not the Primary User for an Account, click the Primary Contact link on this page to initiate an email to the Primary User to request a subscription change.
1. If the Account you are changing the Subscription for is not selected, click the name of that Account (in the My Accounts button in the top right Navigation Bar).
2. In the left Navigation Bar, click Subscription. The Subscription page appears, similar to the sample below.
3. You can now proceed in either of the following ways:
If you already know which Subscription package you want, click on the desired news
Subscription box, and then click the Upgrade or Downgrade button that appears next to the Subscription Price.
Subscription box you wish to learn more about. You will notice the Subscription box
you chose now has the ability to scroll down/up to display more detailed information. You can see this in the sample image above, in the Premium Real Time Subscription box.
Once you click the Confirm Order button, the Subscription change for this Account is submitted. The new privileges become effective immediately (except previous day Interval Metering, if applicable, may take a few days to become available). The billing amount will become effective the first of the next month unless you entered a Promotional Code that delays initial billing.
Note. If the Primary User for an Account changes the Subscription, it affects the viewing privileges of all Secondary Users with access to the Account. These Secondary Users view the Account information through the Subscription package chosen by the Primary User. If the Primary User upgrades his Account, all Secondary Users will have access to the added information that comes with the higher Subscription.
4.3 ALERTS
4.3.1 Viewing Alert Thresholds
Note. Only Accounts with a Subscription level of Standard Plus or higher support the Alerts feature. To upgrade an Account's Subscription see section 4.2 for more information.
The Alerts Setup page appears, similar to the sample below.
At the top is the name of the Account for which you are setting Alert options. The Alerts section lists all alert thresholds that are currently defined for this Account. After the Account goes through billing each month, we evaluate your defined threshold criteria against actual data values for the month. If a value meets your threshold criteria, the Account is flagged with a corresponding alert. The next time you sign in, any Accounts with alerts appear when you click the Alerts button in the left Navigation Bar. Clicking the Account Name displays the alerts.
The alerts for an Account also appear in the Account's Summary View.
You can remove and add alert criteria as described next. At this time, the Alerts feature is only real time with Premium RT level (see lesson 10 for Premium RT information) and does not send you a page, email or other real time notification.
4.3.2 Removing and adding alert criteria
Note. Only Accounts with a Subscription level of Standard Plus or higher support the Alerts feature. To upgrade an Account's Subscription see section 4.2 for more information.
Use the Alerts page to remove and add alert thresholds as described below.
To remove a currently defined alert threshold
Click related to the appropriate Alert threshold.
The removed alert will not be triggered in later months even if the account exceeds the previously defined threshold.
To define a new alert threshold
1. Click on the Data Field selection box and, in the drop down list, choose the type of measurement that should be compared.
2. Click on the Operator selection box and, in the drop down list, choose the type of comparison that should be used.
3. In the Threshold selection box, enter the threshold value that the selected type of measurement should be compared against.
4. When all criteria are set, click the button.
To edit an existing alert threshold
Click next to the threshold, edit the Alert and click Save.
The changes in alert criteria are now set and will be evaluated after the next billing cycle.
4.4 User Metrics
EnergyDirect.com's User Metrics feature lets you compare energy usage to your production data, or to any other metric that is important to you in the way that it affects your energy usage. For example, you can set up User Metrics that causes EnergyDirect.com to create a graph comparing energy dollars per ton of widgets produced, or energy use per hospital bed.
Note. Only Accounts with a Subscription level of Standard Plus or higher support the User Metrics features. To upgrade an Account's Subscription see section 4.2 for more information.
4.4.1 Setting up User Metrics
2. Make sure is selected for the data to be displayed:
3. On the right side of the page you will see the following icons:
5. Click
The User Metrics Setup page appears, similar to the sample below.
6. In the Name field, type a descriptive name for the report (for example, "Production Efficiency").
7. In the Unit of Measure field, type the appropriate unit (such as "tons of widgets"). 8. Enter the first piece of historical data as follows:
o In the Quantity box, enter the number of units of the item for that month and year (for example, if the plant built 5345 tons of widgets that month, enter 5345).
o Click on the Start Date box and choose the month and year for which you wish to enter data.
o In the Quantity box, enter the number of units of the item for that month and year (for example, if the plant built 5345 tons of widgets that month, enter 5345).
o Click the save button. It appears in the Report Dropdown section. 9. To Add or Edit a New Record to an existing report:
o Click the Expand/Collapse “triangle” as shown in the image below.
o Follow the instructions from step 8 to fill out a new record
o Click the button to save the new record.
o To update and existing record, click the Edit button shown in the image above.
o Edit the appropriate fields, when finished click the button.
You can now create Metrics reports using the metric just created and add User Metrics graphs to Account's Summary View, as described next.
4.4.2 Creating Metrics reports and Adding User Metrics graphs to
Summary View
After adding your User Metrics Data for an account, you can create User Metrics reports as follows:
1. If the correct Account is not selected, click on the name of that Account in the My Accounts drop down in the top right Navigation bar.
2. Click User Metrics link in the left navigation bar – see steps 1 and 2 in the previous section 4.4.1 Setting up User Metrics.
3. Make sure that Metrics Template is displayed in the dropdown list - see step 2 in the previous section 4.4.1 Setting up User Metrics.
Note. “Metrics Template” is a global report which should be used as a starting point for ANY user defined Metrics report. Please be sure to create your own local copy of the “Metrics Template”
before adding metrics to report. “Metrics Template” has two predefined columns as show below – Total kWh and Average Cost. Any user can add up to five report columns with values derived from the custom User Metric:
User Metric itself $/User Metrics kWh/User Metric User Metric/$ User Metric/kWh.
You can use only ONE metric for each report. If you want to use another metric for the same account, you have to create a separate Metrics report.
4. Click the “Cogwheel” located on the right side of the page. Then click Axis. 5. Click Save New Report to create your local report copy.
6. When prompted type in your report name and click Save.
7. You will be presented with a User Metrics page with your local Metrics report Name displayed in the dropdown list as shown below. Click the “Cogwheel” located on the right side of the page. Then click Axis.
8. You are now ready to start adding metrics report columns. 9. At the bottom of the page Click + Add Data:
10. This will display a list of report columns available for your metrics:
11. Select the column you would like to add to your metrics report, one at a time. Then click
Add Data again. Repeat this step as many times as needed. 12. You will see selected metric column(s) displayed as shown below:
13. Click Update to save changes to your local My Metrics Report. It will display your metrics report as shown below:
15. Your report will now be selectable from the Summary View drop downs. See image below.
Note. For a detailed description of each graph type, see the online Help.
Important. Remember that you should continue entering new metrics data each month to keep your User Metrics graphs current. To do this, use the + Add New Record section of the User Metrics page (accessed by selecting the Account and then choosing the “Cogwheel”
then selecting User Metrics in the dropdown).
4.5 Creating and using Account Portfolios
You can optionally organize Accounts into custom collections called Portfolios. For example, you might set up Portfolios by facility type, such as "Warehouses" and "Sales Offices", or by
geography, such as "Atlanta Sites" and "Decatur Sites." You have complete flexibility to decide. By grouping several Accounts into a Portfolio, you also get special reporting options that compare or total energy usage and billing information across the Accounts. Please note that Portfolios are only available with Standard Plus and higher subscription packages.
4.5.1 Setting up a Portfolio
1. In the top right Navigation Bar, click My Accounts.
2. The My Accounts page appears, similar to the sample below. Your available accounts will be listed.
Click the check box for corresponding boxes for the accounts you want to add to the portfolio.
Then click the +Add Portfolio button in the top right.
In the entry box that pops up, type a useful and descriptive name for the Portfolio (such as "Manufacturing" or "Atlanta Facilities").
Then click Save
3. The Available Accounts section lists all Accounts that are available to be added to this Portfolio. To add an Account, check the corresponding boxes for the accounts you want to add to the portfolio in the Available Accounts section. The Account appears in
the Accounts in Portfolio section, which lists all Accounts in this Portfolio. 4. If you inadvertently add the wrong Account, you can remove it by:
Click the expand/collapse triangle on the left of the page.
Press the X Delete button in the Portfolios’ section of the expanded account for the
Note. If an account without interval data is combined in a portfolio with an account that does have interval data, the accounts without interval data will register a zero on the graph.
The Portfolio is now added to your list (under MyPortfolios in the top right Navigation Bar). The new Portfolio's Summary View appears in the main display panel.
4.5.2 Using a Portfolio’s Summary View
To display the Summary View for a particular Portfolio, do the following: 1. Click My Portfolios in the top right Navigation Bar
2. In the list of Portfolios, hover over the Portfolio for which you want to display the Summary View. Click the View button when it appears. Sample image below.
4. To change the chart type(between Table, Column, Line and Area), click the . A drop down will appear, like the image shown below.
5.
For each graph category, there are two graph types - Stack and Group. The Stack option displays a cumulative version of the graph in which each Account's graphed amount is stacked on the others. The Group option displays a comparative version of the graph in which each Account's graphed amount is placed beside the others.
If you want details about the information in a displayed graph, click the Explain Graph link below the graph.
Note. The information appearing in a Portfolio view is limited by the Account in the Portfolio with the lowest viewing privileges (i.e., the lowest Subscription). For example, if an account without
interval data is combined in a portfolio with an interval data account, the accounts without interval data will register a zero on the graph.
4.5.3 Using other Portfolio Views
In addition to the Summary View for a Portfolio, EnergyDirect.com offers two other views:
Billing Information view (cumulative for all Accounts in the Portfolio)
Interval Data view (cumulative for all Accounts in the Portfolio; this requires an interval meter and a Premium or higher Subscription for all accounts in the Portfolio)
Note. The information appearing in a Portfolio view is limited by the Account in the Portfolio with the lowest viewing privileges (i.e., the lowest Subscription). For example, if an account without interval data is combined in a portfolio with an interval data acount, the accounts without interval data will register a zero on the graph.
To display these views for a particular Portfolio, do the following: 1. Click My Portfolios in the top right Navigation Bar
2. In the list of Portfolios, hover over the Portfolio for which you want to display the Summary View. Click the View button when it appears.
3. In the Portfolio Menu Bar at the top of page, click either or
to choose the desired view.
The controls in the Billing Information and Interval Data views operate just like their counterparts for an Account.
4.5.4 Printing Portfolio graphs and tables
EnergyDirect.com offers a print-ready version of the following Portfolio views:
Summary View
Billing Information
Interval Data
To see the print-ready view, first display the desired Summary View, Billing Information, or Interval Data for the Portfolio in the main EnergyDirect.com screen. Then, select the icon in the upper right hand corner of the screen where the following icons are located
The print-ready information will appear in a separate window, just as it does for print-ready views for an Account. To print a hard copy of this view, please select "Print" from your browser's "File" menu, or click on your browser's "Print" icon.
4.5.5 Downloading Portfolio Reports
EnergyDirect.com offers the option of downloading data from the following Portfolio views to a file on your computer:
Summary View
Billing Information
Interval Data
In the case of graphs, the data used to generate a graph is downloaded. In the case of a table (like the Billing Information view), the data in the table is downloaded.
To download data from a Portfolio view, first display the desired view in the main
EnergyDirect.com screen. Then, click the icon in the upper right hand corner of the screen
where the following icons are located .
To Download a CSV file:
You will see a pop up once the Download Icon is clicked, select the CSV option. Shown in the sample image below.
Depending on the version of Windows you are on, the download may either be a pop up screen or be shown at the bottom of your screen. Follow the usual steps you would normally follow when opening or saving a downloaded CSV file.
To Download a PDF file:
You will see a pop up once the Download Icon is clicked, select the PDF option. Shown in the sample image below.
Once PDF is clicked, the PDF report will open in a separate browser tab. You can then save the PDF from there or print if you wish.
4.5.6 Editing a Portfolio
You can change the name of a Portfolio and also change the Accounts that it contains, as follows: 1. Click My Portfolios in the top right Navigation Bar
2. In the list of Portfolios, hover over the Portfolio for which you want to Edit. Sample image below.
3. Make desired changes to the Portfolio as follows:
4. To change the Portfolio name, hover over the Portfolio’s Name field, click the Edit
button. Change the name to what you want, when finished, click the save button
5. To add an Account, hover over the Portfolio’s Accounts field, click the Edit button. An expanded Accounts section will appear. Click the + Add New Account button. An account search pop up will appear, search for your account, when found select the account and then press the Update button.
6. To remove an Account, Press the X Delete button in the expanded Accounts section for the appropriate Portfolio you want the account removed from.
7. If you want to remove an Entire Portfolio, click the check box of the Portfolio you wish to be deleted. Then press the Delete button in the top right corner.
4.6
Defining an Account’s Summary View
4.6.1 What is in the Summary View?
1. If the Account that you want to view is not selected, click My Accounts in the top right Navigation Bar, click on the name of the Account.
2. In the left Navigation bar, click the Billing Information drop down, then click Summary View. The Summary View page appears, similar to the sample below.
An Account's Summary View gives you a view of key metrics for the Account. A sample appears below:
The screen shows the following:
Graphs. A user-specified set of 4 graphs that show monthly billing and usage information for the Account. The 4 graphs default to: Electric Service Total; Demand Report Summary; Average Cost Summary; and Energy Use Summary.
You can customize the set of graphs that appear. For Accounts subscribed to the Standard Plus package or higher, you can also customize the alarm thresholds that are used to determine when Alerts appear.
Note. Customization that you perform only affects your views of the Account, which are stored for your next visit. Other users who share the Account are not affected since they have their own stored view options.
4.6.2 Specifying the graphs that appear
1. If the Account that you want to view is not selected, click My Accounts in the top right Navigation Bar, click on the name of the Account.
2. In the left Navigation bar, click the Billing Information drop down, then click Summary View. The Summary View page appears, similar to the sample below.
3. For certain graphs, after you change the report you will need to change the determinant, example shown in the image below.
4. To change the type of graph displayed click the icon being pointed to in the image below and click the appropriate graph in the pop up
5. To change the date range for the date use the calendar icons next to the Start and Stop dates, when finished with the date range click .
Note. For a detailed description of each graph type, see the online Help. Also, note that the User Metric Graphs are optional custom
5
ADDITIONAL FUNCTIONALITY
5.1 Message Center
5.1.1 Overview
Click Messages in the top header bar.
The Messages page appears, similar to the sample below.
When you receive a new Message you will see the number of new Messages that you have above the Messages in the top header bar.
When you open the Message page, you will notice the new Message will pop up in the appropriate Message Areas.
Notifications, Inbox, Alerts, Requests; Sent and Schedules are available to be managed in Messages.
You will notice the majority of the screen is filled with one of the above Message options. To make one of the 5 selections on the right the main selection, click the appropriate
button. Once a Message option is the main selection, it will have more options available. More Message options will be explained in further detail in the next section.
5.1.2 Message Options-Schedules
When Schedules is selected, all Alerts for all of your Accounts will appear in the majority of the screen. Sample image shown below.
You will notice that this display shows the frequency of each Alert. From this view you can delete an Alert by pressing the button.
5.1.3 Received Messages (Inbox/Notifications)
You will notice when you select a received message you will have two options appear in the top right of the Inbox display. Sample image shown below.
To forward the message to another person, click the Forward button. A screen similar to the one below will appear.
Fill out the To field with the appropriate email address. If you would like to include a message with the Forward, fill in the Additional Message field.
5.2 Maintaining your Profile
Your EnergyDirect.com Profile, which you created when you first signed on, contains important information about you that helps us to serve you better. Please note that this information is stored on secure servers and is never shared with third parties.
For us to continue serving you effectively, it is important that you maintain your Profile
information. For example, if your title, telephone, or email address changes, you should update that information in your Profile.
To access and edit your Profile information, do the following:
1. Click your Name located on the top right corner of the page. Click User Settings and your Profile information will appear.
2. Edit the information as needed (scroll down to access the last few fields). 3. After editing is complete, scroll down and click the Save button.
Your profile is now updated.
5.3 Contact Us
The Contact Us menu provides a means of communicating Bugs and Suggestions as well as sending an email to the Project Management Team with EnergyDirect.
1. Select the Contact Us Menu, select Bugs and Suggestions
2. Users can search for existing suggestions or submit new suggestions for the Project Management Team.
The Search Suggestions field will allow users to search for any existing suggestions already submitted to the Project Managers at EnergyDirect.
3. To submit a new suggestion - Enter a title in the Subject field, followed by adding the suggestion in the ‘Your Suggestion’ area. After the information has been entered select the
appropriate radio button to show if the suggestion is a Bug .
4. To send an email to the Project Manager Team – Select the Contact Us Menu, select Email Us. The Microsoft Outlook application will be displayed with the appropriate email address pre-populated.
5.4 EnergyDirect Premium RT (Real Time)
The Premium RT package allows customers to view their energy usage in near Real-time. Using a device installed at the meter, called a Gateway, we can monitor the pulse outputs of that meter and display those outputs as much as every five minutes. Customers can now manage their usage demand and take action before a new demand
5.4.1 Getting to the Premium RT Information
EnergyDirect Premium RT will open in a new window
5.4.2 Navigating Premium RT
The Left Tool BarUsing the Left tool bar you can look at the data for
Electric Usage
1. Average Demand
When you log into the RT site the above screen will pull up. It is an average demand over the time period selected for each data point.