GeoGraphic information SyStem of
cardiac rehabilitation ServiceS for
aboriGinal and torreS Strait iSlander peopleS
© Australian Government 2007
Paper-based publications
This work is copyright. Apart from any use as permitted under the Copyright Act
1968, no part may be reproduced by any process without prior written permission
from the Commonwealth available from the Attorney-General's Department. Requests and inquiries concerning reproduction and rights should be addressed to the
Commonwealth Copyright Administration, Attorney General's Department, Robert Garran Offices, National Circuit, Canberra, ACT, 2600 or posted at:
http://www.ag.gov.au/cca ISBN Print: 1864963336
To obtain details regarding NHMRC publications contact:
Email: nhmrc.publications@nhmrc.gov.au
letter of introduction from ceo
Improving the health of all Australians is a primary focus of the NHMRC and with coronary heart disease being identified as the largest single cause of death for Aboriginal and Torres Strait Islander People, a proactive approach to combating this growing health problem was a priority.As part of its strong commitment to improving Aboriginal and Torres Strait Islander health, the NHMRC has developed this report as part of a set of resources that aim to assist health professionals working with Indigenous Australian patients who have experienced a cardiac event.
The expert Working Committee responsible for developing these materials has made a significant contribution to the future health of Aboriginal and Torres Strait Islander Peoples. It has provided a model of how Indigenous Australians and non-Indigenous Australians can work together to create opportunities for improving health services for Aboriginal and Torres Strait Islander Peoples. It has conducted considerable research into available services and produced clear, practical guidance on how best practice in this area of health service delivery could be achieved.
I commend this report and the whole NHMRC cardiac rehabilitation package to all Australian health professionals, whether they work in urban, regional or remote areas.
Professor Warwick Anderson Chief Executive Officer
Welcome meSSaGe
this package can help you to improve outcomes
among your aboriginal and torres Strait islander patients
It is well known that Aboriginal and Torres Strait Islander Peoples experience much higher death rates from coronary heart disease than other Australians. A recent report from the Australian Institute of Health and Welfare1 found compelling evidence of disparities that contributeto these higher death rates. Compared with other Australians, Indigenous Australians are considerably more likely to have a heart attack, and to die from it whether they are admitted to hospital or not. If in hospital, they are also less likely to receive common procedures such as coronary bypass surgery or angioplasty.
Compounding this picture of health inequalities, it is clear that
Indigenous people who survive a major coronary event such as a heart attack are also much less likely to attend a cardiac rehabilitation program than other Australians. Cardiac rehabilitation is an important part
of secondary prevention of coronary heart disease, aiming to give people the confidence, motivation and skills to make a lifelong commitment to a healthy lifestyle and greater well-being.
The materials in this package will assist health professionals and health services to actively contribute to improving cardiovascular outcomes among Aboriginal and Torres Strait Islander patients.
❖ A practical guide —Strengthening Cardiac Rehabilitation and
Secondary Prevention for Aboriginal and Torres Strait Islander Peoples:
A Guide for Health Professionals
— the guide provides advice and tools for each stage of cardiac
rehabilitation, from diagnosis of heart disease to secondary
prevention and self-management.
❖ A Cardiac GIS — this interactive geographic information system
(GIS) is a computer-based visual aid that can help you
to find the best services for Indigenous patients with
heart disease.
❖ A Final Report — this report details the methods, analyses and key findings of the Cardiac GIS project.
1 AIHW (2006) Aboriginal and Torres Strait Islander Peoples with Coronary Heart Disease:
the Guide in action
“There are many health care providers with good intentions who want to improve the health of Indigenous people through proven methods such as cardiovascular health, rehabilitation and secondary prevention programs. This guide provides the necessary insight into how this is best achieved and is a must have for clinicians, managers and service providers – for without it, they may well miss the mark..”
Kathy Broad
Cardiac Rehabilitation Coordinator Cairns Base Hospital
“The Wuchopperen Health Service Healthy Hearts outpatient cardiac rehabilitation program uses the four Toolkits from the guide as a reference for education materials, for trouble shooting if required and as a source for better understanding the basics of various heart conditions affecting Indigenous peoples. The funding case scenarios are also useful examples.” Barry Fewquandie
Cardiac Rehabilitation Coordinator Wuchopperen Health Service, Cairns
I N VE S T IN G I N AU S TR A LI A ’ S H E AL T H A GUIDE FOR HEAL TH PROFESSIONALS Strengthening Car
diac Rehabilitation and Secondary Prevention f
or Aboriginal
and Torres Strait Islander P eoples
The materials are the result of a program of work by the NHMRC to address the cardiovascular health of Aboriginal and Torres Strait Islander Peoples. Aboriginal and Torres Strait Islander members made up nearly two-thirds of the working committee appointed to carry out the project.
Key organisations were involved from the outset, including the National Aboriginal Community Controlled Health Organisation and the Australian Indigenous Doctors’ Association. The committee listened carefully to health professionals and consumers talking about why Aboriginal and Torres Strait Islander Peoples do not attend cardiac rehabilitation programs and how services could be made more accessible.
This process has been valuable in a number of ways. It has:
❖ provided a model of how non-Indigenous and Indigenous people can work together to create opportunities for improving health services for Aboriginal and Torres Strait Islander Peoples
❖ shown that involving the right organisations and individuals, and including community consultation all the way through the process, makes a big difference to the relevance and usefulness of the final products.
We are proud to recommend this package to health professionals and health services everywhere. We trust it will help to improve the uptake and outcomes of cardiac rehabilitation among Aboriginal and Torres Strait Islander Peoples, and through this, the health of Aboriginal and Torres Strait Islander communities across Australia.
Professor Warwick Anderson
Chief Executive Officer of the NHMRC
Dr Noel Hayman and Dr Mark Wenitong
vii Contents
contentS
executive Summary
1
1 backGround
5
1.1 Objectives 6 1.2 Overview of methodology 61.3 Purpose and structure of this document 7
2 Survey of cardiac rehabilitation
proGramS
9
2.1 Overview of survey 9
2.2 Survey response by State and Territory 10
2.3 Service setting 10
2.4 Cultural appropriateness 11
2.5 Distribution of cardiac rehabilitation services 12
3 eStimatinG population data
15
3.1 Census data 15
3.2 Mortality data 16
3.3 Estimation of the Aboriginal and Torres Strait Islander population 17
3.4 Risks and caveats associated with population estimates 17
4 eStimatinG eliGibility for cardiac rehabilitation
19
4.1 Data sought from States and Territories 19
4.2 Quality issues associated with data 21
4.3 Distribution of hospital separations 24
4.4 Key findings 32
5 diStribution of community and primary health
care ServiceS
33
5.1 Identification of services 33
5.2 Distribution of services 33
5.3 Potential role of primary health and community health service providers 35 5.4 Role of cardiac rehabilitation services as a support to primary and
viii Contents
6 StrenGtheninG cardiac rehabilitation and
Secondary prevention for aboriGinal and torreS
Strait iSlander peopleS
37
6.1 Key points for success 37
6.2 Implications of the findings for rural and remote communities 38
6.3 Enhancing the role of Aboriginal Health Workers 39
6.4 Programs that may support increased role of primary healthcare sector 40 6.5 Potential application of the CD-ROM to support improved practice 41
7 concluSionS
43
7.1 Data quality 43
7.2 Application of geographic information systems 43
7.3 Distribution of cardiac rehabilitation services 43
7.4 Future development of services 44
acronymS and abbreviationS
45
referenceS
47
appendiceS
49
1 Membership and terms of reference 49
2 Process report 51
3 ICD10-AM codes included in separation data 53
4 Survey of cardiac rehabilitation services 61
Executive Summary
executive Summary
In 2005 the National Health and Medical Research Council (NHMRC) convened an expert working committee to investigate barriers to effective practice and develop guidance for health professionals working in the area of cardiac rehabilitation among Aboriginal and Torres Strait Islander Peoples. The Committee conducted workshops, which
were hosted by Aboriginal Community Controlled Health Services in Darwin, Townsville and Mt Druitt (Sydney). This information contributed to the development of a practical guide for health professionals — Strengthening Cardiac Rehabilitation and Secondary Prevention for Aboriginal and Torres Strait Islander Peoples: A Guide for Health Professionals.
To further assist primary care health professionals and cardiac rehabilitation services, the Committee commissioned the Cardiac Geographic Information System (GIS) project. This project aimed to develop an interactive CD-ROM-based GIS report and maps that integrate the location of cardiac rehabilitation services in Australia with eligible Aboriginal and Torres Strait Islander Peoples who have had an adverse cardiac event. The project was undertaken by Healthcare Management Advisors (HMA), Adelaide and resulted in an interactive CD-ROM, a user manual and this final report, which details the methodology used, analyses undertaken and key findings of the Cardiac GIS project. The CD-ROM has been designed as a resource for primary health care providers and cardiac rehabilitation services, providing a tool to locate services and understand the distribution of cardiac illness in local areas. The information may also be of value to those involved in planning and developing cardiac rehabilitation service systems as it offers a means of considering the spatial distribution of services (cardiac
rehabilitation and primary/community health) in the context of population distribution. Coupled with the Guide, the CD-ROM provides a tool to support ongoing
development of cardiac rehabilitation and secondary prevention for Aboriginal and Torres Strait Islander Peoples.
development of the cardiac GiS
The Cardiac GIS was based on the following research:
v a survey of cardiac rehabilitation services and Aboriginal Community Controlled Health Services (ACCHS);
v estimation of the Aboriginal and Torres Strait Islander population and analysis of the distribution of the Aboriginal and Torres Strait Islander population in terms of proximity to a cardiac rehabilitation service;
v estimation of the number of Aboriginal and Torres Strait Islander Peoples eligible for cardiac rehabilitation, using hospital separation data for the Northern Territory, Queensland, South Australia and Western Australia; and
v calculation of the distance between each postal area and the nearest postal area in which there is a cardiac rehabilitation service.
As expected, it was found that cardiac rehabilitation services are predominantly located in urban and major regional centres. This highlights the importance of previous findings that:
v only a small proportion of the Aboriginal and Torres Strait Islander population eligible for cardiac rehabilitation and secondary prevention access these services;
Executive Summary
v the benefits of cardiac rehabilitation accrue where changes in behaviour reduce risk factors such as smoking, lack of activity and hypertension; and
v interventions that involve not only patients but their families, carers and communities, are more likely to be effective for Aboriginal and
Torres Strait Islander Peoples.
It is clear that there is considerable scope for improving access to cardiac rehabilitation for Aboriginal and Torres Strait Islander Peoples and for enhancing the cultural safety of health services. One solution is to involve primary and community health services, the geographic distribution of which is much more closely related to the population than is the distribution of cardiac rehabilitation services.
key findings
The accuracy with which Aboriginal and Torres Strait Islander Peoples are identified within hospital separation data limits the capacity to accurately determine the level of ill health within this population. This in turn presents challenges to planning services as they attempt to ensure adequate access to cardiac rehabilitation services. For the current project, data for the Northern Territory, Queensland, South Australia and Western Australia have allowed the following conclusions to be drawn.
access to cardiac rehabilitation services
v Almost 90% of cardiac rehabilitation services are located in either urban centres or major regional centres, and only 12% of services include an outreach program.
v The more remote the community, the less access there is to cardiac rehabilitation.
v Twenty-one per cent of the Aboriginal and Torres Strait Islander population (and 18.8% of those with a hospital separation that includes cardiac illness) live in postal areas that are further than 100 kilometres from the nearest cardiac rehabilitation service.
v A continuing barrier to Aboriginal and Torres Strait Islander Peoples’ access to cardiac rehabilitation services is limited implementation of service systems and resources to increase the cultural appropriateness of services.
v Geographic access to primary and community health services appears to be more closely related to population distribution than is access to cardiac rehabilitation services.
relationship between cardiac rehabilitation and primary health care services
v The development of effective links between specialist cardiac rehabilitation services and primary and community health services presents an opportunity for expanding access to cardiac rehabilitation services.
v Local primary health care services have a key role in secondary prevention and ongoing support for Aboriginal and Torres Strait Islander Peoples who may benefit from cardiac rehabilitation.
v Increasing the involvement of Aboriginal Health Workers in cardiac rehabilitation and secondary prevention, particularly through Aboriginal Community Controlled Health Services (ACCHS), provides an opportunity to improve access to cardiac rehabilitation and secondary prevention.
Executive Summary
a range of opportunities exist for development of accessible cardiac rehabilitation services
v Chronic disease strategies in most jurisdictions provide a framework within which to enhance access to cardiac rehabilitation and secondary prevention.
v Streamlining of Enhanced Primary Care arrangements within the Medicare Benefits Schedule represents a potential source of support for greater involvement of ACCHS in the provision of cardiac rehabilitation and secondary prevention.
v Linking in with national and jurisdictional programs (eg Healthy for Life)
represents a potential avenue for developing innovative approaches to improving access to cardiac rehabilitation and secondary prevention services for Aboriginal and Torres Strait Islander Peoples.
Background
1
backGround
Aboriginal and Torres Strait Islander Peoples experience poorer health than other Australians and have greater difficulty in accessing health services. This is of particular concern in the area of cardiac rehabilitation services, which aim to improve general health and prevent further cardiac events.
Although the benefits of cardiac rehabilitation are clear, only a small proportion of people who have experienced cardiac events attend programs.1 Aboriginal and
Torres Strait Islander Peoples are even less likely to participate in cardiac rehabilitation programs than non-Indigenous Australians,1–3despite being twice as likely to die from
heart disease.4–7
In 2005 the National Health and Medical Research Council (NHMRC) convened a Cardiac Rehabilitation Working Committee (see Appendix 1) to investigate barriers to effective practice and develop guidance for health professionals working in the area of cardiac rehabilitation among Aboriginal and Torres Strait Islander Peoples. The Committee conducted workshops, which were hosted by Aboriginal Community Controlled Health Services in Darwin, Townsville and Mt Druitt (Sydney). This information contributed to the development of a practical guide for health professionals — Strengthening Cardiac Rehabilitation and Secondary Prevention for Aboriginal and Torres Strait Islander Peoples: A Guide for Health Professionals (the Guide).8
To further assist primary care health professionals and cardiac rehabilitation services, the Committee commissioned the Cardiac GIS project. This project aimed to develop an interactive CD-ROM-based GIS report and maps that integrate the location
of cardiac rehabilitation services in Australia with eligible Aboriginal and
Torres Strait Islander Peoples who have had an adverse cardiac event. The project was undertaken by Healthcare Management Advisors (HMA), Adelaide and resulted in an interactive CD-ROM, a user manual and this final report. The following barriers to accessing services, identified by the Guide, were central in determining the focus of the Cardiac GIS project:
v distance from treatment centres, particularly for Aboriginal and Torres Strait Islander Peoples living in rural and remote areas;
v weak links between mainstream services and the Indigenous health sector and inadequate discharge planning and follow-up;
v difficulties associated with patients and only one carer travelling from home for treatment;
v a lack of training and support for Aboriginal Health Workers related to cardiac rehabilitation; and
v a low rate of referral to cardiac rehabilitation programs.
The Cardiac GIS CD-ROM and user manual aim to allow health professionals to:
v locate the cardiac rehabilitation services nearest to where a patient lives;
v print out the details of the cardiac rehabilitation services to provide to patients as they are referred;
Background
v view the estimated distribution of cardiac-related morbidity and mortality as maps;
v access background information such as:
– geographic distribution of Indigenous language groups across Australia – resources developed within the Guide; and
v download data about services that are used regularly.
1.1
objectives
The aim of this project was to produce an interactive CD-ROM-based GIS report and associated maps that identified cardiac rehabilitation services and Aboriginal and Torres Strait Islander Peoples eligible for cardiac rehabilitation. The GIS report and maps were to integrate information on:
v services that provide cardiac rehabilitation within the health care system, including hospitals and Indigenous-specific health services in Australia as well as their service scope and location;
v location of allied health services and Aboriginal health programs and areas that they cover;
v the prevalence of Aboriginal and Torres Strait Islander Peoples who are eligible for cardiac rehabilitation services;
v distances from home address of eligible cardiac rehabilitation patients to the nearest cardiac rehabilitation service; and
v population density or distribution of Aboriginal and Torres Strait Islander Peoples. Analyses were conducted on the basis of groups of postal areas. The use of individual cases would have required street address data, necessitating Ethics Committee approval, which was not feasible within the limited timeframe originally proposed for the project. Further, it was expected that there would be relatively few, if any, cases in individual postal areas, which would limit the capacity to draw conclusions regarding the overall access to services. The location of cases from year to year was also expected to vary considerably.
1.2
overview of methodology
The original methodology, as agreed with the Cardiac Rehabilitation Working Committee, involved:
v a survey of cardiac rehabilitation services and Aboriginal Community Controlled Health Services to identify current cardiac rehabilitation services and their characteristics;
v analysis of hospital separation data where Aboriginal and Torres Strait Islander Peoples were involved and where cardiac illness was a primary or secondary diagnosis;
v analysis of Aboriginal and Torres Strait Islander mortality data where cardiac illness was present; and
v analysis of the geographic distribution of the Aboriginal and Torres Strait Islander population.
Background
1.3
purpose and structure of this document
This document represents the final report for the project, and accompanies the CD-ROM developed to present the results of the GIS analysis. There are seven chapters, including this introductory chapter:
Chapter 2 Provides an overview of the survey of cardiac rehabilitation services and Aboriginal Community Controlled Health Services undertaken for the project and the analysis of responses.
Chapter 3 Describes the range of data used for the current project, the shortcomings of the data and the risks associated with its use.
Chapter 4 Provides an analysis of data relating to the population of those potentially eligible for cardiac rehabilitation and their relationship to the location of cardiac rehabilitation services and community/allied health services. Chapter 5 Provides an analysis of the geographic distribution of services and
considers the implications for future planning and development of cardiac rehabilitation services and services models to meet the needs of Aboriginal and Torres Strait Islander Peoples.
Chapter 6 Draws on the findings and recommendations presented in the Guide to consider current barriers to cardiac rehabilitation and secondary prevention, the factors that contribute to the development of successful programs and current programs that may provide funding to support the development of programs in Aboriginal and Torres Strait Islander communities.
Chapter 7 Presents conclusions and recommendations designed to facilitate improved access to cardiac rehabilitation and secondary prevention services for Aboriginal and Torres Strait Islander Peoples, particularly those living in rural and remote communities.
Survey of cardiac rehabilitation programs
2
Survey of cardiac rehabilitation proGramS
This chapter describes the survey of cardiac rehabilitation services and Aboriginal Community Controlled Health Services undertaken to provide base data for the project.
2.1
overview of survey
In order to gain current information regarding cardiac rehabilitation services nationally, a list of cardiac rehabilitation services and Aboriginal Community Controlled Health Services (ACCHS) was compiled. This list, including 457 sites, was based on information gathered from the National Heart Foundation of Australia (NHF), State and Territory Health Departments and the Office of Aboriginal and Torres Strait Islander Health (OATSIH).
A total of 457 surveys was distributed, 98 (21.2%) to ACCHS and 359 (78.5%) to cardiac rehabilitation services. Contact information for ACCHS was provided by OATSIH, while information on cardiac rehabilitation services was collated from data sources held by NHF offices and some State and Territory health authorities. Of the 457 surveys sent, 237 (52.0%) surveys were completed and returned (nine of these failed to indicate whether or not a cardiac rehabilitation service was provided). Follow-up of
non-responding sites by telephone confirmed that a total of 372 sites operated a cardiac rehabilitation program.
Surveys were posted to all sites, accompanied by a covering letter from the NHMRC which provided background information about the project. Where surveys were returned marked “Return to Sender”, enquiries were made by telephone to the service or, alternatively, contact was made with either the NHF or OATSIH to obtain an updated address. Survey packages provided details of the due date for completion and return of the survey (about one week following receipt of the survey).
One week after the stated due date, services that had not returned a survey received a follow-up phone call checking that the survey had been received and enquiring whether the survey was in the process of being completed or had already been sent. If the survey had not been received or had been misplaced, another copy was sent with a request for the service to return it as soon as possible. During this phone call, services were also given the option of providing their responses to the survey over the phone (if this was preferred the survey was conducted verbally and responses recorded at that time). An additional three rounds of follow-up calls were made.
Following receipt of completed survey responses, follow-up phone calls were undertaken where necessary to address missing data and clarify any ambiguities. During the process of receiving completed surveys and checking the responses, some respondents provided details of other cardiac rehabilitation services that were not in the original lists provided by the NHF and OATSIH (these services were involved in a specific project in New South Wales). Although surveys were not provided to these services, contact details have been included in the CD-ROM.
0 Survey of cardiac rehabilitation programs
2.2
Survey response by State and territory
The majority of surveys received were from NSW (33.3%). Analysis of response rates indicated that there was no significant difference across jurisdictions among designated cardiac rehabilitation services (X 2 = 7.96, df= 7).
table 2.1 cardiac rehabilitation service response rates
Jurisdiction Sites surveyed (n) responses (n)
ACT 2 2 NSW 129 70 NT 2 2 QLD 66 37 SA 25 15 TAS 5 3 VIC 104 64 WA 26 20 total 359 213
Similarly, review of responses rates for ACCHS indicated that there was no difference between jurisdictions (X 2 = 6.22, df= 6) (Tasmania was excluded from the analysis).
The relatively low response rate for ACCHS reflected the absence of identified cardiac rehabilitation services in the majority of services. In subsequent analyses, responses from ACCHS that provided cardiac rehabilitation services were included with those for mainstream services.
table 2.2 aboriginal community controlled health Service: response rates
Jurisdiction Sites surveyed (n) responses (n)
ACT 1 0 NSW 23 7 NT 17 2 QLD 20 1 SA 8 1 TAS 0 0 VIC 9 1 WA 20 3 total 98 15
Follow-up discussions with ACCHS indicated the majority of those that did not respond did not consider the survey relevant as they did not provide a cardiac rehabilitation service. The response rate is provided as background for those utilising the CD-ROM tool developed through the current project.
2.3
Service setting
Survey respondents were asked to indicate the settings in which their cardiac
rehabilitation service operated. Respondents could indicate more than one setting. Table 2.3 presents the range of responses received — 55.3% (131) of respondents indicated they provided services in an acute public hospital and 29.5% (70) indicated that they
Survey of cardiac rehabilitation programs
table 2.3 Service settings reported (n = 237)
Service Setting n % of total
Within an acute public hospital 131 55.3
Within an acute private hospital 25 10.5
Within an Aboriginal Medical
Service 14 5.9
Within a non-acute/community
hospital 9 3.8
Within a public community health
centre/service 70 29.5
Within a private outpatient service 16 6.8
As part of an outreach service to
communities 29 12.2
Note: Individual services reported operating in more than one setting.
2.4
cultural appropriateness
Survey respondents were asked to complete questions concerning the inclusion of activities or approaches identified in the Guide as representing best practice in engaging Aboriginal and Torres Strait Islander Peoples in cardiac rehabilitation.
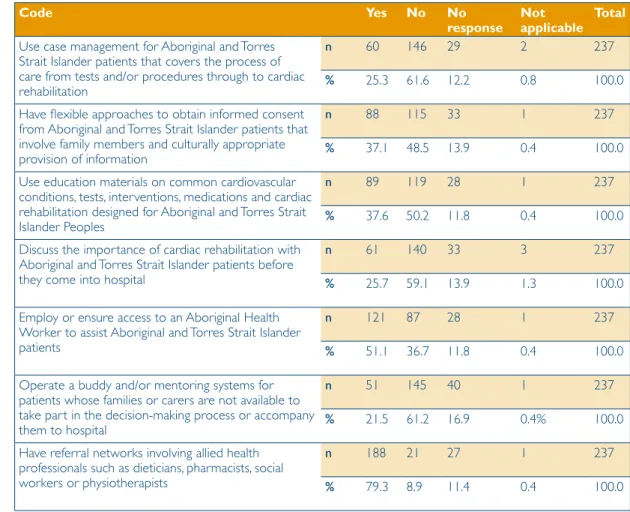
Table 2.4 provides a summary of the responses to the cultural appropriateness questions in the survey:
v around a third (37.1%) reported that they had established flexible approaches to gaining consent that involved family members and provision of information in a culturally appropriate manner;
v a similar proportion (37.6%) used education materials that had been specifically designed for Aboriginal and Torres Strait Islander Peoples;
v over half those responding (51.1%) indicated that they either employed, or had established access to, Aboriginal Health Workers to support the provision of cardiac rehabilitation services to Aboriginal and Torres Strait Islander patients; and
v the majority of respondents (79.3%) reported referral networks with the range of health professionals required to support cardiac rehabilitation
However:
v only 60 services (25.3%) indicated that they used a comprehensive case management approach with Aboriginal and Torres Strait Islander patients;
v only a quarter of services had established processes to discuss cardiac rehabilitation with Aboriginal and Torres Strait Islander patients before their admission to hospital; and
v only 51 services (21.5%) reported that they had established a buddy or mentor system for Aboriginal and Torres Strait Islander patients who did not have a family member or carer available to support decision-making.
The launch of the Guide occurred after the survey was completed. Nevertheless, the relatively limited application of strategies to increase the cultural appropriateness of services suggests that there is considerable scope for improvement.
Survey of cardiac rehabilitation programs
table 2.4 cultural appropriateness Survey Questions
code yes no no
response not applicable total
Use case management for Aboriginal and Torres Strait Islander patients that covers the process of care from tests and/or procedures through to cardiac rehabilitation
n 60 146 29 2 237
% 25.3 61.6 12.2 0.8 100.0
Have flexible approaches to obtain informed consent from Aboriginal and Torres Strait Islander patients that involve family members and culturally appropriate provision of information
n 88 115 33 1 237
% 37.1 48.5 13.9 0.4 100.0
Use education materials on common cardiovascular conditions, tests, interventions, medications and cardiac rehabilitation designed for Aboriginal and Torres Strait Islander Peoples
n 89 119 28 1 237
% 37.6 50.2 11.8 0.4 100.0
Discuss the importance of cardiac rehabilitation with Aboriginal and Torres Strait Islander patients before they come into hospital
n 61 140 33 3 237
% 25.7 59.1 13.9 1.3 100.0
Employ or ensure access to an Aboriginal Health Worker to assist Aboriginal and Torres Strait Islander patients
n 121 87 28 1 237
% 51.1 36.7 11.8 0.4 100.0
Operate a buddy and/or mentoring systems for patients whose families or carers are not available to take part in the decision-making process or accompany them to hospital
n 51 145 40 1 237
% 21.5 61.2 16.9 0.4% 100.0
Have referral networks involving allied health professionals such as dieticians, pharmacists, social workers or physiotherapists
n 188 21 27 1 237
% 79.3 8.9 11.4 0.4 100.0
2.5
distribution of cardiac rehabilitation services
A key stage in the survey was identifying cardiac rehabilitation services. The postal area (an Australian Bureau of Statistics geographic approximation of postcodes) in which each cardiac rehabilitation program was located was used to provide a measure of remoteness using the Accessibility and Remoteness Index of Australia (ARIA++) score (between 0 and 18). Table 2.5 shows the distribution of cardiac rehabilitation programs in terms of remoteness. To give some sense of how ARIA++ describes remoteness:
v a score of zero reflects a location in the centre of a metropolitan area such as the Sydney central business district;
v a regional centre such as Wagga Wagga receives a score of approximately 2.5;
v small communities near regional centres (eg Barmera in South Australia or Stanthorpe in Queensland) receive a score of approximately 5;
v a remote centre (eg Broken Hill or Tennant Creek) is given a score of approximately 12; and
v small, very remote communities (eg Cundeelee [WA] or Adavale [Qld]) receive scores over 15.
Survey of cardiac rehabilitation programs
table 2.5 cardiac rehabilitation services (frequency) by aria ++
aria++ no. of cardiac
rehabilitation programs
estimated indigenous
population July 2004 cardiac rehabilitation programs per 100,000 indigenous population 0.00–0.99 155 155,572 99.8 1.00–1.99 33 26,037 126.7 2.00–2.99 31 28,141 110.2 3.00–3.99 42 55,057 76.3 4.00–4.99 27 24,662 109.5 5.00–5.99 37 19,923 185.7 6.00–6.99 11 11,379 96.7 7.00–7.99 4 6,106 65.5 8.00–8.99 4 4,720 84.7 9.00–9.99 4 6,865 58.3 10.00–10.99 7 7,929 88.3 11.00–11.99 2 2,638 75.8 12.00–12.99 3 4,775 62.8 13.00–13.99 3 21,816 13.8 14.00–14.99 5 8,386 59.6 15.00–15.99 1 17,568 5.7 16.00–16.99 2 27,725 7.2 17.00 or higher 1 22,724 4.4 total 372 452,023 82.1
The number of cardiac rehabilitation programs declines as areas become more remote. Further, the number of services per 100,000 Aboriginal and Torres Strait Islander population declines quite rapidly outside major regional centres (see Figure 2.1).
figure 2.1 cardiac rehabilitation services per 100,000 indigenous people by aria++ 0.00 20.00 40.00 60.00 80.00 100.00 120.00 140.00 160.00 180.00 200.00 0-1 1-2 2-3 3-4 4-5 5-6 6-7 7-8 8-9 9-10 10 -1 1 11-12 12-1 3 13 -1 4 14-1 5 15 -1 6 16-1 7 17 + Aria ++ Cardiac Rehababilitation Services /100,000
Rehabs/100,000 Linear (Rehabs/100,000) 0.00 20.00 40.00 60.00 80.00 100.00 120.00 140.00 160.00 180.00 200.00 0-1 1-2 2-3 3-4 4-5 5-6 6-7 7-8 8-9 9-10 10 -1 1 11-12 12-1 3 13 -1 4 14-1 5 15 -1 6 16-1 7 17 + Aria ++ Cardiac Rehababilitation Services /100,000
Population data
3
eStimatinG population data
A key consideration in any assessment of illness in a community is establishing the base population against which hospital separation and mortality rates can be generated. This chapter considers the current quality of population data regarding Aboriginal and Torres Strait Islander Peoples and also describes the methods applied to develop population estimates for the current project.
3.1
census data
Over the past 15 years, the Australian Bureau of Statistics (ABS) has identified shortcomings in Census data on Aboriginal and Torres Strait Islander Peoples and has sought to improve both the extent to which Aboriginal and Torres Strait Islander Peoples are enumerated within the Census every five years, and the quality of estimates developed in the periods between Census collections and for longer term projects. The ABS advises that, while identification and enumeration of Aboriginal and
Torres Strait Islander Peoples in the Census continues to improve, it is estimated that in more remote communities as many as 10 percent of the population is not identified. For the Cardiac GIS project, the 2001 Census was used as the starting point for estimating the Aboriginal and Torres Strait Islander population. Data provided by the ABS included the Census population of Indigenous people by ten-year age group and postal area (see Section 4.2 for a discussion on postal areas). The relatively small Aboriginal and Torres Strait Islander population results in individual data cells (ie age groups for a specific postal area) falling below three cases, so the ABS provides a randomised number between 0 and 3 for these cells.
The initial request for data from the ABS included a breakdown of the 2001 Census data by postal area, gender and five-year age group. Following an initial test and taking account of the advice from the ABS, the data provided did not include gender and utilised ten-year age groups, significantly reducing the number of randomised cells. An issue was the number of cases within the 2001 Census for which no response was provided regarding Indigenous status. It was assumed that failure to complete this item was randomly distributed and cases were therefore allocated proportionately (ie if 10 percent of the population in a cell was Indigenous, 10 percent of non
respondents were allocated to the Indigenous population). Use of the 2001 Census data was considered less than ideal:
v it is believed that this Census underestimated the Indigenous population by approximately 6.1%;9 and
v changes in the population between August 2001 and June 2004 would have been ignored.
Using the 2001 Census data as a denominator for subsequent analyses would have been relatively straight forward, but would have provided an underestimate of the underlying population and therefore inflated the hospital separation and mortality rates developed. As a result, estimates of the 2004 Indigenous population were sought.
Establishment of the denominator population for subsequent calculations is discussed in Section 3.3.
Population data
3.2
mortality data
Review of available literature regarding Indigenous mortality data suggests that, in the past, the quality of data has been relatively poor. For instance, Shahidulla and Dunstan10
found that, nationally, only two of every five Indigenous deaths were recorded as such. There was also considerable variation between jurisdictions, with estimates for the ACT, Queensland, Tasmania and Victoria unable to be calculated due to the small number of deaths recorded, New South Wales estimated at 27.4% of cases and the Northern Territory, South Australia and Western Australia combined providing an estimate of 84.8% of cases.
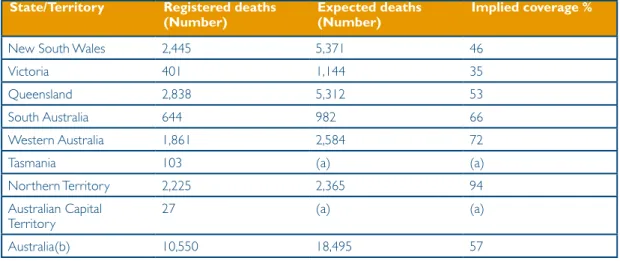
More recently, the ABS has employed an alternative analysis (see Section 3.3) to develop an estimate of the Indigenous population and calculation of life expectancy tables.9 This
analysis found that between 1991 to 1996, and 1996 to 2001, there appeared to have been an improvement in the quality of Indigenous mortality data in NSW, Queensland and Tasmania, while the Northern Territory, Western Australia and South Australia remained relatively strong (see Table 3.1).
table 3.1: implied coverage of indigenous mortality data by jurisdiction 2000–2004 State/territory registered deaths
(number) expected deaths(number) implied coverage %
New South Wales 2,445 5,371 46
Victoria 401 1,144 35
Queensland 2,838 5,312 53
South Australia 644 982 66
Western Australia 1,861 2,584 72
Tasmania 103 (a) (a)
Northern Territory 2,225 2,365 94
Australian Capital
Territory 27 (a) (a)
Australia(b) 10,550 18,495 57
Notes: (a) Not calculated due to small numbers; (b) includes other territories.
Source 11, p.62
Discussions with the ABS indicated that there has been considerable effort in all jurisdictions to improve the accuracy of mortality data related to Aboriginal and Torres Strait Islander Peoples, and that the data requested for 2003–04 should be a better
(though still imperfect) reflection of mortality among Aboriginal and Torres Strait Islander Peoples. Analysis of mortality data for 2003–04 was undertaken as part of the current project, but the quality of the data and the relatively small number of cases limited the value of the results and it has been excluded from this report.
Population data
3.3
estimation of the aboriginal and torres Strait islander
population
Initial experimental estimates of the Indigenous population developed by the ABS10 used
a methodology that assumed that there was no migration into or out of the population. This methodology involved the calculation of fertility (assuming that where an
Indigenous father and a non-Indigenous mother gave birth the child would be identified as Indigenous) and life expectancy tables using birth and mortality data for the period 1991–2001, and application of a methodology developed by Preston Hill.12
However, it has been noted9 that Indigenous people are increasingly identifying as such,
possibly representing migration, and highlighting a potential flaw in the Preston Hill method. As a result, the Bhat13 method was applied and experimental estimates and
projections of the Indigenous population were developed for the period 2001–2010. These estimates and projections were developed for the 36 ATSIC regions, and presented high and low estimates, with the low estimate used for the current project.
The estimates developed were then used to calculate a population growth coefficient for each ATSIC region. Appendix 5 presents the coefficient for each region used to adjust Census data to reflect the projected 2004 population. In order to allocate growth coefficients, postal areas were mapped against ATSIC regions. The relevant growth coefficients were then applied to the 2001 Indigenous population by age group to provide an adjusted 2004 population.
3.4
risks and caveats associated with population estimates
The development of experimental estimates and projections of the Indigenous population rests on a series of assumptions and underlying estimates of the base population in the Census year. These assumptions contribute to adjustment of birth and mortality data, and estimates of behaviour related to propensity to identify as Indigenous. The ABS experimental projections of the Indigenous population were developed at the level of ATSIC regions using data of differing quality across jurisdictions and sources. It is emphasised that the estimates become increasingly unstable as the base population diminishes.
While acknowledging this issue, an approach was required for the current analysis that allowed an estimate of the population in individual postal areas to allow subsequent regrouping of data, around either ARIA++ or proximity to cardiac rehabilitation service measures. It was evident from the experimental estimates9 that population growth was
not consistent across ATSIC regions, precluding the application of a single coefficient nationally. As a result, postal areas were allocated to an ATSIC region and the coefficient for the relevant region was applied. Where postal areas did not map exactly to ATSIC boundaries, the postal area was allocated to the ATSIC region into which its centroid fell. Care was taken to ensure that no group crossed jurisdictional boundaries and that subsequent groupings resulted in total populations at least equivalent to those within ATSIC regions for which the population estimates were developed.
The results presented in the remainder of this report should be viewed with some caution as they are based on data of variable quality. Furthermore, no attempt should be made to draw comparison between jurisdictions as this involves use of data of differing quality and, accordingly estimates of differing quality.
Eligibility for cardiac rehabilitation
4
eStimatinG eliGibility for cardiac
rehabilitation
This chapter describes the process of assessing the relative density of the Aboriginal and Torres Strait Islander population eligible for cardiac rehabilitation. Two options were available, namely:
v identifying the number of Aboriginal and Torres Strait Islander Peoples admitted to hospital in whom a cardiac illness related to either rheumatic or ischaemic heart disease was identified; and
v assuming that the prevalence of cardiac illness is relatively constant across the Indigenous population, and using the total Indigenous population as a proxy for the relative number of Aboriginal and Torres Strait Islander Peoples who may require cardiac rehabilitation.
The initial approach taken sought to utilise hospital separation data as a proxy for identifying those eligible for cardiac rehabilitation programs.
4.1
data sought from States and territories
A list of International Classification of Diseases – Australian Modification (ICD-AM) codes associated with cardiac illness (both rheumatic and ischaemic) was developed (see Appendix 3). A request was forwarded to all jurisdictions seeking access to data relating to all hospital separations for 2003–04 where the patient was identified as Indigenous and where any of the diagnosis fields relating to the patient included at least one of the identified ICD10-AM codes. Cases where a patient was admitted for a non-cardiac-related condition (eg an orthopaedic procedure) but was known to also have a cardiac-related illness were included in the data.
The request also sought:
v patient postcode;
v gender;
v date of birth or age;
v hospital of admission; and
v a unique patient identifier.
It was noted that the capacity of different jurisdictions to effectively identify duplicate cases (ie where an individual had been admitted on more than one occasion in the period under study) varied. For instance, Western Australia had the capacity to match records across facilities. This allowed provision of data in the form of a table of postcodes by age groups, with cells representing the number of cases where patients were Indigenous and diagnosed with a cardiac condition.
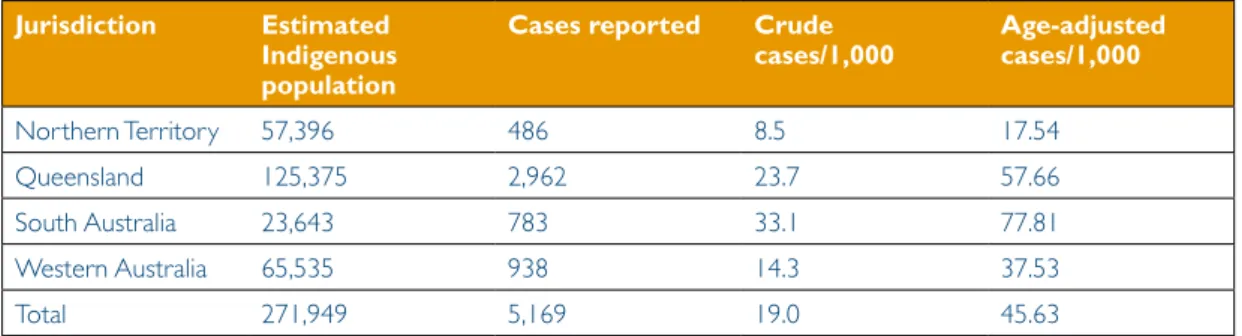
Other jurisdictions, as far as possible sought to exclude duplicate cases. Where data were provided at the individual record level (eg in South Australia), further screening was undertaken to identify cases where the date of birth, gender and postcode were the same. These cases were assumed to be the same patient or duplicate records, and only the first record was retained for the analysis. Where data from one jurisdiction included cases for a postcode in another jurisdiction, these cases were added to the data for the relevant State/Territory. Table 4.1 provides a summary of the data received from each of
0 Eligibility for cardiac rehabilitation
table 4.1 Separations and age-adjusted separations reported by jurisdiction Jurisdiction estimated
indigenous population
cases reported crude
cases/1,000 age-adjusted cases/1,000
Northern Territory 57,396 486 8.5 17.54
Queensland 125,375 2,962 23.7 57.66
South Australia 23,643 783 33.1 77.81
Western Australia 65,535 938 14.3 37.53
Total 271,949 5,169 19.0 45.63
When the separations data were reviewed in the context of previous work relating to cardiac illness among Aboriginal and Torres Strait Islander Peoples, the face validity of the data was questioned. This related to the pattern of results for the Northern Territory, South Australia and Western Australia, which suggested that there was comparatively lower cardiac-related hospital activity in the Northern Territory. This did not accord with mortality data published by the ABS and AIHW14 (see Table 4.2) which suggested that
there were higher death rates for circulatory diseases in the Northern Territory than South Australia and Western Australia.
table 4.2 indigenous crude death rates/100,000 – circulatory diseases, 1997–2002
1997 1998 1999 2000 2001 2002 Western australia Males 220 209 170 142 182 155 Persons 173 172 150 150 133 130 South australia Males 195 184 164 145 111 86 Persons 152 153 146 131 121 115 northern territory Males 274 274 237 247 228 228 Persons 249 229 199 208 181 206 Source: 14, Table 9.35
A range of factors may have contributed to the difference between the raw number of cases per 1,000 for each jurisdiction, including:
v different levels of accuracy in identifying Aboriginal and Torres Strait Islander patients;
v different criteria for the admission of individuals into hospitals;
v different levels of accuracy in identifying co-morbidities; and
v different levels of cardiac illness within populations in each jurisdiction. As can be seen from Figure 4.1, the variation between jurisdictions is considerable. Adjusting for differences in the age distribution of the population within each jurisdiction further increased the apparent disparity between jurisdictions. This will not be discussed further as the project was not designed to test or explain the reasons for differences in the apparent level of cardiac-related illness between jurisdictions.
Eligibility for cardiac rehabilitation
figure 4.1 crude separation rate and age-adjusted separation rates (per 1,000 population) by jurisdiction (2003–04)
The initial approach to analysis of data for the project included all States and Territories. However, concerns regarding the data resulted in analyses with a reduced data set. The Australian Institute of Health and Welfare (AIHW) was commissioned by the Australian Health Ministers’ Conference to undertake a review and assessment of the quality of Indigenous identification in hospital separations data. As a result of the review, guidelines for the use of hospital separations data were established and included: 15,
“5. When using Indigenous status information for analytical purposes, the data for only Queensland, Western Australia, South Australia and the Northern Territory should be used, individually or in aggregate.
6. Analyses based on data for Queensland, Western Australia, South Australia and the Northern Territory in aggregate should be accompanied by caveats about limitations imposed by jurisdictional differences in data quality and about the data not necessarily being representative of the jurisdictions excluded.
17. When deriving age-standardised Indigenous separation rates, age groups should be amalgamated where greater than an age determined by analysis of the data in question, as necessary, to ensure that all age groups have sufficient numbers for reliable results.”
Accordingly, the analysis (see below) of hospital separations was restricted to the
Northern Territory, Queensland, South Australia and Western Australia, however the data for all jurisdictions was analysed and mapped to provide the spatial backgrounds for the accompanying CD-ROM.
4.2
Quality issues associated with data
The relatively poor quality of health data related to Indigenous people has been a key concern within the Australian health system over the past decade. In 2001, agreement was reached regarding amendment of the Indigenous data item within the National Health Data Dictionary. Further, establishment of the National Advisory Group on Aboriginal and Torres Strait Islander Health Information and Data (NAGATSIHID) provided a mechanism to support improved collection of data related to Indigenous people through the Australian health system.
0 10 20 30 40 50 60 70 80 90
Northern Territory Queensland South Australia Western Australia
Jurisdiction
Separations/1,000
Crude cases/1,000 Age Adjusted cases/1,000 0 10 20 30 40 50 60 70 80 90
Northern Territory Queensland South Australia Western Australia
Jurisdiction
Separations/1,000
Eligibility for cardiac rehabilitation
Nevertheless, review of the data received, and discussions with key stakeholders
suggested that there continues to be shortcomings in the recording of Indigenous status. A study by Jackson-Pulver16 reported that only 34.5% of women attending an obstetric
event in hospital (in NSW), who readily identified as Aboriginal or Torres Strait Islander, were identified as such in hospital records. Discussions with the author of that analysis suggested that similar results had been obtained in Victoria, but that data in the Northern Territory and Western Australia were considered to be more accurate. This provided further justification for excluding data from NSW, Victoria and Tasmania in the current analysis.
allocation of postcodes
No formal study of the extent to which the postcode of Indigenous patients is recorded accurately in hospital admission records was identified, except for patients with end stage renal disease. The location attributed to patients is crucial to the current project, as the patient postcode was the only practical means of distributing cases geographically. South Australian data suggested that approximately one quarter of all separations were drawn from the postcode related to one rural centre, and subsequent inquiries provided no clear explanation for this concentration of patients. However, it was suspected that patients may have provided the name of the regional centre rather than their place of residence either because they did not expect health professionals to be aware of the more remote communities, or because they were staying nearby at the time of their admission.
case identification
If it is assumed that the incidence of cardiac disease is relatively uniform within the Indigenous population across jurisdictions, it would be expected that the crude separation rate would be relatively similar. However, as can be seen from Table 4.1 (above) crude separation rates range between 10.6 cases per 1,000 and 33.1 cases per 1,000. This suggests a potentially significant variation between jurisdictions in relation to:
v the likelihood that Indigenous patients are recorded as such;
v practices related to the admission of cases for inpatient care; and
v capacity to identify cases where more than one admission occurred in the 2003– 2004 period.
Where unit record data was provided, every effort was made to screen for duplicate cases (ie the same patient with more than one admission). However, where data were provided as a frequency table (Queensland and Western Australia) (ie postcode, by age group, by number of separations) it was not possible to check data.
use of abS postal areas
ABS postal areas were used to align population data with hospital separation data, and provide a basis for incorporating data into a geographic analysis. These boundaries are a proxy for postcode, though the boundaries do not align perfectly with those of postcode areas and in some cases traverse State and Territory boundaries. However, an advantage of using postal areas is that they readily align with other ABS boundaries, which allows analysis against population data.
Eligibility for cardiac rehabilitation
Grouping separation data
Three approaches were taken to grouping separation data. The first relied on the average ARIA++ score for each postal area. Postal areas were ranked on the basis of their ARIA++ score and then grouped to provide an equal distribution of separations.
For example, if there were 600 cases in a jurisdiction, and five groupings were sought, once data were sorted by ARIA++, the number of separations was summed for each postal area, until the cumulative sum reached 120 cases. This defined the partition between the first and second group, with the procedure repeated until the required number of groups were achieved.
The decision regarding the number of groups was moderated by:
v the total population of the jurisdiction;
v the estimated Indigenous population of each grouping; and
v capacity for data to be effectively represented geographically.
Once data were grouped, an age-adjusted separation rate was calculated for each group, and it is this rate which is represented in maps related to morbidity by ARIA++.
The second basis for grouping was the proximity score for each postal area. The
distance between the centroid1 of each postal area and the nearest cardiac rehabilitation
service was calculated and used as a proximity score. Although there was a significant correlation between ARIA++ score and proximity to a cardiac rehabilitation service (Pearson’s r = 0.6, df=2428), there was some movement of postal areas between groups, particularly where a cardiac rehabilitation service was identified in a relatively remote location.
adjusting separation rates for the age distribution of the indigenous population
Review of population estimates showed that the age distribution of the Indigenous population varied between regions and that the Indigenous population had a different age distribution to the Australian population as a whole. In order to ensure that the results of analysis provide some basis for comparison to the Australian population as a whole, it was necessary to adjust separation rates to take account of the age distribution of the Indigenous population in each group analysed.
Direct age adjustment of the data was identified as the most valid means of allowing comparison of results (at least within jurisdictions). This was achieved by:
v constructing a standard 1,000,000 population for Australia by taking the 2004 Australian population estimate, dividing 1,000,000 by the total population and then multiplying the population in each 10-year age group by the result (see Table 4.3);
v calculating the total population for each 10-year age group, in each of the groupings (ie ARIA++ or proximity to Cardiac Rehabilitation Services);
v calculating the total number of separations for each age group in each grouping;
v dividing the separations for each age group by the population for that age group to give a raw separation rate;
v multiplying the raw separation rate for each age group and group by the relevant standard Australian population for that age group, giving an expected number of separations;
4 Eligibility for cardiac rehabilitation
v adding the expected separations for each age group within each grouping, to provide a total number of expected separations; and
v dividing the total expected separations for each grouping by 1,000 to provide an age-adjusted separation rate per 1,000 population.
table 4.3: Standard australian per million population, 2004
age group 0–9 10–19 20–29 30–39 40–49 50–59 60–69 70+ total
Population 129,247 135,856 141,991 149,630 146,317 124,515 81,928 90,516 1,000,000
4.3
distribution of hospital separations
Analysis showed variation in hospital separation data between jurisdictions. However, it was unclear to what extent this was a reflection of differences in the accuracy of Aboriginal and/or Torres Strait Islander identification in hospitals rather than differences in the incidence of cardiac-related illness. Accordingly, the results below are given by jurisdiction, and no attempt has been made to draw comparisons between States or Territories.
the northern territory
Three cardiac rehabilitation programs were identified in the Northern Territory. Table 4.4 provides a summary of hospital separation data for the Northern Territory, in terms of age-adjusted separation rates, raw cases and the total estimated Indigenous population for each ARIA++ grouping.
Population density in more remote areas is lower, and the data for the Northern Territory suggested that the age-adjusted rate of cardiac-related hospital separations for 2003–04 declined with remoteness. However, when the total number of reported cases is considered it became apparent that two-thirds of those who would have been eligible for cardiac rehabilitation in 2003–04 would have had to travel over 100 kilometres to access a specialist cardiac rehabilitation program. The remaining cases were within 10 kilometres of a cardiac rehabilitation service.
When only population is considered, it is evident from Table 4.4 that over 70% of the Indigenous population in the Northern Territory reside within the two ARIA++ groups where the average distance to a specialist cardiac rehabilitation service is over 145 kilometres.
table 4.4: age-adjusted separation rates, raw cases, average kilometres to cardiac rehabilitation and indigenous population for the northern territory by aria++ grouping
Group aria++ range age-adjusted separation rate/1000 by aria++ cases average km to cardiac rehabilitation total population 1 3.0 to 6.0169 26.9 167 4.9 14,888 2 6.4905 to 13.4421 18.8 163 145.4 18,953 3 15.0 to 17.3403 12.3 156 183.3 23,555
Table 4.5 highlights the relatively limited access to cardiac rehabilitation services for more remote populations. However, the distribution of community or primary health care services suggests that there is potential for building support systems for cardiac
Eligibility for cardiac rehabilitation
table 4.5: relative access to cardiac rehabilitation services and other health services by aria++ grouping for the northern territory
Group aria++ range cases community/
primary health care services cardiac rehabilitation services total population 1 3.0 to 6.0169 167 9 1 14,888 2 6.4905 to 13.4421 163 29 1 18,953 3 15.0 to 17.3403 156 56 1 23,555
Map 1 presents the distribution of cardiac-related separation rates by ARIA++ groupings, cardiac rehabilitation services and primary and community health services for the Northern Territory.
Eligibility for cardiac rehabilitation
Queensland
Data for postal areas in Queensland were grouped by ARIA++ score so that groups contained approximately equal numbers of hospital separations.
As can be seen from Table 4.6, on average over 75% of the Aboriginal and Torres Strait Islander population in Queensland live within 60 kilometres of a cardiac rehabilitation service while the remaining two ARIA++ groups have an average journey of over 150 kilometres to the nearest cardiac rehabilitation service. Although the data suggest that the separation rates in this latter group are higher, it is unclear if this was related to better identification of Aboriginal and Torres Strait Islander patients in more remote areas or an increased likelihood of cardiac illness in those admitted to hospital.
table 4.6: age-adjusted separation rates, raw cases, average kilometres to cardiac rehabilitation and indigenous population for Queensland by aria++ grouping
Group aria++ range age-adjusted separation rate/1000 grouped by aria++ cases average km to cardiac rehabilitation total indigenous population 1 0 to 0.5378 47.7 594 11.7 37,310 2 0.5425 to 3.3134 48.6 604 25.1 32,176 3 3.3146 to 10.0755 63.1 595 58.4 23,238 4 10.1765 to 15.6259 68.2 623 154.5 17,733 5 15.9062 to 17.8768 75.5 546 373.9 14,917
As in the Northern Territory, cardiac rehabilitation services are concentrated in urban and regional settings, with a rapid decline in availability of these services in more remote communities. The distribution of primary or community health services in more remote communities highlights the opportunities for cardiac rehabilitation services to work closely with local health services to ensure continuing support for those who have experienced a cardiac illness.
table 4.7: relative access to cardiac rehabilitation services and other health services by aria++ grouping for Queensland
Group aria++ range cases community/
primary health care Services cardiac rehabilitation services total indigenous population 1 0 to 0.5378 594 40 22 37,310 2 0.5425 to 3.3134 604 46 15 32,176 3 3.3146 to 10.0755 595 110 21 22,870 4 10.1765 to 15.6259 623 70 8 17,733 5 15.9062 to 17.8768 546 46 1 14,917
The distribution of separations by ARIA++ groupings, cardiac rehabilitation services and primary and community health services for Queensland is presented in Map 2.
Eligibility for cardiac rehabilitation
For detailed viewing of this map, please see the CD-ROM.
map 2: Separation rate (per 1,000) by postal areas grouped by aria++ for Queensland
South australia
The population estimates for South Australia were derived on the basis of three former ATSIC regions. In order to limit difficulties associated with assumptions underpinning the method for developing experimental estimates of the Aboriginal and Torres Strait Islander population, ARIA++ data were partitioned into three groups with comparable numbers of individuals who had been recorded in hospital separations data.
Review of the raw data provided by the South Australian Department of Health suggested that approximately 20% of cases (153) related to one postal area and a
8 Eligibility for cardiac rehabilitation
Australian Health Department failed to provide an explanation for the apparent over representation of these two postcodes. It was noted that South Australia had included a weighting for Aboriginal and Torres Strait Islander Peoples in casemix funding systems and that this may explain the higher than expected reporting of Indigenous separations, and the apparent concentration of cases in a limited number of postal areas.
In South Australia, over 50% of the Indigenous population live in postal areas with an average distance to the nearest cardiac rehabilitation service of 6.9 kilometres. Nevertheless, approximately one third of hospital separations in 2003–04 for Indigenous people, where cardiac illness was identified, related to the group of postal areas that had an average distance to the nearest cardiac rehabilitation service of over 100 kilometres. The distribution of these postal areas (see Map 3) shows that many of these postal areas are considerably further than 100 kilometres from the nearest cardiac rehabilitation service.
table 4.8: age-adjusted separation rates, raw cases, average kilometres to cardiac rehabilitation and indigenous population for South australia by aria++ grouping
Group aria++ range age-adjusted separation rate/1000 by aria++ cases average km to cardiac rehabilitation total indigenous population 1 0.0 to 0.4505 59.5 263 6.9 12,171 2 0.4829 to 4.7803 94.5 266 33.1 6,201 3 4.9174 to 17.3400 94.4 254 119.4 5,271
The distribution of cardiac rehabilitation services in South Australia includes four sites in areas where the ARIA++ score was greater than 15, which are in locations assessed as remote or very remote. Primary or community health services are more accessible in remote areas in South Australia providing a potential resource for cardiac rehabilitation and secondary prevention.
table 4.9 relative access to cardiac rehabilitation services and other health services by aria++ grouping for South australia
Group aria++ range cases community/
primary health care Services cardiac rehabilitation services total population 1 0.0 to 0.4505 263 14 13 12,171 2 0.4829 to 4.7803 266 18 9 6,201 3 4.9174 to 17.3400 254 39 4 5,271
Eligibility for cardiac rehabilitation
.
For detailed viewing of this map, please see the CD-ROM
map 3: Separation rates (per 1,000) by postal area grouped by proximity to a cardiac rehabilitation service for South australia
Western australia
The hospital separation data provided by Western Australia differed from that of other jurisdictions in two ways. Firstly, the Health Department of Western Australia operates a unit which specialises in linking hospital data to allow identification of individuals across hospitals and separations. As a result, there is a high degree of confidence that double counting of individuals was minimised in the data set provided for the analysis.