Advances in Computer Science and Information Technology (ACSIT)
Print ISSN: 2393-9907; Online ISSN: 2393-9915; Volume 2, Number 5; April-June, 2015 pp. 464-468 © Krishi Sanskriti Publications
http://www.krishisanskriti.org/acsit.html
Big Data: An Introduction, Challenges & Analysis
using Splunk
Satyam Gupta1 and Rinkle Rani2 1,2
Department of Computer Science & Engg., Thapar University, Patiala, 147001 INDIA E-mail: [email protected], [email protected]
Abstract—Big Data is a fast emerging field. Now day’s Big Data
technology getting big attention. Big data is not a single thing; it is interdisciplinary field which covers almost all fields of IT. Technically Big Data can be define by “very large volume of heterogeneous data generated at very high rate that’s need to be managed by innovative hardware and software tools.” In this paper main focus has been done on the Big Data challenges and phases of Big Data analysis i.e. data generation, data acquisition, data storage, data analysis and Big Data application. In this paper we have explored a tool “Splunk” for data analysis. It capture indexes of given data set and correlates those indexes with real-time data in a way, that we can generate reports, graph, and alerts, for better visualizationsof data.
1. INTRODUCTION
Over the past few years data has increased in very large scale in many fields. According to report of International Data Corporation (IDC) in 2011 overall copied and created data size in the world was 1.8ZB, which increased by nearly nine times within 5 years. [1] 90% of data in the world has been created in last two years. According to the Gartner Company “Information will be the 21th century oil”.[5] There is very large amount of data circulating over the internet, according to survey about 12TB tweets are generated every day, Facebook generate 25TB logs every day. On average 72 hours of videos are uploaded on YouTube in every minute [3]. Google’s Eric Schmidt claims that every two days now we create as much information as we did from the dawn of civilization up until 2003[2].
According to Economist (2010) Data are becoming the new raw material of business, economic input is almost equivalent to capital and labour. [10] The Big Data means “the datasets that could not be perceived, acquired, managed, and processed by traditional software/hardware tools within a tolerable time.”[2]
According to this definition few years back which data was Big Data with respect to that time hardware and software, now a day that data is not Big Data because of availability of manageable tools. IDC define Big Data as “Big Data technologies defines a new generation of technologies and architectures designed to economically extract value from very
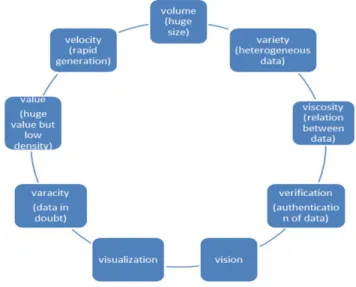
large volume of a wide verity of data by enabling the high-velocity capture, discovery and analysis.”[1]. Big Data is not only concern with large amount of data but it is also concern about what data is generated and from where it is generated. To describe Big Data 3V’s model [5] is given in which volume, velocity and verity of data define Big Data.
According to size data is divided into 3 categories which are Big Data, very Big Data and massive data. Traditional data management system is based on RDBMS. In RDBMS we only analyse the structured data, for unstructured and semi structured data RDBMS has its limitations.
Fig. 1: Different V’s of Big Data
We have explored a tool “Splunk” for data analysis. It capture indexes of given data set and correlates those indexes with real-time data in a way, that we can generate reports, graph, and alerts, for better visualizationsof data. The main aim of Splunk is to make machine data reachable over an organization & identify pattern of data to provide intelligence in business operations and find out the errors. This is a horizontal technology that is use for diagnose security related issues and web services, and to explore that machine data in a better way. The use of splunk is very much easy. It is
easy to set up there is no need to design schemas for exploring the splunk, the GUI of this software is very interactive that make it very user friendly. Now a day almost 7000 organisations are taking advantage of splunk and providing improved services. The deployment of splunk is widely spread across the globe more than 90 countries are using splunk [12].
2. DEVELOPMENTS OF BIG DATA
Concept of database has been arrive in late 1970s on that time the data size is not very large, we are rapidly moving from file base system to Data base machine.[6] On those days database machine is used for storing and analysing the data but due to increasing size of data demand of technology to handle it also increase.
In the 1980s the concept of share nothing a parallel database arrive to process and store that increased data. This concept is based on clustering in every machine have its own processor, storage and disk. This system becomes very popular in late 1980. [7] But challenge to this system arrives with the growth of internet services, indexes and queried content growing. The data produced by internet in real time and very large data now this time to move to new technology .Google created GFS [7] and MapReduce[8] program-mining to meet that challenge . Now a days from past few years all major organizations like Google, Facebook, Yahoo, Amazon, IBM, Oracle and many more have invested lot of effort on this Big Data technology, since 2005 IBM have invested around 16 billion on it. A survey report states that more than 37.5% of big organizations take analysing Big Data as their biggest challenge. In June 2011 IDC published a report on “Extracting values from Chaos” [1] which introduce concept of potential of Big Data first time.
Some governments also show their interest over this technology such as Obama government announced 200 million investments in March 2012. In July 2012 Japan government also stared such type of program. According to the 2014 IDG Enterprise Big Data Research study, businesses in 2014 will invest around 8 million on Big Data-related initiatives. According to a survey by McKinsey a retailer can increase its operating profit by 60% with the help of Big Data. According to Gartner, Big Data will drive 232 billion in spending through 2016 [5]. Estimation is that the data produce in 2020 will be 44 times larger than it was in 2009.
3. PROCESSES EVOLVING IN BIG DATA ANALYSIS
Fig. 2: Whole process of Big Data analysis
3.1 Data generation: This is the very first step to Big Data analysis. Very large amount of data is generated every day. Such data may be valueless when treated individually but while combine with other field it reflects very rich values.
3.2 Data acquisition: Aim of this phase is to collect that
huge data that is generated from different fields. Only to capture data is not the purpose of data acquisition, data acquisition means to prepare the data for analysis. Data acquisition has 3 different phases like as
Data collection Data transportation Data pre processing
3.3 Big Data storage: Data growth is very high to
accommodate that data we need better and large storage systems. There are various storage systems are to meet this challenge.
3.4 Big Data analysis: data analysis mean to use proper
statistical methods for analyze massive data.
4. CHALLENGES RELATED TO BIG DATA
Big Data research is still in its early stage there are some fundamental issues regarding Big Data are
4.1 Theoretical research
Fundamental problems: There are very less structured
data; almost every data set is highly unstructured. There is still requirement of design some better algorithms to convert unstructured data to some key valued data.
Standardization: Data is generated from various
heterogeneous sources so there are no common standards for all data.
Computing modes: There are some technological
problems over this Big Data analysis, like for data analysis efficient machines are not available in much amount, communication is a bottleneck for this computing.
4.2 Technology development
Format conversion of Big Data: Because of
heterogeneous data there is no common format for all data. For analysis we need to convert all formats to some common format.
Data transfer: Data is very large so distributed over the
network, to perform operation on that distributed data we need to communicate over the network.
4.3 Practical consequence
Data management
Capture, mine and analyse the data
Integration of data
Big Data application 4.4 Data security
Data privacy: Data privacy may leak while we performing
storage because data is we large, such data like habits user updates are not important individually but on integration can define personal information of any person.
Data Gener ation Data Acquis ition Data Storage Data Analysi s
Satyam Gupta and Rinkle Rani
Advances in Computer Science and Information Technology (ACSIT)
Print ISSN: 2393-9907; Online ISSN: 2393-9915; Volume 2, Number 5; April-June, 2015 466
Data quality: Low quality data is wastage of storage and
analysis cycle. Data quality can be degrade while capturing or transmission.
Ownership of data: Many data is not available for
analysis because of ownership issues. Owner of data is not willing to provide that data
Big Data safety management: To provide security to data
we need to apply cryptography technique to data, it is very difficult to apply encryption and decryption over such a Big Data
5. WHY SPLUNK?
5.1 Operational Intelligence: Organizations are come to
know that critical business data resides in their machine data. Machine data have a definitive record of all activity and needs of your customers, your product users, all business transactions, applications data, networks data, servers and sensors data. Splunk Enterprise converts machine data into a real-time operational intelligence, which enables organizations to monitor, analyze search, visualize and act on the huge streams of machine data generated by different sources.
5.2 For Every User: Splunk easily adjusts on the demands of
any user. For Technical users there are advanced features that allow them to gain quickly insights from their data. For business users there is feature of familiar data analysis to visualize interfaces to achieve powerful insights. For the network engineers, developers, system administrators, and security analysts, there is feature of real-time understanding.
5.3 Helpful in Strategy making: Splunk makes a common
platform for organization's machine data to be accessible and usable for peoples who wants it. Many peoples starts using Splunk Enterprise for specific problem area, quickly make their initial use case and then arrange it to other important areas of business like application management, operations management, security and infrastructure by using splunk they achieve new visibility for IT and business .
5.4 Analyze in dynamic environments: Splunk
continuously indexes all the machine data in real time and does not depend on inelastic schemas that limit flexibility and break when the data formats changes. Any clarification task on the data, such as extracting a common field or tagging a subset of hosts can be easily done as we search. One of the great features of splunk is incredibly flexibility.
5.5 Rapid analysis of large data: Splunk helps us to search
billions of events in very less time on a single commodity server. Splunk’s parallel architecture enables search & indexing performance measures linearly across commodity servers. Splunk’s distributed architecture measures from a single server to multiple data centers. Splunk has its own efficient data store and is not limited
by the throughput constraints or firm schemas of traditional databases.
5.6 Fast Payback: Splunk Enterprise is simple to explore,
and can be deployed from a single server to global large-scale. Downloading Splunk is free, and easy to install it in minutes on personal computers or on any commodity server. Use of splunk is a faster way to search and analyses.
6. WORKING WITH SPLUNK
Firstly Splunk perform indexing, which gathered all data from different locations and now combine that data into a centralized index. Before using Splunk, system administrator has to logon to many different machines for taking access to all the data.
Using these indexes, Splunk can easily search the logs from different servers quickly.
Now with its speed and accuracy splunk determine when a problem occurred in a faster way.
Splunk can then find out the time period when this particular problem initially occurred to determine its root cause. Alert massages are then being created for this particular problem.
By the feature of indexing and aggregating these log files from many sources and to make them centrally traceable Splunk becomes very popular among system administrators and other people who perform technical operations in the IT business around the world. Security analysts are using Splunk to find out security holes and attacks.
System analysts use Splunk to find inefficiencies over the system and to find bottlenecks in complex applications. Network analysts use this to find the root cause of network outage and bandwidth bottleneck.
7. EXPLORING SPLUNK TOOL
Splunk can read machine data from different sources. Common input sources are:
Files The network Scripted inputs
Before adding data to the splunk UI user must know Source type
Hosts Sources
7.1 For adding the file to Splunk UI
1. Login to the UI with the user name and password by default user name is admin and by default password is change me.
3. 4. 5. 6. 7. Click From f Select Skip p Click on the r Select a file th Click Save. Fig
files and direc
Fig
preview. radio button to
Fig
hat need to pro
Fig g. 3
tories the scre
g. 4 Upload and i g. 5 ocess. g. 6 en. index a file. Now w process helps to real-wo 8. CO The da location make a problem writing growing fast and Now a enginee can rapi REFER [1] Gan EM [2] Fac “htt ig D [3] Ma will Dol [4] Chu “Bi pro [5] In cha STA [6] DeW perf No [7] Wa seri
with the help ing language ( o transform m orld questions. ONCLUSION ata is expandi ns; it is very a sense of th ms manually o programs for g very fast no. d every time the a day’s splunk ers, system eng idly understand RENCES ntz J, Reinsel D MC Corporation, ct sheet: Big tp://www.whiteh Data fact sheet 2 ayer-Schonberger
l transform ho lan/Houghton M ui M, Brown B, ig Data: the nex
ductivity”. McK proceedings of allenge involves AMFORD, June Witt D, Gray J, formance databa 6, pp 85-98 ,199 alter T “Teradata ies on scalable d p of differen (SPL) we can mass of data int
Fig. 7
ing very fast difficult to br hat data. Eve over lot of lo r this analysis. of problems o ere is new prob k is very pop gineers and app
d machine data “Extracting valu Whitepaper, pp Data across house.gov/sites/d 2012.pdf” 2012. r V, Cukier K, ow we live, Mifflin Harcourt, Bughin J, Dobb xt frontier for Kinsey Global In f Gartner summ
more than just e 27, 2011. “Parallel databa ase systems”, A 92. a past, present, a data management nt commands analyze our re to a form that in different g ring all data t
ryone is tryin og files or so
. As the size occurred also g
blem.
pular tool amo plication devel a. . ue from chaos”, 1-12,June 2011 s the federal default/files/mic “Big Data: a re work, and th 2013. bs R, Roxburgh innovation, com nstitute. Whitepa mit on “Solvin managing volu ase systems: the ACM communic and future”. UCI
t”,2009. of Search esult. Splunk t can answer geographical together and ng to solve ometimes by of data was growing very ong network lopers which Sponsored by . government crosites/ostp/B evolution that ink.” Eamon C, Byers AH, mpetition, and aper, 2013. ng Big Data umes of data”, future of high cation Vol. 35 I ISG “lecture
Satyam Gupta and Rinkle Rani
Advances in Computer Science and Information Technology (ACSIT)
Print ISSN: 2393-9907; Online ISSN: 2393-9915; Volume 2, Number 5; April-June, 2015 468
[8] Ghemawat S, Gobioff H, Leung “The google file system”. In:
ACM SIGOPS Operating Systems Review, vol 37. ACM, pp 29-43, June 2003.
[9] Brewer EA ” Towards robust distributed systems.”, In ACM
Symposium on Principles of Distributed Computing, Portland, Oregon , June 2000.
[10] The Economist, July 2010
[11] Karamjit Kaur and Rinkle Rani, "Modeling and Querying Data
in NoSQL Databases", IEEE International Conference on Big Data, 2013, pp 6-9, Oct. 2013.
[12] “http://www.splunk.com/view/benefits”
[13] splunk tutorial
“http://docs.splunk.com/Documentation/Splunk/4.2/User/Welco metotheSplunktutorial ”.
[14] Jinchuan CHEN, Yueguo CHEN, Xiaoyong DU, Cuiping LI,
Jiaheng LU, “Big data challenge: a data management perspective”,Higher Education Press and Springer-Verlag Berlin Heidelberg Vol 7, No 2, pp 27-30 February 2013.
[15] Xindong Wu, Fellow, Xingquan Zhu, Gong-Qing Wu, “Data
Mining with Big Data”, IEEE transactions on knowledge and data engineering, vol. 26, no. 1, January 2014