Reports
White Paper
In today‟s fast paced communications center environment, information is power.
Zeacom‟s reporting capabilities provide data that is meaningful and easy to analyze so that managers can accurately measure contact center and voice
messaging performance. Managers get the statistical output needed to make informed management decisions, prioritize goals and set performance standards. Administrators can review general system operation statistics, configuration details, usage, call frequency and duration.
Introduction
Zeacom Communications Center‟s on-board database collects „cradle-to-grave‟
statistics on every facet of every call – whether phone, email, fax, web chat or
callback. In contrast to many other reporting packages you can report on all types of
communication within your enterprise from the one platform, with your choice of more
than 200 predesigned reports and graphs.
ZCC Reports were designed by our customers for real business practice, to inform
management about the entire enterprise, covering all staff from executives and
knowledge workers through contact center agents to the console operator.
.
Table of contents
Overview ... 1
Report Categories ... 1
Queuing Reports ... 1
Features ... 1
Benefits ... 2
Detailed Features ... 2
Standard reports and graphs ... 2
Details of every call ... 2
Queuing report categories ... 2
Detailed reports ... 2
Queue Performance... 2
Queue Traffic Analysis ... 2
Queue Traffic Comparison ... 3
Queue Service Level ... 2
Queue Multimedia ... 2
Queue Transferred Calls ... 3
Agent Performance ... 3
Agent Activity ... 3
Agent Availability... 3
Agent Snapshot ... 3
Agent Summary ... 3
Agent Multimedia ... 3
X-Seconds ... 3
Callback Analysis ... 3
Call Type Analysis ... 4
Call Tracking ... 4
Wrapup Code ... 4
Agent Wrapup Code ... 4
Queue Wrapup Code ... 4
Departmental Inbound and Departmental Outbound... 4
Held Calls ... 4
Indial Calls ... 4
Indial Performance ... 4
Indial Traffic Analysis ... 4
Auto Attendant Option ... 5
Estimated Time to Answer (ETA) Performance ... 5
Mode Change ... 5
Historical Queuing Reports ... 5
Queue Historical ... 5
Queue Historical Average ... 5
Agent Historical Average ... 5
Callback Queue Historical ... 5
Callback Agent Historical ... 5
Examples of Graphs ... 13
Running a Queuing report ... 14
Parameters ... 14
Level of detail ... 14
Setup ... 15
Voice Messaging Reports ... 16
Features ... 16
Benefits ... 16
Mailbox Profile ... 16
Mailbox Summary ... 16
Notification Attempts ... 16
Voice Messaging Auto-Attendant Option ... 16
Voice Messaging Usage ... 17
Mailbox Profile Report Example ... 17
Running a Voice Messaging Report ... 19
Parameters ... 19
Level of detail ... 19
Fax Reports ... 20
Features ... 20
Benefits ... 20
Inbound Queue Fax ... 20
Outbound Queue Fax ... Error! Bookmark not defined. Fax Destination ... Error! Bookmark not defined. Outbound Fax Messaging ... Error! Bookmark not defined. Outbound Queue Fax ... Error! Bookmark not defined. Inbound Fax Messaging Report Example ... 21
Inbound Queue Fax Report Example ... 22
Outbound Fax Messaging Report Example ... 23
Operator Reports ... 24
Features ... 24
Benefits ... 24
Console Performance ... 24
Console Traffic Analysis ... 24
Console Service Level ... 24
Console Transferred Calls ... 24
Console X Seconds ... 24
Operator Call Type Analysis ... 24
Operator Performance ... 24
Operator Summary ... 25
Console Performance Report Example ... 25
Running a Console Report ... 26
Parameters ... 26
Level of detail ... 26
Console Report Parameters Example ... 26
Media Viewer ... 27
Features ... 27
Benefits ... 27
Level of detail ... 29
System Reports ... 30
Features ... 30
Benefits ... 30
Agent Setup ... 30
Announce Exception ... 30
Announce Usage ... 30
Audit Trail ... 30
Auto Attendant Setup ... 30
Class Setup ... Error! Bookmark not defined. Customer Query Setup ... 30
Delivery Pattern Setup ... 30
Group Setup ... 30
Line Setup ... 31
Phonebook Setup ... 31
Progress Setup ... 31
Query Database Setup ... 31
Queue Setup ... 31
Site Notes ... 31
Wrapup Setup ... 31
Presence Reports ... 32
Personal Reports ... 35
Features ... 35
Benefits ... 35
Example – Adding a new Personal Report ... 36
Example – Using the wizard to customize a Personal Report ... 37
Overview
Operator Reports enable you to analyze Console use statistics. Choose specific operators, queues or Indials to be included in your report.
Queuing Reports make it easy to analyze how queues and agents are handling customer contacts. You can also review general system operation and call frequency or duration. Voice Messaging Reports assist you to analyze how users are utilizing their mailboxes and to review your system configuration.
Security privileges control your ability to log in and generate reports.
Report Categories
CT Control queues and prioritizes calls to your contact center. Agents can log out or take a break from Agent Desktop. Once CT Control recognizes that an Agent is available to take delivery of a call, it then routes the call to Agent Desktop.
Reports are divided into the following main categories.
Detailed Reports - Overviews information on a short-term basis, i.e., daily
Historical Reports - Reviews information on a long-term basis, i.e., monthly or weekly Voice Messaging reports - Reviews voice
messaging and mailbox use information Operator Reports - Reviews operator calls
and Console use information
Fax Reports - Overviews information about inbound and outbound fax usage.
Personal Reports - You can set up your own Personal reports section for commonly used reports. Batch and schedule reporting are available.
Queuing Reports
Queuing Reports1 deliver the comprehensive management information that contact center managers need to effectively manage their operations and staff. Information comes in a variety of easy-to-understand formats including charts and graphs. Information can be provided on a per agent basis. From the time the contact arrives at the organization through to the time it terminates, valuable data is being collected about each call and the agents who handle it.
Ensure operating parameters can be measured and improved by using Zeacom Communications Center‟s complete reporting package that makes accessing critical information simple and efficient, regardless of whether the contact was a Phone call, Email, Web Chat or a Web Callback request.
Features
Total flexibility to configure and run reports based on any operating parameter and time period required.
Access to both detailed and historical reporting data for additional reporting options and long-term trend analysis.
Full multimedia reporting capabilities, on a per-queue and per agent basis.
Report Wizards to simplify the report generation process with On-Line Help information on what each report covers. Every detail of every call into the contact
center can be reported on
Reports can be scheduled. You can schedule a pre – defined Personal Report to run every day, week, or month, or print automatically. Access to all reports and user records is
controlled by security settings; some users may benefit from running
Presence/Productivity reports and can be restricted to viewing their own data only
Benefits
Costs are reduced, revenues increased and customer satisfaction is improved by ensuring your Call Center is staffed appropriately for call volume fluctuations, reducing
abandonment at peak times.
Agent productivity is increased because Supervisors can monitor the service levels of these media types in the same way they currently manage phone calls.
All agents can be reviewed and assessed against quantitative standards and evaluated, therefore providing valuable management information to improve contact center performance.
Wrapup code reports analyze the impact of marketing campaigns, for example, the increase in call volumes at the time the advertisement was run.
Managers are provided with the tools they need to solve problems, for example, why did the abandoned call rate increase by 10%? System setup reports offer contact center
managers a simple overview of contact center configuration. Easily printed, these reports allow managers to make notes against configurations, not only as a hard copy, but also in soft copy within Zeacom
Communications Center Administrator itself. Scheduled Reports reduces repetitive
interaction by a reports user, saving valuable time.
Detailed Features
Standard reports and graphs
Detailed reports with associated graphs Historical reports with associated graphs System reports
Details of every call Wait time
Agent the call was delivered to After call Worktime
Queuing report categories
There are six general categories of Queuing reports available within Communications Center. These include:
Detailed queuing reports Historical queuing reports System reports
Personal reports Media Viewer Fax
Presence
Detailed reports
Detailed reports use records that are stored for a limited amount of time. These enable managers to report on individual call statistics or specific agent activity and investigate the overall performance of the contact center. The report types available are: Queue Multimedia
This report provides a breakdown of total calls by media type. Supervisors can also obtain
information on individual queues via the Queue Performance report but if they want a
representation of general call center activity, the Queue Multi Media report provides the best overview of total activity by media type. Queue Performance
This report evaluates the contact center‟s performance on a call-volume-per-queue basis, including daily averages, total calls for each queue and whether the target answering time for the contact center is being met.
analysis. Comparing this report with the queue traffic analysis report allows managers to analyze how their service level has been affected during call peaks and troughs throughout the day. Queue Traffic Analysis
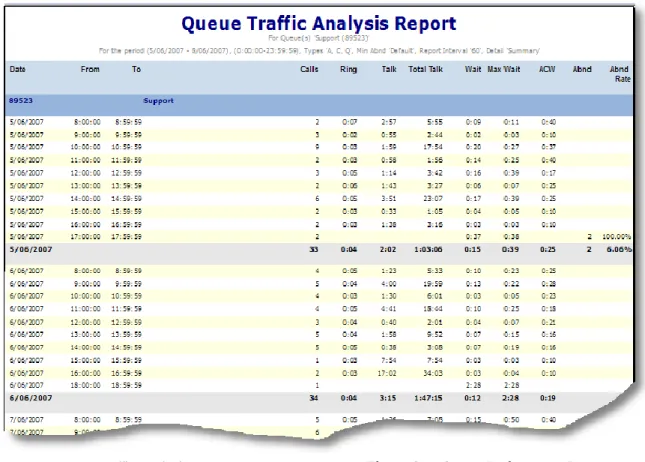
This report provides statistics on queue calls by time period e.g., by the hour, and gives subtotals. Managers can identify times of peak call volume and schedule resources around these periods, and compare the time slots for different days or same days in previous weeks e.g., compare call volumes daily between 7am and 8am or compare Monday volumes between 7am and 8am.
Queue Traffic Comparison
This report provides statistics on a group of queues by time period e.g., by the hour. The Queue Traffic Comparison also provides a breakdown of the service level achieved within these time periods. Managers can identify times of peak call volume and schedule resources around these periods and discover how many calls a team or department have handled during the different time slots. They can also indicate the time slots where the Service Level is
unsatisfactory, and peak times when call volumes are high.
Queue Transferred Calls
This report provides information on calls that have been delivered via the queue to an agent and then transferred onwards. It is a good tool to track whether callers are being dealt with by the right agent, agents that need up-skilling or advanced functionality is required for the caller (such as CLI routing and Preferred Agent).
X-Seconds
This reportprovides an alternative report of your queue performance by totaling call wait times into time slots. This is useful when you need to measure queue performance based on an "unacceptable wait time" in your queue. The X-Seconds report also is helpful for analyzing abandoned calls.
Agent Activity
This report is a timeline report to identify agents‟
shows what the agent was doing and for what amount of time.
Agent Availability
This report shows the net availability of agents and details all actions that made agents
unavailable for calls. Managers can assess why service levels are not being achieved, and comparing Queue Traffic with Agent Availability they can modify the contact center‟s shift times or procedures to maximize performance
Agent Multimedia
This report provides statistics for individual agents across multiple media types. Managers can identify the different types of calls/contacts agents are handling, and their frequency.
Agent Performance
This report examines the performance of contact center agents individually with daily averages and totals for each agent as well as the details of each call. Managers can help agents reach
performance criteria expectations and can recognize top performers.
Agent Snapshot
This reports breaks down Agent activity by time period with regard to total queue, direct, outbound calls, Abandons, Average Talk, Average after Call Worktime, Handle Time, and Average Staff available by time period.
Agent Summary
This report monitors the performance of agents both overall and in detail. Managers can identify Agent availability, Call type and Call duration and use the summary to aid training and procedure planning.
Agent Break/Worktime Reasons
The Agent Break/Worktime Reasons report reports on every instance of breaks and worktime, sorted by agent, for the selected date range. Break/Worktime Reasons
The Agent Break/Worktime Reasons report reports on every instance of breaks and worktime,
Call Tracking
This report provides start-to-finish data for phone calls based on specified parameters. Calls are grouped by date, by time. This report shows calls by any (or combinations) of the following:
Agent or groups of agents – calls made or received while logged in.
Queue (or queue groups)
Phonebook – company and /or contact CLI
Using the call tracking report, managers can trace a call from beginning to end and plan
improvements for customer service techniques and general telephony standards of service. Callback Analysis
This report matches Callback peaks with traffic peaks in the queues. This report also
demonstrates the efficiency of the Callback process and its resolution.
Call Type Analysis
This report illustrates contact center traffic for each agent and compares agents‟ daily performance.
Agent Wrapup Code
This report matches the Wrapup codes entered against inbound calls by agents. Managers can determine how many calls were repeats,
complaints, successful resolutions, new sales or results from the latest advertising campaign. They can also see the proportion of calls that actually have a Wrapup Code ascribed, and identify agents who are not entering Wrapup codes against calls.
Queue Wrapup Code
This report can show the kind of calls that are received and handled by queues. Displays calls broken down by Wrapup codes i.e., how many calls were quotes, re-queries, complaints, successful resolutions or the result of a recent
Wrapup Code
This report lists every call and call subtotals, with Wrapup code information, hourly, daily and for the specified report period. The summary consists of hourly, daily and overall bands, and the total summarizes daily and overall bands. Departmental Inbound and Departmental Outbound
These reports measure the inbound and outbound traffic on department extensions and queues so that users can determine the frequency and nature of inter-department traffic. This report provides details of every call transaction for the specified department.
Held Calls
This report provides statistics for held calls, showing how its time is broken up between talk, hold, and wait time. For each call, it shows how long the call is held for compared to how long the agent spends actually talking with the caller. Indial Calls
This report shows an hourly summary of call origin on your Indial numbers by:
number of call types received date and distribution of calls
average time that this type of call spent waiting in the queue
average time the call took to be answered after being delivered to an agent
average time spent talking to this type of caller
Indial Traffic Analysis
This report provides an overview of Indial call activity by queue for a contact center, specifically call frequency, call wait time and length, and abandoned calls. Using this report, you can analyze Indial call traffic to determine the busy and quiet times for your contact center, and to allocate your resources and schedule breaks
Indial Performance
This report measures the traffic on Indial numbers. It also includes queue-specific breakdowns of calls for each Indial number. Auto Attendant Option
This report provides statistics on how many times each Auto Attendant key option was selected by callers, for each queue.
Estimated Time to Answer (ETA) Performance This report evaluates how well a contact center is responding to calls, based on the „Estimated Time to Answer‟ announced to callers. Specifically, this report measures how well the promised answer time for the contact center is being met. The report evaluates phone calls only, because emails and web Callbacks do not currently receive ETA announcements.
Mode Change
This report displays details of queue mode changes, including manual and automatic changes and which user performed the change. The report parameters can be defined by time and queues.
Historical Queuing Reports
Detailed records are automatically archived at midnight. The archived information is typically kept in a detailed format for up to four months before being automatically being converted into summary form for use in historical reports. Some of the most typically used historical reports include:
Queue Historical
This report compares queue analysis on all archived data and provides queue traffic analysis comparisons on data that is older than the archive period. Managers can drill-down on interesting events and create a long term view of queue performance.
Queue Historical Average
This report provides the same information as the
values are shown as averages instead of totals. Managers can perform queue traffic analysis on averaged daily call data that is older than the archive period.
In-dial Historical
This report measures the traffic for individual In-dial numbers to your Queues using historical data Agent Historical
This report compares totals of all agents over a time frame that is older than the archive period. Agent Historical Average
This report provides the same information as the agent historical report but compares average values. Managers can drill-down on interesting events and compare agent average analysis on all archived data.
Callback Queue Historical
This report provides the same information as the Callback Analysis report, but over a longer period. Managers can analyze Queue Callback using historical data.
Callback Agent Historical
This report provides similar information to the Callback Analysis report but subtotals data by agent. Managers can analyze Callbacks on a per-agent basis, using historical data. Examples
Selections of commonly used reports are shown below.
Figure 3. Agent Performance Report
Multimedia Reporting
Reports
This table shows which reports are available for each media
Report Name Phone Chat Web Callback Fax Email
Queue Performance
Queue Traffic Analysis
Queue Traffic Comparison
Queue Service Level X
Queue Multimedia
Agent Performance
Agent Activity
Agent Availability
Agent Snapshot
Agent Summary
Agent Multimedia
X-Seconds X
Callback Analysis
Call Type Analysis X X X
Report Name Phone Chat Web Callback Fax Email
Wrapup Code
Queue Wrapup
Agent Wrapup
Departmental Inbound
X X X X
Departmental Outbound
X X X X
Held Calls X X X X
Indial Calls X X X X
In-dial Performance
X X X X
In-dial Traffic Analysis
X X X X
Auto Attendant Option
X X X X
ETA Performance
Mode Change
Queue Historical
Queue Historical Average
Report Name Phone Chat Web Callback Fax Email Agent Historical
Average
Callback Queue Historical
X X X
Callback Agent Historical
X X X
In-dial Historical X X X X
Agent Setup X X
Queue Setup
Graphs
Once a report is run it can be transformed into graphical format that is bright and easy to
understand. A variety of graph types are available depending on your requirements. The following Communications Center reports once run, offer associated graph views.
Rin g Tim e T alk Tim e Call Du ratio n T o tal Calls Ab and o n Call s
Call Distribu
tion Calls & Ab and o n s W ait T im e Ab and o n men t Rat e L o n g es t W ait Q u eue S e rvi ce L ev el Queue Performance
X X X
Queue Traffic Analysis
X X X
Queue Service Level
X X X X X X X X X X
Agent Performance
X X X X
Queue Historical
X X X X
Queue Historical Average
X X X X
Agent Historical
X X X X X
Agent Historical Average
X X X X X
Operator Performance
Graph Definitions
Calls and Abandons
A comparison of all answered and abandoned calls for selected queues.
Wait Time Wait time is measured from the time the call first enters the telephony switch to when the agent picks up the receiver.
Ring Time Ring time is measured from when the agent's phone starts ringing to when it stops ringing.
Talk Time Talk time is measured from when the agent's receiver is picked up to when the agent's receiver is replaced.
Call Duration
Accumulations of call wait time, ring time and talk time. Effectively, the period of time from when a call enters the system to when the caller hangs up.
Abandoned Calls
Abandoned calls are those where, at any point after entering the queue or being delivered to an agent, the caller hangs up. Calls abandoned in less than the value specified as the Minimum Abandon time (in the setup parameters) will be ignored.
Abandonment Rate
The percentage of the total incoming calls in the queues that were abandoned.
Longest Wait Longest period a call went unanswered in this queue. Call
Distribution
Proportion of total calls to your contact center (given any exclusions) to each queue. Total Calls Total calls received for these
queues/agents.
Service Level Service Level achieved by each selected queue for each
selected interval. This is the only graphical option available for the Service Level reports.
Examples of Graphs
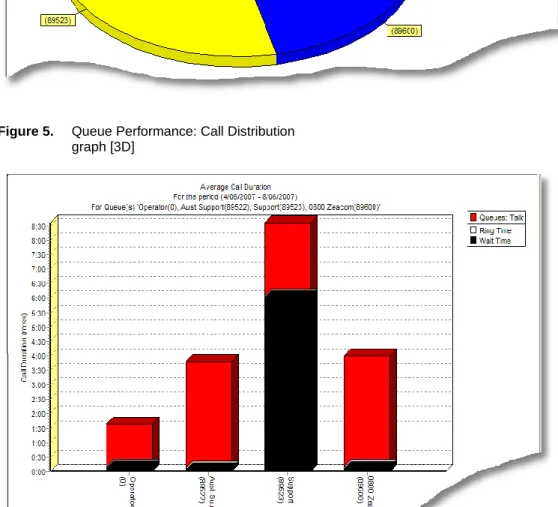
Figure 5. Queue Performance: Call Distribution graph [3D]
Running a Queuing report
ParametersThe following features allow managers to better define the parameters for their report:
Media type(s) – phone, email, fax, web chat, web Callback
Start and end date, and specific time the report should cover
Queue number(s) to include Queue group(s) to include
Call types – (e.g., I = Inbound queue calls, O = Outbound calls2, A = Abandoned calls3). Agent(s) to include
Agent group(s) to include
2 Managers can select a minimum outgoing duration –
Level of detail Empty Records
By default, only records that exist will be printed. Selecting 'show empty records' will show zeros against a period when there are no calls to report on.
Detail Level
There are 4 options of detail level for each report: Monthly breakdown – One line of totals per
month
Totals only – One totals line per queue/agent Summary – A totals line per queue/agent and
a total line per day
All details – A totals line per queue/agent, total line per day and one line for each record
Setup
In this example Queue Performance Report parameters are shown:
Figure 7. Configuration Parameters
A variety of date selection criteria is available to allow users to define the period the report will cover. Absolute allows you to specify the actual calendar date; Relative allows you to specify the date relative to the day you run the report and Custom allows you to specify a formula using the parameters shown
Include the Queues or Queue Groups you want to report on by checking the appropriate boxes
Voice Messaging Reports
Voice Messaging Reports4 assist Administrators to identify any areas of the system that require maintenance or users that need assistance. The report use records from your system's voice messaging configuration and voice messaging usage activity. Here you can view the voice messaging setup and mailbox usage.Voice Messaging Reports are designed to be run daily or weekly. The recommended run frequency is included with each report.
Features
View and document the Voice Messaging system setup
View details and status of each available mailbox
Configure and run reports based on time period required.
Use Report Wizards to simplify the report generation process with On-Line Help information on what each report covers
Benefits
Analyze how users are utilizing their mailboxes
Easily identify and provide assistance to mailbox users that have not set their mailbox up correctly.
Administrators are able to use these reports to analyze any area of the system that require maintenance e.g. A mailbox user has an unusually high number of messages taking up a large amount of disk space, or a user has left the company but their mailbox has not been deleted.
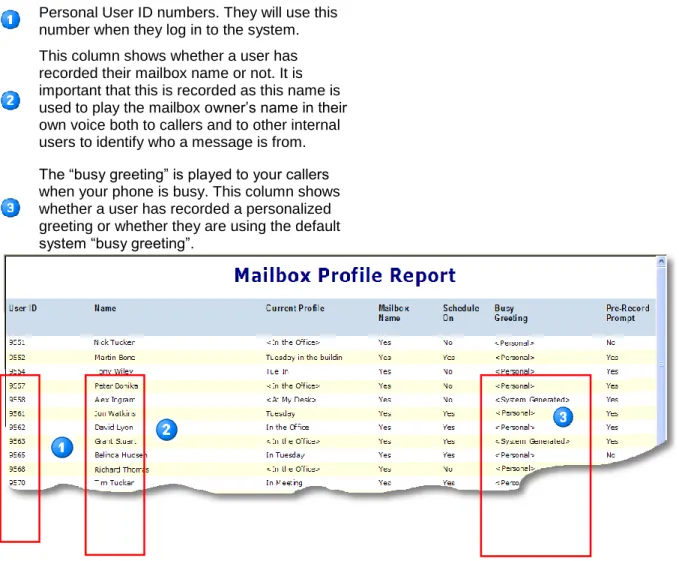
Mailbox Profile
This report shows the current configuration of each available mailbox in the system. It provides details such as the user‟s currently active profile, which standard greetings have been customized by the user and whether the user is using scheduled or manual Presence profiles. Use this report to identify which users have not activated their mailbox, are not using it correctly or require setup assistance.
Mailbox Summary
Run this report to review the current message status for all mailboxes in the system. The report provides a summary of the message status such as the number of new, saved and deleted messages in each mailbox. Use this report to identify any mailboxes that may require
assistance or have an unusually high number of new messages and how old these messages are. Mailbox Auto-Attendant
Run this report to analyze your Voice Messaging Auto Attendant actions over a specified period of time. This report is typically used for company, queue, or departmental mailboxes.
Notification Attempts
The Notification Attempts report provides an historical view of outbound notification statistics. Voice Messaging can be set up to notify any pre-specified address (dependent on user security settings) when a message is left in a mailbox. Users can set up a number of notification „profiles‟ to notify different types of destination (extensions, pagers, telephones, email) or different numbers. This report is useful to identify which address a notification was sent to and when the user logged in as a result of that notification. This report can also help to identify whether a user‟s notification settings are resulting in unnecessary toll call charges.
Mailbox Usage
Run this report to review voice messaging use and access history for all voice mailboxes. This can provide a daily summary of voice mail traffic for your entire system. This report can provide information for the current date, or historical information for dates within the past three months. Mailbox Profile Report Example
Personal User ID numbers. They will use this number when they log in to the system. This column shows whether a user has recorded their mailbox name or not. It is important that this is recorded as this name is used to play the mailbox owner‟s name in their own voice both to callers and to other internal users to identify who a message is from. The “busy greeting” is played to your callers when your phone is busy. This column shows whether a user has recorded a personalized greeting or whether they are using the default system “busy greeting”.
Notification Attempts Report
Example
Voice Messaging can be set up to notify any pre-specified address when a message is left in your mailbox. You can set up a number of notification „profiles‟ to notify different types of destination (i.e. extensions, pagers, telephone, email) or different numbers.
The type of notification sent – e.g.
Dial(number), Pager, Email, Forward etc. The destination number or address that the notification was sent to
Running a Voice Messaging Report
The Mailbox Profile and Mailbox Summary reports are static. They report the current mailbox
configuration and message status for all
mailboxes in the system. Simply select the report you require and it will automatically run.
Parameters
All mailboxes in the system are automatically included in the report. The following features allow managers to better define the parameters:
Absolute start and end dates
Relative date– choose a day or other period relative to today
Custom date – use a formula to customize parameters for a relative period (i.e. relative to today).
Specific times of each day the report should cover
Level of detail Empty Records
By default, only records that exist will be printed. Selecting 'show empty records' will show zeros against a period when there are no calls to report on.
Detail Level
There are 4 options of detail level for each report: Monthly breakdown – One line of totals per
month
Totals only – One totals line per mailbox Summary – A totals line per mailbox and a
total line per day
All details – A totals line per mailbox, total line per day and one line for each record
Fax Reports
Features
Fax Reports5 provide accountability and control of fax communications which increase customer satisfaction. The reports provide summary and detailed information on Fax delivery and sending. Reports can be run on all inbound and
outbound faxes
CLI and the details of the contact (if available) are reported for Inbound faxes received Reports can be run on a per mailbox or queue
basis
Details for faxes received by queues and/or personal mailboxes
Outbound reports provide information on how many pages were sent, the number of attempts and the result of each attempt Queuing reports include reply information
from Inbound queue faxes
Report Wizards and On-Line Help
Benefits
Details of how many pages were received and when are provided on a per mailbox basis
Users can choose between summary information and optional full details of fax activity
Names are provided in addition to CLI information when a match is found in the Phonebook
Wizards and Help simplify the report generation process and provide information on what each report covers
Inbound Queue Fax
This report provides statistics on call volume and sender details when faxes have been received by a queue.
Inbound Fax Messaging
The Inbound Fax Messaging Report allows you to report on faxes that have been received on a per mailbox basis.
Inbound Queue Fax
This report provides statistics on call volume and sender details when faxes have been received by a queue.
Outbound Fax Messaging
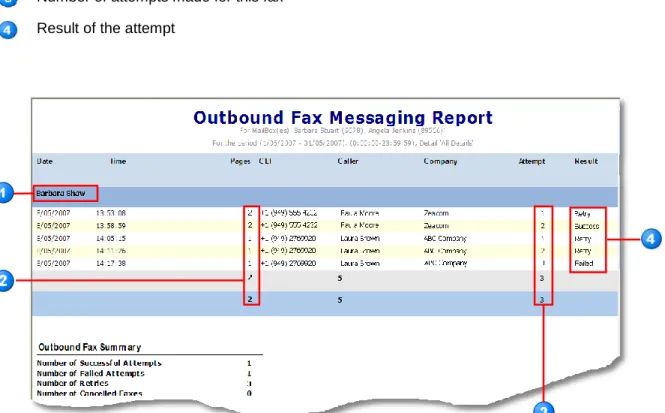
The Outbound Fax Messaging Report allows you to report on faxes that have been sent on a per mailbox basis.
Fax Destination
The Fax Destination Report allows you to list fax transmissions sent to selected fax numbers. Outbound Fax Messaging
The Outbound Fax Messaging Report allow you to report on faxes that have been sent on a per mailbox basis.
Inbound Fax Messaging Report Example Number of fax pages received into the user‟s mailbox
The CLI details of the contact sending the fax (if available)
The name of the contact (provided CLI is available and matches a Phonebook contact)
The company name from the Phonebook record (provided CLI is available and matches a Phonebook contact)
Inbound Queue Fax Report Example
Name of the Queue that received the fax CLI details of the contact sending the fax (if available)
Name of the contact (if CLI matches a Phonebook entry)
Company name of the contact (if CLI matches a Phonebook entry)
Outbound Fax Messaging Report Example User mailbox that the fax was sent from Number of pages that were sent Number of attempts made for this fax Result of the attempt
Operator Reports
Operator Reports6 enable you to report on individual operator and Console use statistics daily and assist you to easily identify „hot spots‟. Resources can then be scheduled accordingly to handle calls during these busy periods. Reports can be grouped on a per Indial basis and broken down into time intervals so Managers can easily identify „hot spots‟ and schedule their resources accordingly.
Features
Evaluate call volume performance on a per operator basis
Measure how well calls are being answered within target answering times
Analyze each call for each operator
Group calls on a per Indial basis in the report Configure and run reports based on specific
time of the day/date
Operator Performance Graphs
Choose specific Operators, Queues or Indials to be included in the report
Break reports into time intervals Report Wizards
On-Line Help
Benefits
Use your summary reports to aid training and procedure planning
Breaking a report down into time intervals allows you to more easily identify busy periods and therefore schedule your resources appropriately
Report Wizards simplify the report generation process
Use On-Line help for report information, how
Console Performance
The Console Performance Report provides data so that you can assess call volume performance on a daily basis per Indial. You can determine how well your target answering time for your contact center is being met by viewing daily averages and totals for each Indial. Run a detailed report to view individual calls. Console Traffic Analysis
This report provides a snapshot of the Operator's call activity, with calls grouped by in-dial for the Operator queue. Break the report into (e.g. 60-minute) intervals to easily identify busy periods. Console Service Level
This report provides a periodic snapshot of the Service Level on a per Indial basis. It reviews trends in service levels based on time of day. The Service Level is a single figure that represents answering performance for each Indial, requiring no further analysis. The parameters used to calculate the service level are taken from the Operator queue.
Console Transferred Calls
The Console Transferred Calls report identifies incoming calls transferred to another destination by a Console Operator. The calls are grouped by transfer destination i.e. all calls transferred to extension 5555 will be grouped together. Console X Seconds
Use X Seconds for an alternative report of your Console performance by totaling call wait times into time slots. Use this where you need to measure Operator performance based on an "unacceptable wait time" in the Operator queue. Also use X Seconds for analyzing abandoned calls.
Alternatively, change your setup parameters to simply divide your data into calls that queued and calls that had immediate delivery.
Operators. List all Operators and results on the same page, as an alternative format to the Operator Summary Report.
Operator Performance
The Operator Performance report examines the individual performance of your contact center Operators. Daily averages and totals for each Operator, and the details of each call, enable you to help your Operators reach your performance criteria expectations and to recognize your top performers. A minimum call duration buffer is available.
Operator Summary
The Operator Summary report monitors the performance of your Operators overall and in detail. Use this report to summarize operator availability, call type and call duration. This report provides a full breakdown of an Operator‟s shift.
Console Performance Report Example This example of a Console Performance report has been run in Summary format to provide daily statistics
Report is summarized by each Indial selected in the report parameters
Total calls per day summarized by Indial, including a grand total for all Indials Average wait time per day and total average for the period reported on Percentage of calls answered within target answering time as configured against the queue
Running a Console Report
Certain Console reports are designed to be run daily. Others, such as the Operator Summary report, can be run on a weekly or monthly basis. The recommended run frequency is included with each report
Parameters
Depending on the report type Console reports require you to select Queues, Indial numbers or particular Operators you wish to include in your report.
All Queues, Indials and Operators that belong to the company you have access to are
automatically available for selection in your report. The following features allow managers to better define the parameters:
Absolute start and end dates
Relative date– choose a day or other period relative to today
Custom date – use a formula to customize parameters for a relative period (i.e. relative to today).
Specific times of each day the report should cover
Level of detail Empty Records
By default, only records that exist will be printed. Selecting 'show empty records' will show zeros against a period when there are no calls to report on.
Detail Level
There are 4 options of detail level for each report: Monthly breakdown – One line of totals per
month
Totals only – One totals line per mailbox Summary – A totals line per mailbox and a
total line per day
Console Report Parameters Example Optionally specify a fixed daily start and end time Quickly select report parameters by selecting a period relative to today
Choose specific Indial numbers you wish to include in your report
Figure 14. Operator Report Configuration Parameters
Media Viewer
The Media Viewer7 provides the ability to review details of chat, email and fax conversations. It allows you to go back and review the
“conversations” that occur for specific call media. Contact Centers and their Customers can feel confident knowing that their communications are being dealt with and can be tracked.
The Media Viewer Preview window allows you to review a specific call and its associated details e.g., a copy of the delivered fax. These can be saved to a disk or printed.
Features
The ability to go back and review the “conversations” that occur for specific call media.
In the case of Fax, both the initial fax image as well as any fax-back images would be captured and presented as the “conversation” all.
Email Queuing stores the communications from the customer and the agent.
In the case of Phone and Web Chat, the conversation is stored as one record for each call, as the conversation is more dynamic. The Media Viewer Calls window lists the calls
(based on search criteria), providing an overview of the call details: the agent who received the call, Caller ID if received and queue name/number that the call was delivered from.
The Media Viewer Preview window allows you to review a specific call and its associated details
Emails archived to the data server, or internal database, can be viewed by the Media Viewer, accessible via the standard Reports application.
Under each record, any subsequent “conversation” records are shown.
Conversations can be saved or printed from the File Menu or toolbar
Filter controls to limit the conversations shown
Benefits
Managers can confidently track any email on record, allowing them to follow up on any anomalies or issues under discussion. Archiving provides security for the customer
and the contact center that all communications are being dealt with. The effect of archiving is similar to that of
conversation monitoring or recording, which are both credited with maintaining a high standard of effort and performance from contact center staff, who are aware of the possibility of a conversation being opened, and read by management.
All details of a specific call can be viewed e.g. a copy of the fax
Media Viewer Example
A wizard allows you to define the report parameters
You can save the report topics or topics and replies to a file
Once the report has been generated, you can limit the view by date, contact, agent or media
Detail lines show call information such as the agent who received the call, date received, queue it was delivered from, CLI if available or email address
Figure 15. Media Viewer
Select a contact detail line to view more information
The preview pane shows the details of the contact. In this example the agent‟s reply
Figure 16. The Media Viewer Preview window
Launching the Media Viewer
If a user is logged in to Reports they can launch the Media Viewer from the Reports Tools menu. In addition users can have the Media Viewer shortcut on their PC Desktop. Clicking on the shortcut will activate the login screen. Using their personal login maintains security. The user name and password, and security privilege for Reports (set in the Administrator application) control login rights to Media Viewer.
Parameters
Absolute start and end dates
Specific start and end times of each day within the date range selected
Which clients are to be included in the report Which agents are to reported on
Which media type you wish to report on (Email, Chat, Fax)
Level of detail Calls Window
This window displays a list of all
conversations that match the parameters entered in the Wizard or Setup dialog
Details include the following columns: Type (icon): Shows whether the call is a
Chat, Email or Fax
Date: the date of the first call in the conversation
Time: the time of the first call in the conversation
Agent: The agent who took the calls Count: the number of items in the
conversation
Caller: the phone number, email address, or Chat identifier of the external party Queue: the queue that the calls were
delivered through Preview Window
All parts of the conversation are listed
separately (e.g. initial delivery to agent, agent reply)
Double-click a conversation to view details in the Message window.
System Reports
System Reports8 are run to document the current system configuration and settings of the contact center. Administrators can analyze this data to fine-tune system configurations, identify any users that may require assistance or export the data for use in other applications.
Features
Reports are generated based on the Administrator data
Most system reports are available in .csv format
Announce reports provide information on announcement port traffic and what types of calls and how the ports are being utilized Track changes made to the system
configuration
Benefits
The ability to save in .csv format allows Administrator to export the report for use in other applications
Most reports do not require parameters to be entered
Administrators can view calls that experienced announcement delays and therefore analyze whether configuration adjustments need to be made for certain parts of the day or whether there is a need for additional ports in the system
Identify who made changes to the system configuration and when those changes were made
Agent Setup
The Agent Setup Report documents the current Agent configuration
Voice Port Exception
Run this report to view all calls that experienced a delay in their announcement. It is generated based on call data, not on system data saved in Administrator.
Voice Port Usage
Run this report to view a breakdown of how the Announce ports are being used. This provides a detailed record of all announcements that have played and the types of calls and actions that the announcements were related to
Audit Trail
This report enables the user to track all changes to the current system configuration. Changes are made to objects within the application and the report identifies the type of change made Auto Attendant Setup
Run this report to document your current Auto Attendant configuration
Call Tracking
The Call Tracking report displays the history of each call for the Queues and Agents selected over the period selected. Consultations and transfers related to the call are displayed in the same group. This report is intended to track calls from outside the system.
System Agent Login Class Setup
Run this report to document how your Agent Login Classes have been set up, who is assigned to each class and the parameters assigned (e.g. Auto Logout action for the class).
Customer Query Setup
Run this report to document your current Customer Query configuration and entries, Delivery Pattern Setup
Run this report to document your current pattern configuration
Line Setup
The Line Setup Report documents your current line configuration. This report describes all available lines; phone lines, email lines, and other lines
System Break/Worktime Reasons Setup Run this report to document all the Break and Worktime Reasons configured in the system. Phonebook Setup
Run this report to document your current Phonebook configuration and entries Progress Setup
Run this report to document your current Progress announcement configuration and entries
Query Database Setup
Run this report to document your current Query Database configuration
Queue Setup
The Queue Setup Report documents your current Queue configuration
Site Notes
The Site Notes report shows all of the information text associated with setup items (entered by clicking the "i" icon at lower left of the edit window for the item in Administrator.) Some examples of Items with information text are announcements, queues, patterns, and classes
Wrapup Setup
Run this report to document your current Wrapup Template and/or code configuration
Presence Reports
Two Presence Reports are available for all enterprise users, regardless of whether they are part of the contact center, depending on their permissions:
1. Presence 2. Call History
Presence reports provide… Management of self and staff
Access to all reports and users is controlled by security settings so people can be restricted to viewing their own records, or managers may wish to monitor staff
Report on…
Selected Users and/or Departments Specified dates and times of day Call activity – how many calls were
received/made over a period, of what type: inbound, outbound etc
Presence Profiles – how much time was spent in meetings, away from your desk Absenteeism – how many days you‟re
Figure 18. Call History Presence Report by Department
Personal Reports
Personal reports9 reduce repetitive interaction and ensure reports are always available on time when they are due. Customized reports can be created for a particular scenario or analysis and allow supervisors or managers to re-use a set of parameters whenever they wish, without re-specifying them each time the report needs to be run. These reports can also be scheduled to run automatically – a significant time saving factor for both Managers and their Supervisors.
For example, configure performance reports to be run weekly, for each queue or queues report group that is of interest, with the appropriate parameters set. By specifying a relative date (e.g., from the beginning of “last week” to the end of “last week”), no parameters need to be altered in order to run the same report on a regular basis.
Features
Right-click pop up menus enables straight forward selection when adding a new report Wizards and On-Line Help
Configure and save reports using absolute, relative or custom date formats
Report names can be customized
Reports can be created for any media type Modify report parameters at any time Schedule Personal Reports to run every day, week, or month
Benefits
The use of relative or custom dates means no parameters need to be altered in order to run the same report regularly
Wizards offer effortless selection of parameters for your report profile
The ability to customize the name of a report means you can select the right report at a glance, already knowing the parameters that will be selected e.g. “Support Agent
Performance for last week”
Scheduling your personal reports reduces repetitive interaction and means reports are always available on time. They can be saved in a preset location, printed or emailed automatically
Example – Adding a new Personal Report Personal Reports already configured and available
Pop up menus which enable simple selection of new Report Profile
All reports the logged in user can access can be customized and saved as a Personal Report
Example – Using the wizard to customize
a Personal Report
Choose a name for your Personal Report Select Relative, and drop down the list to choose a day or other period relative to today. This enables the user to easily run this report on demand without the need to specify particular date parameters each time.
Choose parameters for your Personal Report