SINCLAIR COMMUNITY COLLEGE Dayton, Ohio
FINANCIAL STATEMENTS June 30, 2010 and 2009
Board of Trustees
Sinclair Community College
444 West Third Street
Dayton, Ohio 45402 - 1460
We have reviewed the
Independent Auditor’s Report
of the Sinclair Community College,
Montgomery County, prepared by Crowe Horwath LLP, for the audit period July 1, 2009
through June 30, 2010. Based upon this review, we have accepted these reports in lieu of the
audit required by Section 117.11, Revised Code. The Auditor of State did not audit the
accompanying financial statements and, accordingly, we are unable to express, and do not
express an opinion on them.
Our review was made in reference to the applicable sections of legislative criteria, as reflected by
the Ohio Constitution, and the Revised Code, policies, procedures and guidelines of the Auditor
of State, regulations and grant requirements. The Sinclair Community College is responsible for
compliance with these laws and regulations.
Dave Yost
Auditor of State
SINCLAIR COMMUNITY COLLEGE Dayton, Ohio
FINANCIAL STATEMENTS June 30, 2010 and 2009
CONTENTS
REPORT OF INDEPENDENT AUDITORS ... 1
MANAGEMENTS DISCUSSION AND ANALYSIS ... 3
FINANCIAL STATEMENTS STATEMENTS OF NET ASSETS ... 12
STATEMENTS OF FINANCIAL POSITION ... 13
STATEMENTS OF REVENUES, EXPENSES AND CHANGES IN NET ASSETS ... 14
STATEMENTS OF ACTIVITIES AND CHANGES IN NET ASSETS ... 16
STATEMENTS OF CASH FLOWS ... 17
NOTES TO FINANCIAL STATEMENTS ... 19
SUPPLEMENTARY INFORMATION SCHEDULE OF EXPENDITURES OF FEDERAL AWARDS ... 31
NOTES TO THE SCHEDULE OF EXPENDITURES OF FEDERAL AWARDS ... 34
REPORT OF INDEPENDENT AUDITORS ON COMPLIANCE AND ON INTERNAL CONTROL OVER FINANCIAL REPORTING BASED ON AN AUDIT OF FINANCIAL STATEMENTS PERFORMED IN ACCORDANCE WITH GOVERNMENT AUDITING STANDARDS ... 35
REPORT OF INDEPENDENT AUDITORS ON COMPLIANCE WITH THE REQUIREMENTS THAT COULD HAVE A DIRECT AND MATERIAL EFFECT ON EACH MAJOR PROGRAM AND ON INTERNAL CONTROL OVER COMPLIANCE IN ACCORDANCE WITH OMB CIRCULAR A-133 ... 37
Crowe Horwath LLP
Independent Member Crowe Horwath International
(Continued)
REPORT OF INDEPENDENT AUDITORS
The President and Board of Trustees Sinclair Community College and Mary Taylor, Auditor of State
We have audited the accompanying financial statements of the business-type activities of Sinclair Community College (the “College”) as of and for the years ended June 30, 2010 and 2009. We have audited the discretely presented component unit as of for the year ended December 31, 2009 which combined with the College financial statements collectively comprise the College’s basic financial statements as listed in the table of contents. These financial statements are the responsibility of the College’s management. Our responsibility is to express opinions on these financial statements based on our audits. We did not audit the financial statements of the Sinclair Community College Foundation (“Foundation”), the component unit, for the year ended December 31, 2008. Those financial statements were audited by other auditors whose reports thereon have been furnished to us, and our opinion, insofar as it relates to the amounts included for the Foundation for the year ended December 31, 2008, is based solely on the reports of the other auditors. We conducted our audits in accordance with auditing standards generally accepted in the United States of America and the standards applicable to financial audits contained in Government Auditing Standards, issued by the Comptroller of the United States. Those standards require that we plan and perform the audit to obtain reasonable assurance about whether the financial statements are free of material misstatement. An audit includes examining, on a test basis, evidence supporting the amounts and disclosures in the financial statements. An audit also includes assessing the accounting principles used and significant estimates made by management, as well as evaluating the overall financial statement presentation. We believe that our audits and the report of the other auditors provide a reasonable basis for our opinions.
In our opinion, based on our audits and the report of the other auditors, the financial statements referred to above present fairly, in all material respects, the respective financial position of the business-type activities and discretely presented component unit of Sinclair Community College as of June 30, 2010 and 2009 (December 31, 2009 and 2008 for the Foundation) and the respective changes in net assets and cash flows thereof for the years then ended, in conformity with accounting principles generally accepted in the United States of America.
In accordance with Government Auditing Standards, we have also issued a report dated November 3, 2010, on our consideration of the College’s internal control over financial reporting and our tests of its compliance with certain provisions of laws, regulations, contracts and grant agreements and other matters. The purpose of that report is to describe the scope of our testing of internal control over financial reporting, compliance and the results of that testing, and not to provide an opinion on the internal control over financial reporting or on compliance. That report is an integral part of an audit performed in accordance with Government Auditing Standards and should be considered in assessing results of our audit.
Our audit was performed for the purpose of forming an opinion on the basic financial statements of Sinclair Community College taken as a whole. The accompanying Schedule of Expenditures of Federal Awards, which is required by U.S. Office of Management and Budget Circular A-133, Audits of States, Local Governments and Non-Profit Organizations, is presented for the purpose of additional analysis and is not a required part of the 2010 basic financial statements. Such additional information has been subjected to the auditing procedures applied in our audit of the 2010 basic financial statements and, in our opinion, is fairly stated, in all material respects, in relation to the basic financial statements taken as a whole.
The Management’s Discussion and Analysis (“MD&A”) on pages 3 through 11 is not a required part of the financial statements but is supplementary information required by the Governmental Accounting Standards Board. We have applied certain limited procedures, which consisted principally of inquiries of management regarding the methods of measurement and presentation of the required supplementary information. However, we did not audit the information and express no opinion on it.
Crowe Horwath LLP Columbus, Ohio
(Continued)
MANAGEMENT’S DISCUSSION AND ANALYSIS
This discussion and analysis (MD&A) of Sinclair Community College’s (the “College’s”) financial performance provides an overview of the College’s financial activities for the fiscal years ended June 30, 2010 and 2009. Please read it in conjunction with the College’s financial statements, which begin on page 12.
Financial and Institutional Highlights
Sinclair Community College achieved record breaking results in fiscal year 2010 in many indicators of operations. The College’s initiatives to reach more students with cost effective educational programs as well as the general economic conditions resulted in an all-time high demand for programs and services as credit-based headcount enrollment exceeded 25,000 students. Overall, full-time equivalent (“FTE”) enrollments were 15% higher than fiscal year 2009. Over the past two years, FTE enrollments have grown by 28%.
The College’s financial health remained strong due to the aforementioned enrollment growth and prudent planning and management of resources. In particular, the Board of Trustees and College administration have devoted significant attention to financial planning over the past several years in response to reduced levels of state funding coupled with the substantial and growing demand for the College’s programs and services.
All of the College’s campuses and learning centers, as well as the online sector, realized enrollment growth from 2009 to 2010. The Courseview Campus Center, in its third year of operations, realized a 47% increase in enrollment over the period while the Huber Heights and Englewood Learning Centers experienced a 22% increase in demand. In the fall term of fiscal 2010, the College opened its Preble County Learning Center; this site exceeded its first year enrollment target by more than 100%.
The College continued to demonstrate an exceptional level of commitment to teaching and learning in 2010. In comparison to non-instructional expenses such as facility costs, Sinclair devotes a significantly higher percentage of its resources to instruction and academic support functions than the average of Ohio’s other public two year colleges.
In fiscal 2010 Sinclair reported $9.0 million in cost efficiency improvements to the Ohio Board of Regents. This amount exceeded the College’s prescribed State required target and helped offset the fact that state appropriations have not kept pace with enrollment growth.
Financial Management Philosophy and Accountability
Sinclair utilizes a forward thinking and systematic approach to managing financial resources that is guided by the following principles:
Use money as a tool: Money is a tool used in fulfilling our service mission
Employ results oriented spending: This is generally tied to an expectation of clear mission results
Focus on long-term stability: Use financial modeling and planning to help ensure the long-term sustainability and financial viability of the College
Pay as you go: Save money upfront, place in allocated reserves, for later use in major capital expenditures (as opposed to borrowing now and paying later)
Save with a plan and purpose: Maintain allocated reserves to provide flexibility in managing future opportunities and challenges
Plan for margin: Budget for a 3% to 5% positive margin on the annual operating budget (revenue to exceed expenses) to provide funding for facility maintenance capital and other needs
Inputs into the financial management and measurement process come from a variety of sources as shown in the diagram below:
The State of Ohio computes a fiscal accountability measure each year for all public higher education institutions. For the latest year reported (FY 2009), Sinclair received the highest score possible, a composite score of 5.0. Sinclair has achieved an average score of 4.5 for the past ten years, above the average of other community colleges and universities.
Overview of the Financial Statements
This annual report consists of three main parts – the MD&A (this section), the financial statements, and a section containing reports on the audit of federal grants and contracts received by the College.
The financial statements are presented in the format required by generally accepted accounting principles and accepted by the Ohio Board of Regents and the Ohio Department of Budget and Management for all state-assisted two- and four-year colleges and universities in Ohio. The statements are:
Statements of Net Assets
Statements of Revenues, Expenses and Changes in Net Assets Statements of Cash Flows
The statements are prepared on an accrual basis and present all assets and liabilities of the College, both financial and capital, and short and long term. They also present all revenues and expenses of the College during the year, regardless of when cash was received or paid.
Collectively, the statements provide a complete picture of the College’s financial condition as of June 30, 2010 and 2009 and the results of its operations for the fiscal years then ended.
(Continued)
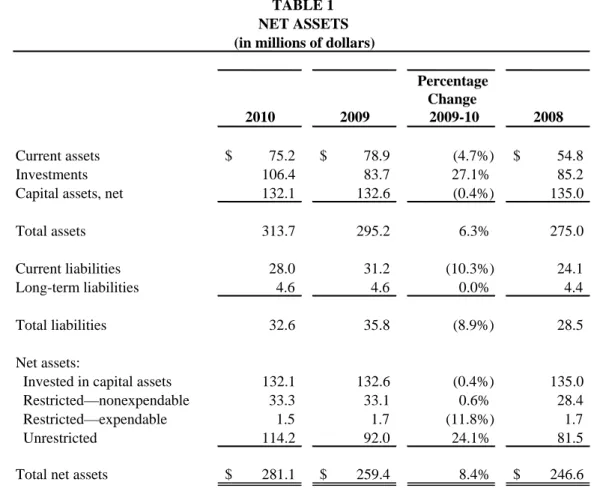
Net Assets
The College’s total net assets are divided into three categories: 1) capital assets, 2) externally restricted net assets, and 3) unrestricted net assets. In the discussion that follows, it will be helpful to keep in mind that two major types of transactions do not change the value of total net assets. These are:
A transfer of net assets from one net asset category to another.
Capital asset acquisitions, for which payment reduces either unrestricted or restricted net assets, while increasing capital assets by the same amount.
A discussion of the underlying factors impacting the change in net assets is provided below and in the overview of the next section titled “Statements of Revenues, Expenses and Changes in Net Assets.” Fiscal 2010
At June 30, 2010, net assets were $281.1 million. Liabilities of $32.6 million were only 10.4% of total assets, primarily due to the fact that the College has purposely avoided long-term debt by strategically using various funding sources, including state capital appropriations, to manage growth and maintain a low level of deferred infrastructure maintenance.
Total net assets increased by $21.7 million (from $259.4 million to $281.1 million) in fiscal 2010. The increase had these components:
Net increase of $17.6 million after depreciation expense of $7.9 million, but exclusive of the change in fair value of investments;
An increase in the fair value of investments of $4.1 million.
Also in fiscal 2010, capital asset acquisitions consumed approximately $7.4 million of unrestricted and restricted net assets and added a corresponding amount to capital assets.
Fiscal 2009
At June 30, 2009 net assets were $259.4 million. Liabilities of $35.8 million were only about 12% of total assets.
Total net assets increased by $12.8 million (from $246.6 million to $259.4 million) in fiscal 2009. The increase had these components:
Net increase of $10.0 million after depreciation expense of $7.6 million, but exclusive of the change in fair value of investments;
An increase in the fair value of investments of $2.8 million.
Also in fiscal 2009, capital asset acquisitions consumed approximately $5.2 million of unrestricted and restricted net assets and added a corresponding amount to capital assets.
Statements of Revenues, Expenses and Changes in Net Assets
Overview
The Statement of Revenues, Expenses and Changes in Net Assets (SRECNA) presented in Table 2 below presents the results of operations for the College for the fiscal years 2008 through 2010. In fiscal years 2009 and 2010, total net assets for the College increased by $12.8 million and $21.7 million, respectively. These results have been driven by the following:
Operating revenue, comprised of tuition and fees, auxiliary operations and federal and state grants, increased by 4.4% from 2009 to 2010 due in part to a 15% increase in enrollments. This continued the trend from 2008 to 2009 wherein operating revenues and enrollments grew by 8.2% and 11%, respectively.
Careful management and economies of scale limited operating expenditure increases to 5.0% from 2009 to 2010, compared to enrollment growth of 15%. On a per student basis, operating expenses declined by 8.9%. From 2008 to 2009, operating expenses grew 8.0% in relation to an enrollment increase of 11%.
Nonoperating and other revenues increased by $14.5 million from 2009 to 2010, as a result of the following:
1. State related appropriations (i.e., state appropriations, state student aid grant programs and state capital grants) were down $4.7 million due to reductions in operating subsidy and the elimination of state student aid programs, partially offset by an increase in capital grants. As noted above, the decline in operating subsidy coincided with a 15% increase in enrollments.
2010 2009
Percentage Change
2009-10 2008
Current assets $ 75.2 $ 78.9 (4.7%) $ 54.8
Investments 106.4 83.7 27.1% 85.2
Capital assets, net 132.1 132.6 (0.4%) 135.0
Total assets 313.7 295.2 6.3% 275.0
Current liabilities 28.0 31.2 (10.3%) 24.1
Long-term liabilities 4.6 4.6 0.0% 4.4
Total liabilities 32.6 35.8 (8.9%) 28.5
Net assets:
Invested in capital assets 132.1 132.6 (0.4%) 135.0
Restricted—nonexpendable 33.3 33.1 0.6% 28.4
Restricted—expendable 1.5 1.7 (11.8%) 1.7
Unrestricted 114.2 92.0 24.1% 81.5
Total net assets $ 281.1 $ 259.4 8.4% $ 246.6
TABLE 1 NET ASSETS (in millions of dollars)
(Continued)
2. County levy revenue grew by $1.4 million or 4.3% as a result of receipts from the 3.2 mill levy and temporary payments related to the phase-out of business personal property taxes and the impact of utility deregulation
3. Federal student aid and grant programs grew by 79.2%, or $16.4 million, since 2009. This more than offset the virtual elimination of state funding for similar programs. The reasons for this substantial increase are described below.
4. Finally, the $4.1 million increase in the fair value of investments was $1.3 million higher than the $2.8 million increase in 2009.
Nonoperating and other revenues increased by $13.9 million from 2008 to 2009. This increase resulted from increases in state appropriations (including capital grants), county levy and federal and state student aid grants.
As discussed in the overview, the following paragraphs explain elements of the SRECNA and the issues affecting the results contained therein.
Revenues (Operating, Nonoperating and Other)
Student tuition and fee revenue grew by 6.6% from 2009 to 2010 primarily as a result of enrollment volume. In accordance with the required reporting display, gross tuition and fees on the SRECNA are reduced by grants and scholarships used to help pay those fees, resulting in a net revenue amount. This result expands upon the improvement realized from 2008 to 2009 derived from enrollment growth ($0.9 million or 3.8%).
State appropriations for operations declined by 1.4% from 2009 to 2010, despite the aforementioned enrollment increase. State funding per FTE in fiscal 2010 was 22% lower than 2001 in nominal terms; on an inflation-adjusted basis it is 37% lower. Of the $48.4 million in state appropriations, $6.9 million came from federal stimulus money earmarked for public higher education.
Although state appropriations for operations increased from 2008 to 2009 by 5.1%, the state funding bill providing these monies mandated a tuition freeze for 2009.
County levy revenue grew by 4.3% in 2010, the second full fiscal year of impact for the 3.2 mill replacement levy passed in March of 2008. The prior year’s robust growth (15.5%) was attributable to 2009 being the first full fiscal year for which the increased millage of the aforementioned levy was realized. A portion of levy funds are set aside in a tuition stabilization fund in the early years of the levy’s ten-year life cycle for use in the later years because the levy does not grow for inflation.
In fiscal 2010, federal student aid increased by 79%, while state student aid decreased by 98%. The decrease in state aid resulted from the State’s elimination of the Ohio Instructional Grant program, and changes in the Ohio College Opportunity Grant program that effectively rendered two-year college students ineligible for the aid. The increase in federal aid resulted from 1) a large increase in the number of students receiving Pell grants over fiscal year 2009, driven by various factors including the College’s enrollment increases and the loss of state student aid; and 2) increases in the maximum Pell grant award amounts for both full and part time students. Similarly, in fiscal 2009, the College experienced significant growth in federal and state student aid relative to 2008 as a function of enrollment increases, an increase in the number of students receiving Pell grants, and an increase in the maximum Pell grant award amount.
Nonoperating revenues in 2010 also include an increase in the fair value of investments of $4.1 million. In 2009, the fair value of investments increased $2.8 million, while it increased $1.7 million in 2008. These increases reflect the decline over the three fiscal years in bond market interest rates. All of the bonds in the College’s portfolio have higher stated interest rates than the rates currently available on new bonds of the same type; therefore, the bonds the College is holding would trade at premium prices. The College has a practice of holding its investments to maturity; therefore, unrealized gains and losses are not expected to be realized.
Operating Expenses
Total operating expenses grew by 5.0% ($7.7 million) from 2009 to 2010, a rate of about one third the growth in enrollment (15%). This yielded a decrease in operating expenses per full-time equivalent (FTE) student of 8.9%. Fully 60% of the net increased spending fell in the Instruction and Student Services categories as the College ramped up its credit hour production and related services. Student aid expenses grew by 24% as a function of enrollment volume and recent increases in the maximum Pell award amount. Likewise, auxiliary enterprises’ expenses grew by 19% in light of the aforementioned enrollment growth that created record levels of demand for books and related items as well as parking and dining services. Spending was restrained in the remaining categories as the College realized economies of scale and implemented cost saving measures.
From 2008 to 2009 total expenses grew by 8.0% relative to enrollment growth of 11%, producing a reduction of 2.5% in operating expenses on a per student basis. Auxiliary enterprises’ expenses grew by almost 14% as the result of robust enrollment growth creating record levels of demand for books and related items as well as parking and dining services. The increase in the institutional support category was attributable to information technology systems and software lifecycle replacements, including an upgrade of the College’s telephone system. All categories exclusive of the items noted above increased by only 4.3%.
(Continued)
2010 2009
Percentage Change
2009-2010 2008
Operating revenues:
Student tuition and fees, net of grants and scholarships $ 25.9 $ 24.3 6.6% 23.4$
Federal grants and contracts 6.0 5.5 9.1% 4.5
State and local grants and contracts 2.5 3.1 (19.4%) 2.9
Nongovernmental grants and contracts 3.2 3.2 0.0% 2.5
Sales and services of educational departments 1.0 1.2 (16.7%) 1.2
Auxiliary enterprises, net of grants and scholarships 9.3 9.1 2.2% 8.4
Other 1.7 1.1 54.5% 1.0
Total operating revenues 49.6 47.5 4.4% 43.9
Operating expenses:
Instruction 68.5 64.7 5.9% 61.7
Public service 3.4 4.6 (26.1%) 4.5
Academic support 11.2 10.9 2.8% 9.9
Student services 14.6 13.9 5.0% 13.4
Institutional support 15.9 16.2 (1.9%) 14.6
Plant operations and maintenance 13.0 13.8 (5.8%) 13.5
Depreciation 7.9 7.6 3.9% 7.8
Student aid 13.9 11.2 24.1% 7.5
Auxiliary enterprises 13.8 11.6 19.0% 10.2
Total operating expenses 162.2 154.5 5.0% 143.1
Nonoperating and other revenues:
State appropriations 48.4 49.1 (1.4%) 46.7
County tax levy receipts 34.2 32.8 4.3% 28.4
Federal student aid grant programs 37.1 20.7 79.2% 15.0
State student aid grant programs 0.1 5.8 (98.3%) 4.4
Investment income 4.5 4.5 2.2% 5.0
Net increase in the fair value of investments 4.1 2.8 46.4% 1.7
State capital grants 5.8 4.1 41.5% 4.7
Total nonoperating and other revenues 134.2 119.8 12.1% 105.9
Increase in net assets $ 21.6 $ 12.8 69.5% $ 6.7
TABLE 2
REVENUES, EXPENSES AND CHANGES IN NET ASSETS (in millions of dollars)
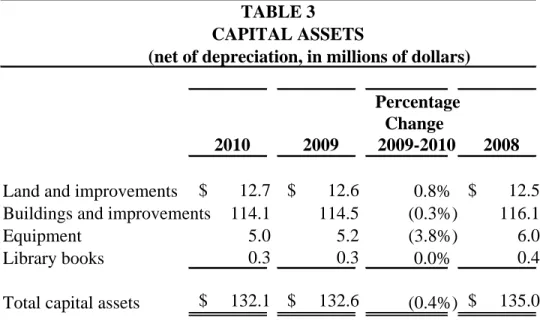
Capital Assets
Highlights of the College’s capital program include the following:
Building improvement projects in fiscal year 2010 included several projects undertaken in order to increase classroom capacity at the downtown Dayton campus. Building improvement projects in fiscal 2009 included fire door modifications on the main campus, and the construction of a remote computer disaster recovery facility at the College’s Courseview Campus Center in Mason.
At the Dayton campus, major facility life cycle maintenance projects in fiscal 2010 included air handler replacements, and in 2009 included laboratory renovations. In both fiscal years, other major life cycle projects included roof replacements, carpet replacement, and parking garage waterproofing membrane and expansion joint repairs.
New additions to equipment inventory in fiscal years 2010 and 2009 included administrative computer system upgrades at the College’s Dayton campus. Significant technology upgrades in the Ponitz Conference Center (the College’s corporate training facility) also occurred during fiscal year 2010. And in both fiscal years, the College incurred expenses related to the preparation of classroom and office space in the new Preble County Learning Center, which began offering classes in the fall of 2009.
2010 2009
Percentage
Change
2009-2010
2008
Land and improvements
$ 12.7 $ 12.6
0.8% $ 12.5
Buildings and improvements
114.1 114.5
(0.3%) 116.1
Equipment
5.0 5.2
(3.8%) 6.0
Library books
0.3 0.3
0.0% 0.4
Total capital assets
$ 132.1 $ 132.6
(0.4%) $ 135.0
TABLE 3
CAPITAL ASSETS
Factors Impacting Future Periods
State of Ohio Appropriations: While higher education has been viewed as a statewide priority, reductions in state resources have caused state appropriations to not keep pace with enrollment growth, and thus decline as a share of the College’s funding. As widely reported in the news, the State of Ohio has a structural budgetary imbalance primarily due to the impact of the economic downturn on employment and tax revenues. The current two-year state operating budget ($50 billion) is balanced with federal stimulus and other one-time money, equaling about 15% of total resources (Sinclair’s share is roughly $7 - $8 million annually). There is uncertainty regarding the prospects for state funding in the next two-year state budget commencing July 1, 2011. Sinclair has been prudent and proactive in planning for contingencies should there be an eventual reduction in state funding. The College will continue to carefully manage the impact of enrollment growth and associated costs while seeking to generate additional operating efficiencies. In addition, funds have been set aside in a “rainy day fund” to buffer the potential impact of a reduction in state funding.
Tuition and Fees: As state funding has declined as a share of revenue, the College has had to enact modest increases in tuition and fees. Even so, the tuition for Montgomery County residents remains the lowest in the state by a wide margin. Sinclair will evaluate the need for further tuition and fee actions, including the phased implementation of a technology and student success services fee that was approved by the Chancellor of the Board of Regents and the Ohio Legislative Controlling Board. Student Enrollments: Sinclair’s FTE enrollments have grown another 5% for the summer and fall quarters of FY 2011. The College is continually adjusting service levels and space utilization so that this growing need can be met. In addition, options are being considered for expanding capacity at the Courseview Campus, where enrollments have increased fourfold since first opening in the fall of 2007. The College is also mindful that an economic improvement would likely cause enrollments to decline somewhat versus the extraordinary levels of growth that have been experienced over the past three years.
Montgomery County Levy: The levy is used entirely for expenditures benefiting students who reside in Montgomery County in the form of tuition subsidy and support for services at the Dayton campus. While this revenue stream has flowed to the College relatively reliably and predictably over time, the recent economic downturn raises the concern of possible reductions in levy revenues due to declines in property valuation and tax collection rates.
Conversion to Semesters: The University System of Ohio strategic plan calls for the state’s publicly supported colleges and universities to follow a common, semester-based academic calendar. Sinclair plans to implement a semester calendar effective fall quarter 2012. The conversion process has been underway for over a year and entails the review and revision of all courses and related business processes. There are one-time implementation costs being incurred and provided for from a special set aside fund.
SINCLAIR COMMUNITY COLLEGE STATEMENT OF NET ASSETS
June 30, 2010 and 2009
2010 2009
ASSETS
CURRENT ASSETS
Cash and cash equivalents $ 14,129,966 $ 24,536,037
Accounts receivable, net 24,755,660 19,009,152
Prepaid expenses 1,082,315 718,781
Interest receivable 414,616 365,811
Property tax levy receivable 33,289,034 33,072,032
Inventories 1,569,923 1,157,144
Total current assets 75,241,514 78,858,957
NONCURRENT ASSETS
Investments 106,438,855 83,743,624
Capital assets, net 132,062,664 132,599,153
Total noncurrent assets 238,501,519 216,342,777
Total assets $ 313,743,033 $ 295,201,734
LIABILITIES AND NET ASSETS
CURRENT LIABILITIES
Accounts payable and accruals $ 4,224,808 $ 10,471,334
Accrued salaries, wages and benefits 11,283,020 10,692,460
Deferred student fee income 11,056,500 8,737,588
Deposits 1,469,168 1,273,816
Total current liabilities 28,033,496 31,175,198
NONCURRENT LIABILITIES
Accrued salaries, wages and benefits 4,636,373 4,579,991
Total liabilities 32,669,869 35,755,189
NET ASSETS
Invested in capital assets 132,062,664 132,599,153
Restricted
Expendable 1,489,720 1,768,192
Nonexpendable 33,289,034 33,072,032
Unrestricted 114,231,746 92,007,168
Total net assets 281,073,164 259,446,545
SINCLAIR COMMUNITY COLLEGE FOUNDATION STATEMENTS OF FINANCIAL POSITION
December 31, 2009 and 2008
See accompanying notes to financial statements.
2009 2008
ASSETS
Cash and cash equivalents $ 608,624 $ 506,014
Investments
Fixed income security funds 7,688,641 6,627,710
Equity funds 14,786,511 12,858,353
Venture capital funds 444,282 445,882
Total investments 22,919,434 19,931,945
Accounts receivable 11,119 13,441
Pledges receivable, net of allowances of $16,113 and
$22,722 at December 31, 2009 and 2008, respectively 1,004,026 1,327,859
Total assets $ 24,543,203 $ 21,779,259
LIABILITIES AND NET ASSETS
Liabilities Payable to Sinclair Community College $ 499,147 $ 232,127
Other payables 20,000 -
Total liabilities 519,147 232,127
Net assets
Unrestricted 15,013,536 11,922,486
Temporarily restricted 4,033,884 4,798,338
Permanently restricted 4,976,636 4,826,308
Total net assets 24,024,056 21,547,132
SINCLAIR COMMUNITY COLLEGE
STATEMENTS OF REVENUES, EXPENSES AND CHANGES IN NET ASSETS Years ended June 30, 2010 and 2009
2010 2009
REVENUES
Operating revenues:
Student tuition and fees $ 44,949,956 $ 37,713,989
Less grants and scholarships (19,032,907) (13,448,403)
Student tuition and fees net of grants and
scholarships 25,917,049 24,265,586
Federal grants and contracts 6,030,425 5,491,708
State and local grants and contracts 2,449,317 3,044,582
Nongovernmental grants and contracts 3,187,269 3,210,737
Sales and services of educational departments 1,037,920 1,223,739 Auxiliary enterprises
Food service 523,856 487,067
Bookstore (net of grants and scholarships
of $6,555,228 and $4,250,769 in 2010 and 2009,
respectively) 7,685,265 7,713,438
Parking 1,018,430 923,976
Other operating revenues 1,709,205 1,139,090
SINCLAIR COMMUNITY COLLEGE
STATEMENTS OF REVENUES, EXPENSES AND CHANGES IN NET ASSETS Years ended June 30, 2010 and 2009
See accompanying notes to financial statements.
2010 2009
EXPENSES
Operating expenses: Educational and general:
Instruction $ 68,488,041 $ 64,719,155
Public service 3,445,239 4,615,598
Academic support 11,152,695 10,910,504
Student services 14,612,557 13,893,891
Institutional support 15,907,037 16,142,745
Plant operations and maintenance 13,018,225 13,839,013
Depreciation 7,863,730 7,586,753
Student aid 13,912,567 11,168,135
Auxiliary enterprises:
Food service 243,681 292,947
Bookstore 12,539,855 10,413,300
Parking 1,011,818 905,129
Total operating expenses 162,195,445 154,487,170
Operating loss (112,636,709) (106,987,247)
Nonoperating revenues (expenses):
State appropriations 41,414,612 49,089,412
State appropriations – State Fiscal Stabilization Funds 6,922,196 -
County tax levy 34,239,654 32,839,622
Federal student aid grant programs 37,132,052 20,702,666
State student aid grant programs 127,678 5,792,335
Investment income 4,557,163 4,541,437
Net increase in the fair value in investments 4,099,471 2,750,213 Total nonoperating revenues 128,492,826 115,715,685 Income before other revenues, expenses,
gains, or losses 15,856,117 8,728,438
Other revenues – state capital grants 5,770,502 4,128,941
Increase in net assets 21,626,619 12,857,379
Net assets:
Beginning of year 259,446,545 246,589,166
SINCLAIR COMMUNITY COLLEGE FOUNDATION STATEMENTS OF ACTIVITIES AND CHANGES IN NET ASSETS
Years ended December 31, 2009 and 2008
2009 2008
Temporarily Permanently Temporarily Permanently
Unrestricted Restricted Restricted Total Unrestricted Restricted Restricted Total Revenue and support:
Contributions $ 278,571 $ 1,047,912 $ 101,746 $ 1,428,229 $ 273,547 $ 823,381 $ 132,916 $ 1,229,844
Interest/dividends, net of fund expenses of $44,046 in 2009
and $43,470 in 2008 (27,611) (4,182) (379) (32,172) (6,647) (1,163) - (7,810)
Net realized/unrealized gains
(losses) on investments 3,568,225 545,344 48,961 4,162,530 (5,832,567) (931,047) - (6,763,614)
Net assets released from
restrictions 2,353,528 (2,353,528) - - 1,541,155 (1,541,155) - -
Total revenue and support 6,172,713 (764,454) 150,328 5,558,587 (4,024,512) (1,649,984) 132,916 (5,541,580)
Expenses:
Scholarships 497,243 - - 497,243 845,889 - - 845,889
Project support 2,400,065 - - 2,400,065 1,633,440 - - 1,633,440
Operating expenses 184,355 - - 184,355 158,410 - - 158,410
Total expenses 3,081,663 - - 3,081,663 2,637,739 - - 2,637,739
Change in net assets 3,091,050 (764,454) 150,328 2,476,924 (6,662,251) (1,649,984) 132,916 (8,179,319)
Net assets, beginning of year 11,922,486 4,798,338 4,826,308 21,547,132 18,584,737 6,448,322 4,693,392 29,726,451
Net assets, end of year $15,013,536 $ 4,033,884 $4,976,636 $24,024,056 $11,922,486 $4,798,338 $4,826,308 $21,547,132
SINCLAIR COMMUNITY COLLEGE STATEMENTS OF CASH FLOWS Years ended June 30, 2010 and 2009
(Continued)
2010 2009 CASH FLOWS FROM OPERATING ACTIVITIES:
Tuition and fees $ 26,155,296 $ 24,005,791
Grants and contracts 10,445,111 10,176,115
Payments to vendors and employees (160,674,165) (142,273,467)
Auxiliary enterprise charges 9,163,747 9,138,070
Sales and services of educational departments 1,279,813 1,289,653
Other receipts 1,850,768 1,659,876
Net cash used in operating activities (111,779,430) (96,003,962) CASH FLOWS FROM NON-CAPITAL
FINANCING ACTIVITIES:
State appropriations 48,336,808 49,089,412
Property tax levy receipts 34,022,653 28,134,044
Direct student loan receipts 37,432,169 27,823,280
Direct student loan disbursements (41,101,321) (27,753,153)
Deposits 195,352 74,112
Federal student aid grant programs 36,705,192 20,712,189
State student aid grant programs 1,426,648 4,508,034
Net cash provided by non-capital financing activities 117,017,501 102,587,918 CASH FLOWS FROM CAPITAL AND RELATED
FINANCING ACTIVITIES:
Capital grants 5,770,502 4,128,941
Purchases of capital assets (7,327,242) (5,147,992)
Net cash used in capital and related financing activities (1,556,740) (1,019,051) CASH FLOWS FROM INVESTING ACTIVITIES:
Proceeds from maturities of investments 17,537,703 13,167,749
Interest on investments 4,537,635 4,632,291
Purchase of investments (36,162,740) (9,028,125)
Net cash provided by (used in) investing activities (14,087,402) 8,771,915 NET INCREASE (DECREASE) IN CASH
AND CASH EQUIVALENTS (10,406,071) 14,336,820
CASH AND CASH EQUIVALENTS
Beginning of year 24,536,037 10,199,217
SINCLAIR COMMUNITY COLLEGE STATEMENTS OF CASH FLOWS Years ended June 30, 2010 and 2009
2010 2009 RECONCILIATION OF OPERATING LOSS TO NET
CASH USED IN OPERATING ACTIVITIES
Operating loss $(112,636,709) $(106,987,247)
Adjustments to reconcile operating loss to net cash used in operating activities:
Depreciation 7,863,730 7,586,753
Changes in net assets:
Accounts receivable (2,949,466) (3,922,977)
Inventory (412,779) (73,891)
Prepaid expenses (363,533) 163,397
Accounts payable (6,246,526) 4,763,379
Accrued salaries, wages and benefits 646,941 (34,346)
Deferred revenue 2,318,912 2,500,970
SINCLAIR COMMUNITY COLLEGE NOTES TO FINANCIAL STATEMENTS
June 30, 2010 and 2009
(Continued)
NOTE A – ORGANIZATION AND SUMMARY OF SIGNIFICANT ACCOUNTING POLICIES
Organization: Sinclair Community College (the “College”), a two-year institution of higher education, began operations as a public community college in 1966. The College is operated by the Warren County Montgomery County Community College District, and is exempt from federal income taxes pursuant to provisions of Section 115 of the Internal Revenue Code. The College offers associate degrees, certificate programs and continuing education in the areas of life and health sciences; science, mathematics and engineering; liberal arts, communication and social sciences; and business and public services.
Accrual Accounting: The accompanying financial statements have been prepared on the full accrual basis of accounting, whereby revenue is recognized in the period earned, or in the case of advances from other governments, when all eligibility requirements are met in accordance with Governmental Accounting Standards Board (“GASB”) Statement No. 33, Accounting and Financial Reporting for Nonexchange Transactions. Expenses are recognized when the related liabilities are incurred.
Financial Statements: The College reports as “business-type activities,” as defined by GASB Statement No. 35. Business-type activities are those that are financed in whole or in part by fees charged to external parties for goods or services.
Pursuant to GASB Statement No. 35, Basic Financial Statements—and Management’s Discussion and Analysis—for Public Colleges and Universities, the College follows GASB guidance as applicable to its business-type activities, and also applies Financial Accounting Standards Board (“FASB”) Statements and Interpretations issued on or before November 30, 1989, provided they do not conflict with or contradict GASB pronouncements. The College has elected not to apply FASB pronouncements issued after the applicable date.
Net Asset Classifications: In accordance with GASB Statement No. 35 guidelines, the College’s resources are classified into the following three net asset categories:
Invested in Capital Assets: Capitalized physical assets, net of accumulated depreciation (see Note C).
Restricted
Nonexpendable: Net assets that are either: 1) subject to externally imposed stipulations that are to be maintained permanently by the College; or 2) representative of taxes levied in the reporting period and recognized as revenue in accordance with GASB Statement No. 33, for which the due date for payment occurs in the subsequent period.
Expendable: Net assets related to grants, contracts and taxes, including taxes levied in the prior reporting period and received in the reporting period, whose use is subject to externally-imposed restrictions including limitations on the use of net assets imposed by enabling legislation.
Unrestricted: Net assets that are not subject to externally-imposed restrictions. Unrestricted net assets may be designated for specific purposes by the Board of Trustees. Substantially all of the College’s unrestricted net assets are designated for future uses or contingences (See Note B). When an expense is incurred for purposes for which both restricted and unrestricted resources are available, it is the College’s policy to apply restricted resources first, then unrestricted resources as needed.
SINCLAIR COMMUNITY COLLEGE NOTES TO FINANCIAL STATEMENTS
June 30, 2010 and 2009
NOTE A – ORGANIZATION AND SUMMARY OF SIGNIFICANT ACCOUNTING POLICIES (Continued) Operating Versus Non-operating Revenues and Expenses: The College defines operating activities as reported on the Statement of Revenues, Expenses, and Changes in Net Assets, as those that generally result from exchange transactions such as payments received for providing goods or services and payments made for goods or services received. All of the College’s expenses are from exchange transactions. Certain significant revenue streams relied on for operations are reported as non-operating revenues as required by GASB Statement No. 35, and GASB’s Implementation Guide. Non-operating revenue includes state appropriations, county property tax levy receipts, certain government grants, investment income, and state capital grants.
Cash and Cash Equivalents: Cash, certificates of deposit, and money market funds, stated at cost, are considered cash and cash equivalents.
Accounts Receivable: Accounts receivable consists of tuition and fee charges to students and auxiliary enterprise services provided to students, faculty and staff. Accounts receivable also include amounts due from the federal government, state and local governments and private sources, in connection with reimbursement of allowable expenditures made pursuant to the College’s grants and contracts. Accounts receivable are recorded net of estimated uncollectible amounts of approximately $481,000 and $244,000 at June 30, 2010 and 2009, respectively. The College determines its allowance by considering a number of factors, including the length of time accounts receivable are past due, previous loss history and the condition of the general economy and the industry as a whole.
Deferred Student Fee Income: Deferred student fee income includes the unearned portion of student tuition and fees for the summer and fall sessions. Deferred student fee income also includes advance payments received from health care providers for their employees’ access to online continuing professional education, and advance payments received from businesses for non credit classes and seminars conducted after June 30.
Capital Assets: Capital assets are recorded at cost, or if acquired by gift, at fair value at the date of the gift. When capital assets are sold or otherwise disposed of, the net carrying value of such assets is removed from the accounts and the Invested in Capital Assets component of Net Assets is adjusted as appropriate. Capital asset additions of equipment and fixtures with a cost in excess of $5,000 and with useful lives of five years or more are capitalized and depreciated on a straight-line basis over the estimated useful lives in the table that follows. Buildings and improvements with a cost in excess of $50,000 are capitalized and depreciated on a straight-line basis over the estimated useful lives as follows:
Buildings and improvements 10-60 years
Equipment and fixtures 5-20 years
Library materials 5 years
Grants and Scholarships: Student tuition and fees and bookstore revenues are presented net of grants and scholarships applied directly to student accounts. Grants and scholarships consist primarily of awards to students from the Federal Pell Grant Program, the Ohio College Opportunity Grant Program, the Ohio Instructional Grant Program and the Sinclair Community College Foundation. Payments made directly to students from grants and scholarships are presented as Student Aid.
SINCLAIR COMMUNITY COLLEGE NOTES TO FINANCIAL STATEMENTS
June 30, 2010 and 2009
(Continued)
NOTE A – ORGANIZATION AND SUMMARY OF SIGNIFICANT ACCOUNTING POLICIES (Continued) Compensated Absences: Administrativeand professional employees earn vacation leave at a rate of 13.33 hours for each month of service up to a maximum of 240 hours. Support staff earns vacation at a rate of 8 hours per month for the first 5 years of service up to a maximum of 240 hours. After 5 years of continuous employment, an additional 8 hours per year (.66 hours per month) are added to the accrual rate each year until the maximum monthly accrual rate of 13.33 hours is reached. Upon termination of employment, an employee is entitled to payment for all accrued vacation hours. The College has accrued a vacation liability for all employees equal to amounts earned.
All College employees earn 10 hours of sick leave for each month of service up to a maximum of 120 hours per year. Unused sick leave accumulates up to a maximum of 1,200 hours. This sick leave will either be absorbed by time off due to illness or injury, or within certain limitations, be paid to the employee upon retirement. The amount paid to an employee upon retirement is limited to one-quarter of the accumulated sick leave up to a maximum payout of 240 hours. The College has accrued a sick leave liability for all employees equal to the maximum payout upon retirement.
Use of Estimates: Thepreparation of financial statements in conformity with accounting principles generally accepted in the United States of America requires management to make estimates and assumptions that affect the reported amounts of assets and liabilities and disclosure of contingent assets and liabilities at the date of the financial statements and the reported amounts of revenue and expenditures during the reporting period. Actual results could differ from those estimates.
Adoption of New Accounting Pronouncements: In fiscal year 2010, the provisions of GASB issued Statement No. 51, Accounting and Financial Reporting for Intangible Assets, GASB issued Statement No.53, Accounting and Financial Reporting for Derivative Instruments, and GASB issued Statement No. 58, Accounting and Financial Reporting for Chapter 9 Bankruptcies became effective.
Statement No. 51 establishes accounting and financial reporting requirements for intangible assets including easements, water rights, timber rights, patents, trademarks, and computer software to reduce inconsistencies. Statement No. 53 addresses the recognition, measurement, and disclosure of information regarding derivative instruments entered into by state and local Governments. Derivative instruments are often complex financial arrangements used by governments to manage specific risks or to make investments. By entering into these arrangements, governments receive and make payments based on market prices without actually entering into the related financial or commodity transactions. Derivative instruments associated with changing financial and commodity prices result in changing cash flows and fair values that can be used as effective risk management or investments tools. Derivative instruments, however, also can expose governments to significant risks and liabilities. Common types of derivative instruments used by governments include interest rate and commodity swaps, interest rate locks, options, forward contracts, and futures contracts. The objective of Statement No. 58 is to provide accounting and financial reporting guidance for governments that have petitioned for protection from creditors by filing for bankruptcy under Chapter 9 of the United States Bankruptcy Code. It requires governments to re-measure liabilities that are adjusted in bankruptcy when the bankruptcy court confirms (that is, approves) a new payment plan. Adopting these statements had no effect on the College’s financial statements.
Recently Issued Accounting Pronouncements: In December 2009, GASB issued Statement No. 57, OPEB Measurements by Agent Employers and Agent Multiple-Employer Plans. The objective of this Statement is to address issues related to the use of the alternative measurement method and the frequency and timing of measurements by employers that participate in agent multiple-employer other postemployment benefit (OBEB) plans (that is, agent employers). The College will be required to implement this statement in fiscal year 2012.
SINCLAIR COMMUNITY COLLEGE NOTES TO FINANCIAL STATEMENTS
June 30, 2010 and 2009
NOTE A – ORGANIZATION AND SUMMARY OF SIGNIFICANT ACCOUNTING POLICIES (Continued) In June 2010, GASB issued Statement No. 59, Financial Instruments Omnibus. The objective of this Statement is to update and improve existing standards regarding financial reporting and disclosure requirements of certain financial instruments and external investment pools for which significant issues have been identified in practice. The College will be required to implement this statement in fiscal year 2011. Management does not expect the above GASB statements to have a material impact on the College’s financial statements and disclosures.
NOTE B – CASH AND INVESTMENTS
In accordance with the State of Ohio’s and the College’s policy, the College is authorized to invest cash in securities of the United States government or of its agencies or instrumentalities, the treasurer of state’s pooled investment program, obligations of this state or any political subdivision of this state, certificates of deposit of any national bank located in this state, written repurchase agreements with any eligible Ohio financial institution that is a member of the federal reserve system or federal home loan bank, money market funds, or bankers acceptances maturing in two hundred seventy days or less which are eligible for purchase by the federal reserve system, as a reserve. The classification of cash and cash equivalents and investments in the financial statements is based on criteria set forth in GASB Statement No. 9. Cash equivalents are defined to include investments with original maturities of three months or less. Consistent with this definition, College funds on deposit in the State Treasurer’s investment pool are classified as cash equivalents in the balance sheet. However, for GASB Statement No. 3 discussion purposes (see below), the funds in the State Treasurer’s investment pool are classified as investments.
Deposits: AtJune 30, 2010, the carrying amount of the College’s deposits in all funds was $10,101,324 (included in cash and cash equivalents in the Statement of Net Assets) and the bank balance was $17,239,899. The difference between carrying amount and bank balance was primarily due to outstanding checks at June 30, 2010. Of the bank balance, $1,000,000 was covered by federal depository insurance or by collateral held by the College’s agent in the College’s name. The remaining balance of $16,239,899 was uninsured. The uninsured deposits are held in accounts collateralized by a pooled collateral account at the Federal Reserve Banks of Cincinnati and New York. Custodial credit risk for deposits is the risk that, in the event of a bank failure, the College’s deposits may not be returned to the College. The College follows the deposit policy for custodial risk in accordance with the Ohio Revised Code.
Investments: Investments are stated at their fair value of $110,467,497 (amortized cost basis of $104,128,153). The College’s investments include $106,438,855 invested in Government National Mortgage Association (“GNMA”) pools and are therefore not subject to the credit risk disclosures of GASB Statement No. 40. The remaining $4,028,642 on deposit in the State Treasurer’s investment pool is valued at the pool’s share, which is the price for which the investment could be sold on June 30, 2010.
GNMA pools are aggregations of home mortgages that carry the full faith and credit guaranty of the U.S. government, the same guaranty provided to U.S. Treasury instruments. The maturities of the College’s GNMA investments, based on the maturity dates of the pools when they were issued as 30 year bonds, are as follows:
Years Amount
1-5 $ 2,841
6-10 477,323
11-20 5,148,097
Greater than 20 100,810,594
SINCLAIR COMMUNITY COLLEGE NOTES TO FINANCIAL STATEMENTS
June 30, 2010 and 2009
(Continued)
NOTE B – CASH AND INVESTMENTS (Continued)
However, a GNMA pool does not mature all at once on its stated maturity date. Rather, a portion of each pool matures every month, and an entire pool will usually mature many years before its maturity date. The following homeowner actions result in the return of principal to the owners of a GNMA pool: 1) making a monthly mortgage payment which includes a principal component, 2) refinancing a mortgage and thereby paying off the old mortgage, 3) selling a home and paying off the mortgage. GNMA principal amounts returned to the College are either reinvested, held as cash or used in operations as is deemed appropriate. For the year ended June 30, 2010 the College’s GNMA investments returned principal as follows:
Years Amount
1-5 $ 835
6-10 101,433
11-20 938,117
Greater than 20 16,497,318
Total (at cost) $ 17,537,703
Interest rate risk is the risk that changes in interest rates will adversely affect the fair value of an investment. The College’s policy for managing its exposure to fair value loss arising from increasing interest rates is to comply with the requirements of the Ohio Revised Code and to insure that the term of the maturity of investments does not exceed the need for the availability of the funds invested. The College has the ability and intent to hold all investment securities until maturity; therefore, it is not anticipated that market gains or losses will be realized.
The College’s cash and investments help support major allocated net assets designated by the Board of Trustees or restricted by outside parties for the following purposes:
Capital improvements, facility renovations, equipment $ 59,431,502 Tuition stabilization, rainy day fund, uninsured losses,
other contingencies and initiatives 28,639,463
Auxiliary enterprises 10,826,355
Restricted grants and contracts 1,489,720
Restricted future proceeds from property tax levy 33,289,034
Board designated endowment 14,813,344
Total allocated net assets $ 148,489,418
SINCLAIR COMMUNITY COLLEGE NOTES TO FINANCIAL STATEMENTS
June 30, 2010 and 2009
NOTE C – CAPITAL ASSETS
Capital assets activity for the years ended June 30, 2010 and 2009 is summarized as follows:
2010 2010
Beginning Ending
Balance Additions Disposals Balance Cost:
Land and improvements $ 12,542,877 $ 115,221 $ $ 12,658,098 Buildings and improvements 224,273,077 5,878,077 230,151,154 Equipment and fixtures 20,517,781 1,255,482 1,088,265 20,684,998 Library materials 4,474,513 79,858 659,958 3,894,413 Total cost 261,808,248 7,328,638 1,748,223 267,388,663
Less accumulated depreciation:
Buildings and improvements 109,736,951 6,303,802 116,040,753 Equipment and fixtures 15,307,508 1,438,350 1,086,868 15,658,990 Library materials 4,164,636 121,578 659,958 3,626,256
Total accumulated
depreciation 129,209,095 7,863,730 1,746,826 135,325,999 Capital assets, net $ 132,599,153 $ (535,092) $ 1,397 $ 132,062,664
2009 2009
Beginning Ending
Balance Additions Disposals Balance Cost:
Land and improvements $ 12,556,574 $ - $ 13,697 $ 12,542,877 Buildings and improvements 220,017,152 4,255,925 - 224,273,077 Equipment and fixtures 20,556,740 819,434 858,393 20,517,781 Library materials 4,562,989 73,632 162,108 4,474,513 Total cost 257,693,455 5,148,991 1,034,198 261,808,248
Less accumulated depreciation:
Buildings and improvements 103,943,280 5,807,368 13,697 109,736,951 Equipment and fixtures 14,531,080 1,633,823 857,395 15,307,508 Library materials 4,181,182 145,562 162,108 4,164,636
Total accumulated
depreciation 122,655,542 7,586,753 1,033,199 129,209,095 Capital assets, net $ 135,037,913 $ (2,437,762) $ 998 $ 132,599,153
SINCLAIR COMMUNITY COLLEGE NOTES TO FINANCIAL STATEMENTS
June 30, 2010 and 2009
(Continued)
NOTE D – LONG-TERM LIABILITIES
Long-term liabilities activity for the years ended June 30, 2010 and 2009 is summarized as follows:
Beginning Ending Current
2010 Balance Additions Reductions Balance Portion Compensated absences $ 4,789,423 $ 340,540 $ (261,668) $ 4,868,295 $ 231,922
Beginning Ending Current
2009 Balance Additions Reductions Balance Portion Compensated absences $ 4,593,378 $ 456,747 $ 260,702 $ 4,789,423 $ 209,432 Long-term liabilities are primarily accumulated sick leave payable to employees upon retirement. See Note A —Compensated Absences for further discussion.
NOTE E – STATE AND COUNTY SUPPORT
The College is an institution of higher education that receives a student-based subsidy from the State of Ohio using a formula devised by the Ohio Board of Regents. In fiscal year 2009-10, total student-based subsidy receipts of $48,336,808 from the State included $6,922,196 of federal stimulus funds provided through the American Recovery and Reinvestment Act. In addition to student subsidies, the State of Ohio provides a portion of the funding for the construction of major plant facilities on the College campus, as well as for the renovation of facilities and the purchase of equipment.
The College also receives support from a Montgomery County, Ohio property tax levy. A successful ballot issue in the March 2008 primary election replaced a 2.5 mill levy (commenced January 1, 1999 and ended December 31, 2007) with a 3.2 mill levy that commenced January 1, 2008 and will end December 31, 2017. By state law, levy receipts must be used solely for the benefit of Montgomery County residents attending the College in the form of student tuition subsidy, student scholarships and instructional facilities, equipment and support services located within Montgomery County. These amounts are classified as restricted, non-expendable net assets until received, and restricted, expendable net assets after receipt until spent for their required purpose.
NOTE F – LEASE OBLIGATIONS
The College leases various buildings, office space and equipment under operating lease agreements. These facilities and equipment are not recorded as assets on the balance sheet. The total rental expense under these agreements was $1,460,421 and $1,499,124 for the years ended June 30, 2010 and 2009, respectively.
Future minimum lease payments for all significant operating leases with initial or remaining terms in excess of one year as of June 30, 2010 are as follows:
Years ending June 30,
2011 $ 1,309,547
2012 1,205,516
2013 1,158,467
2014 1,083,073
2015 1,020,539
2016-2020 3,040,161
SINCLAIR COMMUNITY COLLEGE NOTES TO FINANCIAL STATEMENTS
June 30, 2010 and 2009
NOTE G – RETIREMENT PLANS
The College contributes to the State Teachers Retirement System of Ohio (“STRS”) and the Ohio Public Employees Retirement System (“OPERS”), which are statewide cost-sharing multiple-employer plans. OPERS and STRS provide retirement and disability benefits, annual cost-of-living adjustments, and death benefits to plan members and beneficiaries. Faculty and some administrators are covered by STRS and all other employees are covered by OPERS. The College’s law enforcement officers are members of the OPERS law enforcement division, which provides potentially greater retirement benefits and earlier benefit eligibility than are available for other OPERS members.
Authority to establish and amend benefits is provided by Ohio Revised Code, Chapters 145 and 3307, for OPERS and STRS, respectively. The financial statements and required supplementary statements for OPERS and STRS are made available for public inspection. The reports may be obtained by writing or calling:
OPERS STRS
277 East Town Street 275 East Broad Street Columbus, OH 43215-4642 Columbus, OH 43215-3771
(614) 222-6705 (614) 227-4002
(800) 222-PERS (7377)
OPERS plan members are required to contribute 10% (11.1% for law enforcement officers) of their annual salary, and STRS members contribute 10%. The College is required to contribute 14% (17.63% for law enforcement officers from July 1, 2009 through December 31, 2009 and 17.87% from January 1, 2010 through June 30, 2010) of annual covered payroll for OPERS and STRS, respectively. The contribution requirements of plan members and the College are established and may be amended by state statute.
The College has established the Sinclair Community College Alternative Retirement Plan (the ARP) as required by Chapter 3305 of the Ohio Revised Code. The ARP had an effective date of March 31, 1999. ARPs for public colleges and universities were created in Ohio law to provide employees with an alternative to OPERS and STRS. Key features are:
ARPs consist of insurance carrier annuity contracts that provide retirement and death benefits but no health or disability benefits. The Ohio Department of Insurance has approved nine companies to serve as ARP providers. Eligibility is limited to new hires.
Employees electing the ARP instead of STRS are required to contribute 10% of salary. The College is required to contribute 3.5% to STRS, and the College’s discretionary contribution to the ARP has been set at 10.5%.
Employees electing the ARP instead of OPERS are required to contribute 10% of their salary. The College is required to contribute .77% to OPERS, and the College’s discretionary contribution to the ARP has been set at 13.23%.
SINCLAIR COMMUNITY COLLEGE NOTES TO FINANCIAL STATEMENTS
June 30, 2010 and 2009
(Continued)
NOTE G – RETIREMENT PLANS (Continued)
The College’s contributions to OPERS, STRS and the ARP required and made for the years ended June 30, 2010, 2009 and 2008 were as follows:
Contribution
Year OPERS STRS ARP
2010 $ 4,776,771 $ 6,309,761 $ 369,460
2009 4,566,514 5,862,454 398,447
2008 4,292,280 5,562,832 367,480
OPERS provides postretirement health care coverage to age and service retirees (and their dependents) with 10 or more years of qualifying Ohio service credit while STRS provides these benefits to all retirees with 5 or more years of service credit and the dependents of the STRS retirees with 15 or more years of service credit can obtain health care coverage through STRS at full cost. Health care coverage for disability recipients and primary survivor recipients is also available under OPERS and STRS.
NOTE H – OTHER POSTEMPLOYMENT BENEFITS
A portion of each employer’s contributions is set aside for the funding of postretirement health care. For STRS, this rate for fiscal years 2007-08 and 2008-09 was 1% of covered payroll. For OPERS, this rate from July 1, 2007 through December 31, 2007 was 6% of employer contributions, from January 1, 2008 through March 31, 2009 it was 7% of employer contributions, and from April 1, 2009 through June 30, 2009 it was 5.5% of employer contributions. The Ohio Revised Code provides the statutory authority for public employers to fund postretirement health care through their contributions to OPERS and STRS. Postretirement health care under OPERS is advance-funded on an actuarially determined basis. The number of OPERS active contributing participants was 357,584 at year-end December 31, 2009. The actuarial value of OPERS net assets available for Other Postemployment Benefits (“OPEB”) at December 31, 2008, was $10.7 billion. At December 31, 2008 the actuarially accrued liability and the unfunded actuarially accrued liability were $29.6 billion, and $18.9 billion, respectively. For the years ended June 30, 2010 and 2009, the College’s contribution to OPERS to fund these benefits was approximately $263,000 and $320,000, respectively.
Postretirement health care under STRS is financed on a pay-as-you-go basis. Assets available in the health care reserve fund for STRS amounted to $2.7 billion as of June 30, 2009. Eligible benefit recipients reported for STRS totaled 129,659. For the years ended June 30, 2010 and 2009, the College’s contribution to STRS to fund these benefits was approximately $451,000 and $419,000, respectively.
NOTE I – INSURANCE
The College maintains comprehensive and umbrella insurance coverage with private carriers for real property, building contents, vehicles and liability. Additionally, the College carries Crime & Employee Dishonesty coverage. Vehicle policies include liability coverage for bodily injury and property damage. The College also carries professional coverage for employees and its Board of Trustees. The College retains a consulting firm to perform an annual examination of all insurance policies. There have been no significant reductions in insurance coverage in the current year.
SINCLAIR COMMUNITY COLLEGE NOTES TO FINANCIAL STATEMENTS
June 30, 2010 and 2009
NOTE I – INSURANCE (Continued)
The College is self-insured for certain employee health benefit programs. Funding for these programs is based on actuarial projections provided by the plan administrators. Aggregate and specific stop loss insurance is maintained for benefit payments that exceed the maximum limits outlined in the policy. The claims liability of approximately $1,235,000 reported at June 30, 2010 is based on an estimate provided by an actuary and the requirements of GASB Statement No. 10, Accounting and Financial Reporting for Risk Financing and Related Insurance Issues, which requires that a liability for unpaid claim costs, including estimates of costs relating to incurred but not reported claims, be reported. No incremental claim adjustment expenses are included in the estimate.
Changes in claims activity for the past three fiscal years are as follows:
Balance at Balance
Beginning Current Year Claims at End
of Year Claims Payments of Year
2010 $ 1,276,200 $ 5,963,451 $ 6,004,051 $ 1,235,600
2009 1,199,000 6,656,908 6,579,708 1,276,200
2008 1,088,000 6,299,796 6,188,796 1,199,000
Settled claims have not exceeded commercial coverage in any of the past three years. There has been no significant change in coverage from last year.
NOTE J – CONTINGENCIES
The College receives significant financial assistance from numerous federal, state and local agencies in the form of grants. The disbursement of funds received under these programs generally requires compliance with terms and conditions specified in the grant agreements and is subject to audit by the grantor agencies. Any disallowed claims resulting from such audits could become a liability of the College. As of June 30, 2010, management is not aware of any potential disallowances.
The College is the defendant in certain litigation arising in the ordinary course of business. In the opinion of management and outside legal counsel, the ultimate outcome of such items will not have a material impact on the financial statements of the College.