Monitoring Unix and Windows
Servers
Restricted Rights Legend
The information contained in this document is confidential and subject to change without notice. No part of this document may be reproduced or disclosed to others without the prior permission of eG Innovations Inc. eG Innovations Inc. makes no warranty of any kind with regard to the software and documentation, including, but not limited to, the implied warranties of merchantability and fitness for a particular purpose.
Trademarks
Microsoft Windows, Windows NT, Windows 2003, and Windows 2000 are either registered trademarks or trademarks of Microsoft Corporation in United States and/or other countries.
The names of actual companies and products mentioned herein may be the trademarks of their respective owners.
Copyright
©2014 eG Innovations Inc. All rights reserved.
Table of Contents
INTRODUCTION ... 1
MONITORING UNIX SERVERS ... 5
3.1 Monitoring Linux Servers ... 6
3.1.1 The Operating System Layer... 6
3.1.2 The Network Layer ... 60
3.1.3 The Tcp Layer ... 63
3.1.4 The Udp Layer ... 69
3.1.5 The Application Processes Layer ... 70
3.2 Monitoring Solaris Servers ... 96
3.2.1 The Operating System Layer... 96
3.2.2 The Network Layer ... 112
3.2.3 The Tcp Layer ... 112
3.2.4 The Application Processes Layer ... 113
3.3 Monitoring AIX Servers ... 113
3.3.1 The Operating System Layer... 114
3.3.2 The Network Layer ... 123
3.3.3 The Tcp Layer ... 123
3.3.4 The Application Processes Layer ... 124
3.4 Monitoring HPUX Servers ... 131
3.4.1 The Operating System Layer... 131
3.4.2 The Network Layer ... 135
3.4.3 The Tcp Layer ... 135
3.4.4 The Application Processes Layer ... 136
MONITORING WINDOWS SERVERS ... 137
5.1 The Operating System Layer ... 138
5.1.1 Memory Usage Test ... 138
5.1.2 System Details Test ... 143
5.1.3 Disk Space Test ... 146
5.1.4 Disk Activity Test ... 148
5.1.5 Memory Details Test ... 151
5.1.6 Page Files Test ... 154
5.1.9 DNS Changes Test ... 159
5.1.10 Windows Disk Alignment Test ... 160
5.1.11 Disk Users Quota Test ... 161
5.1.12 Tests Disabled by Default ... 166
5.2 The Network Layer ... 177
5.2.1 Windows Network Traffic Test ... 178
5.3 The Tcp Layer ... 180
5.3.1 TcpTraffic Test ... 180
5.4 The OS Cluster Layer ... 181
5.4.1 Cluster Nodes Test ... 182
5.4.2 Cluster Networks Test ... 184
5.4.3 Cluster Disks Test ... 185
5.4.4 Cluster Services/Applications Test ... 188
5.4.5 Cluster Storage Summary Test ... 196
5.4.6 Cluster Shared Volumes Test ... 199
5.4.7 Cluster Status Test ... 202
5.5 The Application Processes Layer ... 205
5.5.1 Windows Processes Test ... 205
5.6 The Windows Service Layer ... 209
5.6.1 Windows Services Test ... 210
5.6.2 Application Event Log Test ... 215
5.6.3 System Event Log Test ... 225
5.6.4 Security Log Test ... 229
5.6.5 Not Responding Processes Test ... 235
Table of Figures
Figure 2. 1: The Linux monitoring model ... 5
Figure 2.2: Tests that map to the Operating System layer of a Linux server ... 7
Figure 2.3: The top 10 CPU consuming processes ... 18
Figure 2.4: The detailed diagnosis of the Free_memory measure listing the top 10 memory consuming processes ... 19
Figure 2.5: The detailed diagnosis of the Number of semaphore sets measure ... 31
Figure 2.6: Detailed diagnosis of the Running processes measure ... 52
Figure 2.7: The detailed diagnosis of the Runnable processes measure ... 52
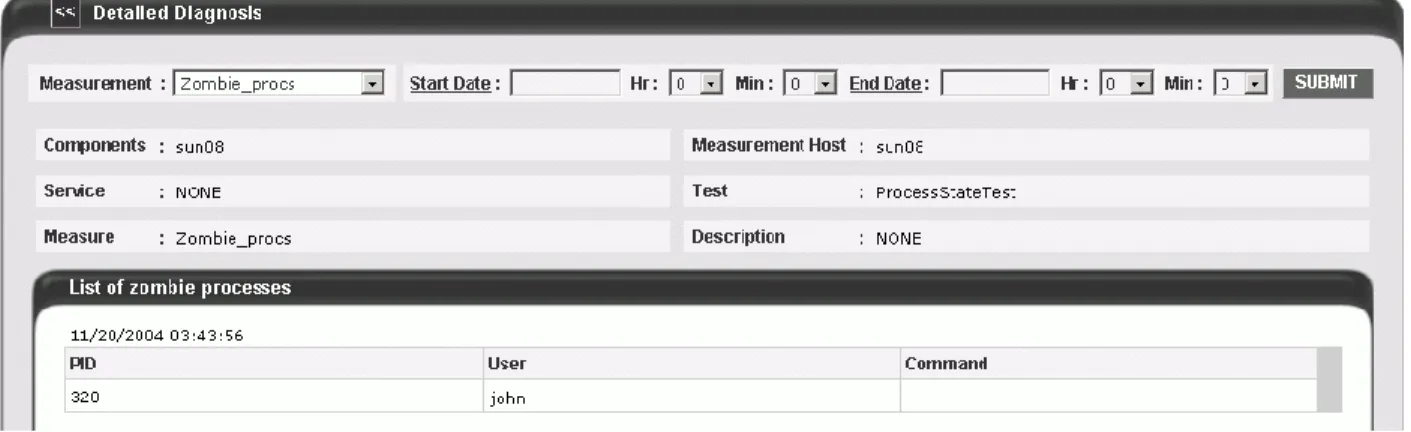
Figure 2.8: The detailed diagnosis of the Zombie processes measure ... 53
Figure 2.9: The detailed diagnosis of the Stopped processes measure ... 53
Figure 2.10: The tests that map to the Network layer of a Linux server ... 60
Figure 2.11: Detailed diagnosis of the Average delay measure listing the hop-by-hop connectivity and delay ... 62
Figure 2.12: The test mapped to the Tcp layer of a Linux server ... 63
Figure 2.13: The detailed diagnosis of the Current Connections measure ... 65
Figure 2.14: Tests mapping to the Udp layer of a Linux server ... 69
Figure 2.15: The Processes test that tracks the health of the Application Processes layer of a Linux server ... 70
Figure 2.16: Configuring the Processes test ... 81
Figure 2.17: Auto-configuring the processes to be monitored ... 81
Figure 2.18: List of auto-discovered processes ... 82
Figure 2.19: The detailed view of processes ... 82
Figure 2.20: Multiple auto-discovered processes configured for monitoring ... 83
Figure 2.21: Tests that map to the Operating System layer of a Solaris server ... 96
Figure 2.22: The tests that map to the Network layer of a Solaris server ... 112
Figure 2.23: The test mapped to the Tcp layer of a Solaris server ... 113
Figure 2.24: The Processes test that tracks the health of the Application Processes layer of a Solaris server ... 113
Figure 2.25: Tests that map to the Operating System layer of an AIX server ... 114
Figure 2.26: The tests that map to the Network layer of an AIX server ... 123
Figure 2.27: The test mapped to the Tcp layer of an AIX server ... 124
Figure 2.28: The Processes test that tracks the health of the Application Processes layer of an AIX server ... 124
Figure 2.29: Tests that map to the Operating System layer of an HPUX server ... 131
Figure 2.30: The tests that map to the Network layer of an HPUX server ... 135
Figure 2.31: The test mapped to the Tcp layer of an HPUX server ... 135
Figure 2.32: The Processes test that tracks the health of the Application Processes layer of an HPUX server ... 136
Figure 3. 1: Layer model for a Windows server ... 137
Figure 3. 2: The tests associated with the Operating System layer of a Windows Generic server ... 138
Figure 3.3: The detailed diagnosis of the Disk Activity test ... 151
Figure 3. 4: The detailed diagnosis of the Handles used by processes measure ... 159
Figure 3. 5: The detailed diagnosis of the Processes using handles above limit measure ... 159
Figure 3. 6: Tests associated with the Network layer of a Windows Generic server... 177
Figure 3. 7: The tests mapped to the Tcp layer of a Windows Generic server ... 180
Figure 3.8: The tests mapped to the OS Cluster layer ... 182
Figure 3.9: The detailed diagnosis of the Cluster disk status measure ... 188
Figure 3.10: The detailed diagnosis of the Service/application status measure... 194
Figure 3.11: The detailed diagnosis of the Server status measure ... 195
Figure 3.12: The detailed diagnosis of the IP status measure ... 195
Figure 3.13: The detailed diagnosis of the Has the owner changed? measure ... 195
Figure 3.14: The detailed diagnosis of the Total disk space measure ... 195
Figure 3.15: The detailed diagnosis of the Failed resources measure ... 195
Figure 3.16: The detailed diagnosis of the Offline resources measure ... 196
Figure 3.17: The detailed diagnosis of the Total disk count measure ... 199
Figure 3.18: The detailed diagnosis of the Used disks in cluster measure ... 199
Figure 3.19: How the Cluster Shared Volume works? ... 200
Figure 3.20: The detailed diagnosis of the Number of services/applications measure ... 205
Figure 3.21: The detailed diagnosis of the Number of nodes measure... 205
Figure 3. 22: The tests mapped to the Application Processes layer of a Windows Generic server ... 205
Figure 3. 23: The tests mapped to the Windows Service layer of a Windows Generic server ... 210
Figure 3.24: Configuring the WindowsServices test ... 213
Figure 3.25: Auto-configuring the services to be monitored ... 214
Figure 3.26: List of auto-discovered services ... 214
Figure 3.27: Multiple auto-discovered services configured for monitoring ... 215
Figure 3. 28: Configuring an ApplicationEvents test ... 221
Figure 3. 29: List of policies ... 221
Introduction
Most current day IT infrastructures are heterogeneous environments including a mix of different server hardware and operating systems. Sometimes, administrators might not want to monitor any of the applications executing on these operating systems, but would be interested in knowing how healthy the operating system hosting the application is. To cater to these needs, eG Enterprise offers 100% web-based, integrated moni of heterogeneous IT infrastructures. Administrators can monitor and manage a variety of Unix, Windows, and legacy operating systems from a common console. A novel layer model representation is used to analyze and depict the performance of different protocol layers of the infrastructure – network, operating system, TCP/IP stack, critical application processes and services, etc. By using a common performance model representation across heterogeneous infrastructures, eG Enterprise ensures that administrators are not exposed to the differing nature of each operating system and hence, have a short learning curve.
The monitoring can be done in an agent-based or in an agentless manner, and administrators can pick and choose the servers that have to be monitored with agents (e.g., critical production servers) and those that can be monitored in an agentless manner (e.g., staging servers).
A single agent license suffices to monitor a server and the agent license is transportable across operating systems. Agent-based and agentless monitoring is supported for Microsoft Windows 2000/2003, Sun Solaris, Red Hat Linux, Free BSD, SuSE Linux, HPUX, Tru64, and AIX operating systems. Agentless monitoring is also available for Novell Netware, OpenVMS, and OS/400 operating systems.
The following table summarizes the system monitoring capabilities of the eG Enterprise Suite.
Capability Metric Description
CPU Monitoring
CPU utilization per processor of a
server Know if a server is sized correctly in terms of processing power;
Determine times of day when CPU usage level is high Run queue length of a server Determine how many processes are contending for CPU resources
simultaneously Top 10 CPU consuming processes
on a server
Know which processes are causing a CPU spike on the server Top 10 servers by CPU utilization Know which servers have high CPU utilization, and
Memory Monitoring
Free memory availability Track free memory availability on your servers;
Determine if your servers are adequately sized in terms of memory availability
Swap memory usage Determine servers with high swap usage
Top 10 processes consuming
memory on the server Know which processes are taking up memory on a server
Top 10 servers by memory usage Know which servers have the lowest free memory
available and hence, may be candidates for memory upgrades
I/O Monitoring
Blocked processes Track the number of processes blocked on I/O;
Indicates if there is an I/O bottleneck on the server
Disk activity Track the percentage of time that the disks on a
server are heavily used.
Compare the relative busy times of the disks on a server to know if you can better balance the load across the disks of a server
Disk read/write times Monitor disk read and write times to detect instances
when a disk is slowing down (Windows only)
Disk queue length Track the number of processes queued on each disk
drive to determine disk drives that may be responsible for slow downs
Top 10 processes by disk activity Determine which processes are causing disk
reads/writes Uptime
Monitoring
Current uptime Determine how long a server has been up;
Track times when a server was rebooted;
Determine times when unplanned reboots happened;
Top 10 servers by uptime Know which servers have not been rebooted for a
long time; Disk Space
Monitoring
Total capacity Know the total capacity of each of the disk partitions
of a server
Free space Track the free space on each of the disk partitions of
a server;
Proactively be alerted of high disk space levels on a server;
Page File Usage
Current usage Monitor and alert on page file usage of a Windows
server; Network
Traffic Monitoring
Bandwidth usage Track the bandwidth usage of each of the network
interfaces of a server (Windows only);
Identify network interfaces that have excessive usage
Outbound queue length Determine queuing on each of the network interfaces
of a server;
Identify network interfaces that may be causing a slowdown;
Incoming and outgoing traffic Track the traffic into and out of a server through each
interface;
Identify servers and network interfaces with maximum traffic;
Network Monitoring
Packet loss Track the quality of a network connection to a server;
Identify times when excessive packet loss happens;
Average delay Determine the average delay of packets to a server;
Availability Determine times when a server is not reachable over
the network; TCP
Monitoring
Current connections Track currently established TCP connections to a
server; Incoming/outgoing TCP connection
rate Monitor the server workload by tracking the rate of TCP connections to and from a server
TCP retransmissions Track the percentage of TCP segments retransmitted
from the server to clients;
Be alerted when TCP retransmits are high and therefore, are likely to cause significant slowdowns in application performance;
Process Monitoring
Processes running Track the number of processes of a specific
application that are running simultaneously;
Identify times when a specific application process is not running
CPU usage Monitor the CPU usage of an application over time;
Determine times when an application is taking excessive CPU resources.
Memory usage Track the memory usage of an application over time;
Identify if an application has a memory leak or not;
Threads Track the number of threads running for an
application’s process (Windows only);
Handles Track the number of handles held by an application
over time (Windows only);
Identify if a process has handle leaks; Windows
Services Monitoring
Availability Determine if a service is running or not
Server Log Monitoring
New events Track the number of information, warning, and error
events logged in the Microsoft Windows System and Application event logs;
Correlate events in the Windows event logs with other activity on the server (e.g., service failure)
Obtain details of the events in the event logs; Security success and failure events Monitor all events logged in the Microsoft Windows
Security log;
Obtain details of all failure events;
Events in /var/adm/messages log Track and be alerted of all errors logged in the /var/adm/messages log of a Unix system
Auto-correction
Automatic restart of failed services Determine Windows services that should be running automatically; Monitor if these services are up or not, and restart any failed service automatically
Monitoring Unix Servers
For hosts running flavors of Unix, eG Enterprise offers specialized monitoring models - one each for every Unix-based operating system that is supported by eG Enterprise. These are, namely:
Linux
Solaris
AIX
HPUX
Figure 2. 1 below depicts the Linux monitoring model.
Figure 2. 1: The Linux monitoring model Note:
Only a Basic Monitor license is required for using each of the above-mentioned monitoring models, regardless of the monitoring approach you employ - i.e., agent-based or agentless.
In addition to the above models, a Generic server model is also available, which can be used for monitoring any generic Unix host - this again consumes a Basic Monitor license only.
The key advantage of this monitoring model is that it is consistent across all the Unix-based operating systems that the eG agent supports – in other words., the Linux, Solaris, AIX, and HPUX models offered out-of-the-box by the eG Enterprise suite are represented by the same set of layers depicted by Figure 2. 1.
However, the tests mapped to each layer and the metrics they report may differ from one OS-specific model to another.
This chapter discusses each of these OS-specific models in detail.
2.1
Monitoring Linux Servers
Figure 2. 1 displays the layer model of a Linux server. While the Operating System layer represents the state of the host system on which the application executes, the Networklayer represents the state of the network links to and from the host system. Depending on whether the application relies on the Transmission Control Protocol (TCP) or the User Datagram Protocol (UDP), either the Tcp or the Udp layers is used to represent the status of the transport protocol. The Application Processes layer tracks the status of key processes executing on the host system.
2.1.1
The Operating System Layer
Since the status of a host depends on its CPU, memory, and disk utilization, the eG Enterprise suite uses a SystemDetails test that tracks the CPU and memory utilization and DiskActivity and DiskSpace tests that monitor the disk utilization. Figure 2.2 illustrates the tests that map to the Operating System layer. While the SystemDetails test tracks the overall health of the target host, the DiskActivity and DiskSpace tests report the states of each of the disk partitions of the host individually.
Note:
Figure 2.2: Tests that map to the Operating System layer of a Linux server
2.1.1.1
Server Load Average Test
In UNIX computing, the system load is a measure of the amount of work that a computer system performs. The
load average represents the average system load over a period of time. This test reports the average load of Unix systems by reporting three metrics, which represent the system load during the last one-, five-, and fifteen-minute periods.
Note:
Purpose The load average represents the average system load over a period of time. This test reports the average load of Unix systems by reporting three metrics, which represent the system load during the last one-, five-, and fifteen-minute periods.
Target of the test
Any Unix host system
Agent deploying the test An internal agent Configurable parameters for the test
1. TEST PERIOD - How often should the test be executed 2. HOST - The host for which the test is to be configured.
3. PORT - Refers to the port used by the specified host. By default, it is NULL.
Outputs of the test
One set of results for each host monitored
Measurements made by the test
Measurement Measurement Unit Interpretation
Average load in the last 1 min:
Indicates the average number of processes waiting in the run-queue over the past 1 minute.
Number For an idle computer, the value of these
measures will be 0. Each process using or waiting for CPU (the ready queue or run queue) will increment these values by 1. Most UNIX systems count only processes in the running (on CPU) or runnable (waiting for CPU) states. However, Linux also includes processes in uninterruptible sleep states (usually waiting for disk activity), which can lead to markedly different results if many processes remain blocked in I/O due to a busy or stalled I/O system. This, for example,
Average load in the last 5 mins:
Indicates the average number of processes waiting in the run-queue over the past 5 minutes.
Average load in the last 15 mins:
Indicates the average number of processes waiting in the run-queue over the past 15 minutes.
Number includes processes blocking due to an NFS
server failure or to slow media (e.g., USB 1.x storage devices). Such circumstances can result in significantly increasing the value of this measure, which may not reflect an actual increase in CPU use, but will still give an idea on how long users have to wait.
For single-CPU systems that are CPU-bound, one can think of load average as a percentage of system utilization during the respective time period. For systems with multiple CPUs, one must divide the number by the number of processors in order to get a comparable percentage.
For example, if these measures report the values 1.73, 0.50, and 7.98, respectively, on a single-CPU system, these values can be interpreted as follows:
during the last minute, the CPU was overloaded by 73% (1 CPU with 1.73 runnable processes, so that 0.73 processes had to wait for a turn)
during the last 5 minutes, the CPU was underloaded 50% (no processes had to wait for a turn)
during the last 15 minutes, the CPU was overloaded 698% (1 CPU with 7.98 runnable processes, so that 6.98 processes had to wait for a turn)
This means that this CPU could have handled all of the work scheduled for the last minute if it were 1.73 times as fast, or if there were two (the ceiling of 1.73) times as many CPUs, but that over the last five minutes it was twice as fast as necessary to prevent runnable processes from waiting their turn. In a system with four CPUs, a load average of 3.73 would indicate that there were, on average, 3.73 processes ready to run, and each one could be scheduled into a CPU.
2.1.1.2
Disk Activity Test
On Linux systems, the test will return the input/output utilization of each "device" on the system. The device name is in the format "hdiskn" for 2.2 kernels, where "n" is the device number. For newer Linux kernels though, the device name is displayed as "devm-n", where m is the major number of the device, and n a distinctive number.
Purpose Returns the input/output utilization of each "device" on the system
Target of the test
Any host system
Agent deploying the test An internal agent Configurable parameters for the test
1. TEST PERIOD - How often should the test be executed 2. HOST - The host for which the test is to be configured.
3. USEEXE - Setting the USEEXE flag to true, ensures that the disk activity metrics are collected by executing a binary instead of dynamically linking to the Performance instrumentation library. By default, this is set to false.
4. DISKS- To obtain disk activity metrics for both logical and physical disks, enter all in the DISKS text box. To collect metrics for physical disks, set the DISKS parameter to Physical and to collect metrics for logical disks, set the parameter to Logical.
5. USE SUDO – This parameter is of significance to Linux and Solaris platforms only. By default, the USE SUDO parameter is set to No. This indicates that, by default, this test will report the detailed diagnosis for the Disk busy measure of each disk partition being monitored by executing the /usr/bin/iotop command or /usr/sbin/iotop command. However, in some highly secure environments, this command cannot be executed directly. In such cases, set this parameter to Yes. This will enable the eG agent to execute the
sudo/usr/bin/iotop command or sudo/usr/sbin/iotop and retrieve the detailed diagnosis of the Disk busy measure.
6. DETAILED DIAGNOSIS - To make diagnosis more efficient and accurate, the eG Enterprise suite embeds an optional detailed diagnostic capability. With this capability, the eG agents can be configured to run detailed, more elaborate tests as and when specific problems are detected. To enable the detailed diagnosis capability of this test for a particular server, choose the On option. To disable the capability, click on the Off option.
The option to selectively enable/disable the detailed diagnosis capability will be available only if the following conditions are fulfilled:
The eG manager license should allow the detailed diagnosis capability
Both the normal and abnormalfrequencies configured for the detailed diagnosis measures should not be 0.
Outputs of the test
One set of results for each host monitored
Measurements made by the test
Disk busy:
Indicates the percentage of elapsed time during which the disk is busy processing requests (i.e., reads or writes).
Percent Comparing the percentage of time that the
different disks are busy, an administrator can determine whether the application load is properly balanced across the different disks. The detailed diagnosis of this measure will reveal the top-10 I/O-intensive processes executing on the host.
Disk read time: Indicates the average time in seconds of a read of data from the disk.
Secs
Disk write time:
Indicates the average time in seconds of a write of data from the disk.
Secs
Data read rate from disk:
Indicates the rate at which bytes are transferred from the disk during read operations.
KB/Sec A very high value indicates an I/O bottleneck
on the server.
Data write rate to disk:
Indicates the rate at which bytes are transferred from the disk during write operations.
KB/Sec A very high value indicates an I/O bottleneck
on the server.
Disk service time:
Indicates the average time that this disk took to service each transfer request ( i.e., the average I/O operation time)
Secs A sudden rise in the value of this measure
can be attributed to a large amount of information being input or output. A consistent increase however, could indicate an I/O processing bottleneck.
Disk queue time:
Indicates the average time that transfer requests waited idly on queue for this disk.
Secs Ideally, the value of this measure should be low.
Disk I/O time:
Indicates the avarage time taken for read and write operations of this disk.
Secs The value of this measure is the sum of the
values of the Disk service time and Disk queue time measures.
A consistent increase in the value of this measure could indicate a latency in I/O processing.
Disk read rate:
Indicates the number of reads happening on a logical disk per second.
Reads/Sec A dramatic increase in this value may be indicative of an I/O bottleneck on the server.
Disk write rate:
Indicates the number of writes happening on a local disk per second.
Writes/Sec A dramatic increase in this value may be indicative of an I/O bottleneck on the server.
Avg queue length:
Indicates the average number of both read and write requests that were queued for the selected disk during the sample interval.
Number
2.1.1.3
Disk Space Test
This test monitors the space usage of every disk partition on a host. While this test typically reports the space usage of every physical disk partition on a host, when monitoring hosts running Windows 2008/Vista/7 hosts however, this test reports usage metrics of physical and logical partitions.
Purpose To measure the space usage of every disk partition on a host
Target of the test
Any host system
Agent deploying the test
An internal agent Note:
For this test to report measures on Unix systems, the sysstat package must be installed on the server (check for the existence of the iostat command on the target system).
For this test to report measures on Linux systems in particular, the iotop command should exist on the system.
If the sysstat version installed on the target server is less than 4.0.7, the following measures also will not be available – Data read rate from disk and Data write rate to disk.
Configurable parameters for the test
1. TEST PERIOD - How often should the test be executed 2. HOST - The host for which the test is to be configured.
3. DISCOVER NFS – Set this flag to Yes, if you want the test to automatically discover NFS drives on your system and report their status as well. By default, this flag is set to No.
4. DOMAIN, DOMAIN USER, AND DOMAIN PASSWORD – These parameters are applicable
to Windows systems only. When monitoring a Windows system, if the DISCOVER NFSflag
of this test is set to Yes, then the test should be configured with the privileges of a valid domain user in order to auto-discover NFS drives and report their usage and status. In such a case therefore, specify a valid Windows domain name against DOMAIN , provide the name of a valid user in that domain against DOMAIN USER, and specify the password of that user against PASSWORD. Once the domain user credentials are provided, the test auto-discovers all those NFS drives on the target Windows system to which the configured domain user has access.
5. CONFIRM PASSWORD – Retype the PASSWORD of the configured domain user here. 6. TIMEOUT – - Specify the maximum duration (in seconds) for which the test will wait for a
response from the server. The default timeout period is 30 seconds
Outputs of the test
One set of results for each physical/logical disk partition and/or NFS drive on the host monitored
Measurements made by the test
Measurement Measurement Unit Interpretation
Total capacity:
Indicates the total capacity of a disk partition.
MB
Used space:
Indicates the amount of space used in a disk partition.
MB
Free space:
Indicates the current free space available for each disk partition of a system.
MB
Percent usage: Indicates the percentage of space usage on each disk partition of a system.
Percent A value close to 100% can indicate a
potential problem situation where
applications executing on the system may not be able to write data to the disk partition(s) with very high usage.
Drive availability:
Indicates whether/not this drive is available currently.
Percent If the drive is available, then this measure will report the value 100. If not, then this measure will report the value 0.
This measure gains significance when monitoring NFS drives, as it enables you to identify those drives that are no longer mapped to the system.
2.1.1.4
System Details Test
This operating system-specific test relies on native measurement capabilities of the operating system to collect various metrics pertaining to the CPU and memory usage of a host system. The details of this test are as follows:
Purpose To measure the CPU and memory usage of a host system
Target of the test
Any host system
Agent deploying the test An internal agent Configurable parameters for the test
1. TEST PERIOD - How often should the test be executed 2. HOST - The host for which the test is to be configured.
3. DURATION - This parameter is of significance only while monitoring Unix hosts, and indicates how frequently within the specified TEST PERIOD, the agent should poll the host for CPU usage statistics.
4. SUMMARY – This attribute is applicable to multi-processor systems only. If the Yes option is selected, then the eG agent will report not only the CPU and memory utilization of each of the processors, but it will also report the summary (i.e., average) of the CPU and memory utilizations of the different processors. If the No option is selected, then the eG agent will report only the CPU usage of the individual processors.
5. USEIOSTAT – This parameter is of significance to Solaris platforms only. By default, the USEIOSTAT flag is set to No. This indicates that, by default, SystemTest reports the CPU utilization of every processor on the system being monitored, and also provides the average CPU utilization across the processors. However, if you want SystemTest to report only the average CPU utilization across processors and across user sessions, then set the USEIOSTAT flag to Yes. In such a case, the processor-wise breakup of CPU utilization will not be available.
6. USEPS - This flag is applicable only for AIX LPARs. By default, this flag is set to No.
7. INCLUDE WAIT - This flag is applicable to Unix hosts alone. On Unix hosts, CPU time is also consumed when I/O waits occur on the host. By default, on Unix hosts, this test does not consider the CPU utilized by I/O waits while calculating the value of the CPU utilization
measure. Accordingly, the INCLUDE WAIT flag is set to No by default. To make sure that the CPU utilized by I/O waits is also included in CPU usage computations on Unix hosts, set this flag to Yes.
8. ENABLE MEMORY DIAGNOSIS - By default, the ENABLE MEMORY DIAGNOSISflag is set to
NO, indicating that detailed diagnosis will not be available for the Free memory measure reported by this test by default. If you want to view the detailed diagnosis of the Free memory measure - i.e., to view the top 10 processes on the target host that are utilizing memory excessively - you can change this flag to YES.
9. USEGLANCE - This flag applies only to HP-UX systems. HP GlancePlus/UX is Hewlett-Packards’s online performance monitoring and diagnostic utility for HP-UX based computers. There are two user interfaces of GlancePlus/UX -- Glance is character-based, and gpm is motif-based. Each contains graphical and tabular displays that depict how primary system resources are being utilized. In environments where Glance is run, the eG agent can be configured to integrate with Glance to pull out detailed metrics pertaining to the CPU usage of the HP-UX systems that are being monitored. By default, this integration is disabled. This is why the USEGLANCE flag is set to No by default. You can enable the integration by setting the flag to Yes. If this is done, then the test polls the Glance interface of HP GlancePlus/UX utility to report the detailed diagnosis information.
10. USE TOP FOR DD - This parameter is applicable only to Linux platforms. By default, this parameter is set to No. This indicates that, by default, this test will report the detailed diagnosis of the System CPU utilization measure for each processor being monitored by executing the usr/bin/ps command. In some environments however, this command may not return accurate diagnostics. In such cases, set the USE TOP FOR DD parameter to Yes. This will enable the eG agent to extract the detailed diagnosis of the System CPU utilization measure by executing the /usr/bin/top command instead.
11. DETAILED DIAGNOSIS - To make diagnosis more efficient and accurate, the eG Enterprise suite embeds an optional detailed diagnostic capability. With this capability, the eG agents can be configured to run detailed, more elaborate tests as and when specific problems are detected. To enable the detailed diagnosis capability of this test for a particular server, choose the On option. To disable the capability, click on the Off option.
The option to selectively enable/disable the detailed diagnosis capability will be available only if the following conditions are fulfilled:
The eG manager license should allow the detailed diagnosis capability
Both the normal and abnormalfrequencies configured for the detailed diagnosis measures should not be 0.
Outputs of the test
One set of results for each host monitored
Measurements
made by the Measurement
Measurement
test CPU utilization:
This measurement
indicates the percentage of utilization of the CPU time of the host system.
Percent A high value could signify a CPU bottleneck. The CPU utilization may be high because a few processes are consuming a lot of CPU, or because there are too many processes contending for a limited resource. Check the currently running processes to see the exact cause of the problem.
System CPU utilization: Indicates the percentage of CPU time spent for system-level processing.
Percent An unusually high value indicates a problem and may be due to too many system-level tasks executing simultaneously.
Run queue length: Indicates the instantaneous length of the queue in which threads are waiting for the processor cycle. This length does not include the threads that are currently being executed.
Number A value consistently greater than 2 indicates that many processes could be simultaneously contending for the processor.
Blocked processes: Indicates the number of processes blocked for I/O, paging, etc.
Number A high value could indicate an I/O problem on the host (e.g., a slow disk).
Swap memory:
On Windows systems, this measurement denotes the
committed amount of
virtual memory. This
corresponds to the space reserved for virtual memory on disk paging file(s). On Solaris systems, this metric corresponds to the swap space currently available. On HPUX and AIX systems, this metric corresponds to the amount of active virtual memory (it is assumed that
one virtual page
corresponds to 4 KB of
memory in this
computation).
MB An unusually high value for the swap usage
can indicate a memory bottleneck. Check the memory utilization of individual processes to figure out the process(es) that has (have) maximum memory consumption and look to tune their memory usages and allocations accordingly.
Free memory:
Indicates the free memory available.
MB This measure typically indicates the amount
of memory available for use by applications running on the target host.
On Unix operating systems (AIX and Linux), the operating system tends to use parts of the available memory for caching files, objects, etc. When applications require additional memory, this is released from the
operating system cache. Hence, to
understand the true free memory that is available to applications, the eG agent reports the sum of the free physical memory and the operating system cache memory size as the value of the Free memory measure while monitoirng AIX and Linux operating systems.
The detailed diagnosis of this measure, if enabled, lists the top 10 processes
responsible for maximum memory
consumption on the host.
Note:
For multi-processor systems, where the CPU statistics are reported for each processor on the system, the statistics that are system-specific (e.g., run queue length, free memory, etc.) are only reported for the "Summary" descriptor of this test.
The detailed diagnosis capability of the System CPU utilization and CPU utilization measures, if enabled, provides a listing of the top 10 CPU-consuming processes (see Figure 2.3). In the event of a Cpu bottleneck, this information will enable users to identify the processes consuming a high percentage of CPU time. The users may then decide to stop such processes, so as to release the CPU resource for more important processing purposes.
Figure 2.3: The top 10 CPU consuming processes
The detailed diagnosis of the Free memory measure, if enabled, lists the top 10 processes responsible for maximum memory consumption on the host (see Figure 2.4). This information will enable administrators to identify the processes that are causing the depletion in the amount of free memory on the host. The administrators can then decide to kill such expensive processes.
Note:
While instantaneous spikes in CPU utilization are captured by the eG agents and displayed in the Measures page, the detailed diagnosis will not capture/display such instantaneous spikes. Instead, detailed diagnosis will display only a consistent increase in CPU utilization observed over a period of time.
Figure 2.4: The detailed diagnosis of the Free_memory measure listing the top 10 memory consuming processes
2.1.1.5
I/O Waits Test
The IOWaits test reports the CPU utilization of processes waiting for input or output. This test works on Solaris, Linux, AIX, and HPUX platforms only.
Purpose Reports the CPU utilization of processes waiting for input or output
Target of the test
Solaris, Linux, AIX and HPUX systems
Agent deploying the test An internal agent Configurable parameters for the test
1. TEST PERIOD - How often should the test be executed 2. HOST - The host for which the test is to be configured
3. DURATION - By default, this parameter is set to 5 seconds. This implies that, by default, the test will run for 5 seconds, at the end of which, it will report the CPU usage of processes averaged across the 5 seconds.
Outputs of the test
One set of results for the system being monitored
Measurements made by the test
Measurement Measurement Unit Interpretation
CPU utilization waiting for I/O:
Indicates the percentage of CPU utilized by processes waiting for input or output.
Percent If this percentage exceeds 10%, it indicates a
critical issue which needs to be addressed immediately.
2.1.1.6
Swap Test
Swap space is space on a hard disk used as the virtual memory extension of a computer's real memory (RAM). The least recently used files in RAM can be "swapped out" to the hard disk until they are needed later so that new files can be "swapped in" to RAM. Having an appropriate amount of swap space is important for optimal system performance.
Purpose Provides statistics pertaining to the swap space on a hard disk
Target of the test
A Solaris, Linux, AIX or HPUX system only
Agent deploying the test An internal agent Configurable parameters for the test
1. TEST PERIOD - How often should the test be executed 2. HOST - The host for which the test is to be configured
Outputs of the test
One set of results for every server being monitored
Measurements made by the test
Measurement Measurement Unit Interpretation
Swap used:
Indicates the total swap
space that is either
allocated or reserved.
MB
Swap allocated:
Indicates the total swap space currently allocated for use as a backing store.
MB This measure is not available for HPUX
systems.
Swap reserved:
Indicates the total amount of swap space not currently allocated but claimed for future use.
MB This measure is not available for AIX and
HPUX systems.
Swap available:
Indicates the total swap space that is currently
available for future
reservation and allocation. MB
Swap used percent:
Indicates the percentage of
swap space that is
allocated or reserved.
Percent A value close to 100% indicates that the
swap space configured may not be sufficient. A value close to 0 may imply that the swap space configured may be too large.
Swap queue:
Indicates the number of processes swapped out currently.
Number Ideally, this value should be close to 0. This measure is not available for AIX systems.
2.1.1.7
Memory Details Test
This test reports statistics pertaining to the memory utilization of target systems. The measures made by this test are as follows:
Purpose Reports statistics pertaining to the memory utilization of target systems
Target of the test
Any host system
Agent deploying the test An internal agent Configurable parameters for the test
1. TEST PERIOD - How often should the test be executed 2. HOST - The host for which the test is to be configured
Outputs of the test
One set of results for every server being monitored
Measurements made by the test
Measurement Measurement Unit Interpretation
Memory page ins:
Indicates the number of times per second that a process needed to access a piece of memory that was not in its working set, meaning that the system had to retrieve it from the page file.
Pages/Sec
Memory page outs:
Indicates the number of times per second the system decided to trim a process's working set by writing some memory to disk in order to free up
physical memory for
another process.
Pages/Sec This value is a critical measure of the memory utilization on a server. If this value never increases, then there is sufficient memory in the system. Instantaneous spikes of this value are acceptable, but if the value itself starts to rise over time or with load, it implies that there is a memory shortage on the server.
2.1.1.8
Memory Usage Test
This test reports statistics related to the usage of the physical memory of the system.
Target of the test
Any host system
Agent deploying the test An internal agent Configurable parameters for the test
1. TEST PERIOD - How often should the test be executed 2. HOST - The HOST for which the test is to be configured
3. USEGLANCE - This flag applies only to HP-UX systems. HP GlancePlus/UX is Hewlett-Packards’s online performance monitoring and diagnostic utility for HP-UX based computers. There are two user interfaces of GlancePlus/UX -- Glance is character-based, and gpm is motif-based. Each contains graphical and tabular displays that depict how primary system resources are being utilized. In environments where Glance is run, the eG agent can be configured to integrate with Glance to pull out detailed metrics pertaining to the memory usage of the HP-UX systems that are being monitored. By default, this integration is disabled. This is why the USEGLANCE flag is set to No by default. You can enable the integration by setting the flag to Yes. If this is done, then the test polls the Glance interface of HP GlancePlus/UX utility to report the detailed diagnosis information pertaining to memory usage.
4. DETAILED DIAGNOSIS - To make diagnosis more efficient and accurate, the eG Enterprise suite embeds an optional detailed diagnostic capability. With this capability, the eG agents can be configured to run detailed, more elaborate tests as and when specific problems are detected. To enable the detailed diagnosis capability of this test for a particular server, choose the On option. To disable the capability, click on the Off option.
The option to selectively enable/disable the detailed diagnosis capability will be available only if the following conditions are fulfilled:
The eG manager license should allow the detailed diagnosis capability
Both the normal and abnormalfrequencies configured for the detailed diagnosis measures should not be 0.
Outputs of the test
One set of results for every server being monitored
Measurements made by the test
Measurement Measurement Unit Interpretation
Total physical memory:
Indicates the total physical memory of the system.
MB
Used physical memory: Indicates the used physical memory of the system.
Free physical memory:
Indicates the free physical memory of the system.
MB This measure typically indicates the amount
of memory available for use by applications running on the target host.
On Unix operating systems (AIX and Linux), the operating system tends to use parts of the available memory for caching files, objects, etc. When applications require additional memory, this is released from the
operating system cache. Hence, to
understand the true free memory that is available to applications, the eG agent reports the sum of the free physical memory and the operating system cache memory size as the value of the Free physical memory
measure while monitoring AIX and Linux operating systems.
Physical memory utilized:
Indicates the percent usage of physical memory.
Percent Ideally, the value of this measure should be low. While sporadic spikes in memory usage could be caused by one/more rogue processes on the system, a consistent increase in this value could be a cause for some serious concern, as it indicates a gradual, but steady erosion of valuable memory resources. If this unhealthy trend is not repaired soon, it could severely hamper system performance, causing anything from a slowdown to a complete system meltdown. You can use the detailed diagnosis of this measure to figure out which processes on the host are consuming memory excessively.
2.1.1.9
Uptime Test
In most production environments, it is essential to monitor the uptime of critical servers in the infrastructure. By tracking the uptime of each of the servers, administrators can determine what percentage of time a server has been up. Comparing this value with service level targets, administrators can determine the most trouble-prone areas of the infrastructure.
In some environments, administrators may schedule periodic reboots of their servers. By knowing that a specific server has been up for an unusually long time, an administrator may come to know that the scheduled reboot task is not working on a server.
Note:
While monitoring Linux/AIX operating systems, you may observe discrepancies between the value of the
Physical memory utilized measure and the memory usage percentages reported per process by the detailed diagnosis of the same measure. This is because, while the Physical memory utilizedmeasure takes into account the memory in the OS cache of the Linux/AIX operating system, the memory usage percent that the detailed diagnosis reports per process does not consider the OS cache memory.
The Uptime test included in the eG agent monitors the uptime of critical Windows and Unix servers.
Purpose To monitor the uptime of a Windows or Unix server
Target of the test
A Windows or Unix server
Agent deploying the test An internal agent Configurable parameters for the test
1. TEST PERIOD - How often should the test be executed 2. HOST - The host for which the test is to be configured.
3. REPORTMANAGERTIME – By default, this flag is set to Yes, indicating that, by default, the detailed diagnosis of this test, if enabled, will report the shutdown and reboot times of the device in the manager’s time zone. If this flag is set to No, then the shutdown and reboot times are shown in the time zone of the system where the agent is running (i.e., the system being managed for agent-based monitoring, and the system on which the remote agent is running - for agentless monitoring).
4. LOG LOCATION - This is applicable only to Windows platforms. Typically, the first time
this test executes on a Windows system/server, it creates a
sysuptime_<Nameofmonitoredcomponent>.log in the <EG_AGENT_INSTALL_DIR>\agent\logs
directory. This log file keeps track of the system reboots - each time a reboot occurs, this log file is updated with the corresponding details. During subsequent executions of this test, the eG agent on the Windows system/server reads this log file and reports the uptime and reboot-related metrics of the target. In case of a physical Windows system/server, this log file ‘persists’ in the said location, regardless of how often the system is rebooted. However, in case of a Windows system/server that has been ‘provisioned’ by a Provisioning server, this log file is recreated in the <EG_AGENT_INSTALL_DIR>\agent\logs directory every time a reboot/refresh occurs. In the absence of a ‘persistent’ log file, the test will not be able to track reboots and report uptime accurately. To avoid this, when monitoring a provisioned Windows system/server, you have the option to instruct the test to create the
sysuptime_<Nameofmonitoredcomponent>.log file in an alternate location that is ‘persistent’ - i.e., in a directory that will remain regardless of a restart. Specify the full path to this persistent location in the LOG LOCATION text box. For instance, your LOG LOCATION can be, D:\eGLogs. In this case, when the test executes, the sysuptime_<Nameofmonitoredcomponent>.log file will be created in the
D:\eGLogs\eGagent\logs folder. By default, the LOG LOCATION parameter is set to none.
be Outputs of the test
One set of results for every server being monitored
Measurements
made by the test Measurement Measurement Unit Interpretation
Has the system been rebooted?:
Indicates whether the server has been rebooted during the last measurement period or not.
Boolean If this measure shows 1, it means that the server was rebooted during the last measurement period. By checking the time periods when this metric changes from 0 to 1, an administrator can determine the times when this server was rebooted.
Uptime during the last measure period: Indicates the time period that the system has been up since the last time this test ran.
Secs If the server has not been rebooted during the last measurement period and the agent has been running continuously, this value will be equal to the measurement period. If the server was rebooted during the last measurement period, this value will be less than the measurement period of the test. For example, if the measurement period is 300 secs, and if the server was rebooted 120 secs back, this metric will report a value of 120 seconds. The accuracy of this metric is dependent on the measurement period – the smaller the measurement period, greater the accuracy.
Total uptime of the system:
Indicates the total time that the server has been up since its last reboot.
Mins Administrators may wish to be alerted if a server has been running without a reboot for a very long period. Setting a threshold for this metric allows administrators to determine such conditions.
2.1.1.10
Message Queues Test
A message queue is a linked list of messages stored within the kernel and identified by a message queue identifier. Two (or more) processes can exchange information via access to a common system message queue.
The Linux kernel (2.6) implements two message queues: System V IPC messages and POSIX Message Queue.
IPC messaging lets processes send and receive messages, and queues messages for processing in an arbitrary order. A process can invoke msgsnd() to send a message. He needs to pass the IPC identifier of the receiving message queue, the size of the message and a message structure, including the message type and text. On the other side, a process invokes msgrcv() to receive a message, passing the IPC identifier of the message queue, where the message should get stored, the size and a value t. t specifies the message returned from the queue - a positive value means the first message with its type equal to t is returned; a negative value returns the last message equal to type t, and zero returns the first message of the queue. There are limitations upon the size of a message (max), the total number of messages (mni), and the total size of all messages in the queue (mnb). This implies that if the number or size of the messages in a message queue touches these limits or grows close to these limits, it could indicate a problem condition that should be investigated. To proactively capture such problem conditions, administrators should continuously monitor the growth in the length and size of each IPC message queue on a
Note:
For a Unix host, if a value less than a minute is configured as the TEST PERIOD of the Uptime test, then, the
Uptime during the last measure period measure will report the value 0 until the minute boundary is crossed. For instance, if you configure the Uptime test for a Unix host to run every 10 seconds, then, for the first 5 test execution cyles (i.e., 10 x 5 = 50 seconds), the Uptime during the last measure period measure will report the value 0 only; however, the sixth time the test executes (i.e, when test execution touches the 1 minute boundary), this measure will report the value 60 seconds. This way, every sixth measurement period will report 60 seconds as the uptime of the host. This is because, Unix hosts report uptime only in minutes and not in seconds.
server. This is exactly what the Message Queues test does! This test auto-discovers the message queues on a monitored server, and closely tracks the number and size of the messages in each queue, thus instantly pointing administrators to those queues that have too many outstanding messages or very large messages. This way, potential bottlenecks in inter-process communication can be isolated and treated!
Purpose Auto-discovers the message queues on a monitored server, and closely tracks the number and
size of the messages in each queue, thus instantly pointing administrators to those queues that have too many outstanding messages or very large messages. This way, potential bottlenecks in inter-process communication can be isolated and treated
Target of the test
A Linux, AIX, HPUX, or Solaris server
Agent deploying the test An internal agent Configurable parameters for the test
1. TEST PERIOD - How often should the test be executed 2. HOST - The host for which the test is to be configured.
3. REPORT BY – By default, this flag is set to Owner. This implies that, by default, the test metrics for every message queue owner on the target server. You can set this flag to Total, if you want the test to report metrics for the Total descriptor alone; in this case, the test will aggregate measures across all the message queues on the server. Alternatively, you can pick the Owner and Total option. In this case, the test will report metrics per owner and also for the Total descriptor.
4. DD FREQUENCY - Refers to the frequency with which detailed diagnosis measures are to be generated for this test. The default is 1:1. This indicates that, by default, detailed measures will be generated every time this test runs, and also every time the test detects a problem. You can modify this frequency, if you so desire. Also, if you intend to disable the detailed diagnosis capability for this test, you can do so by specifying none against DD FREQUENCY.
5. DETAILED DIAGNOSIS - To make diagnosis more efficient and accurate, the eG Enterprise suite embeds an optional detailed diagnostic capability. With this capability, the eG agents can be configured to run detailed, more elaborate tests as and when specific problems are detected. To enable the detailed diagnosis capability of this test for a particular server, choose the On option. To disable the capability, click on the Off option.
The option to selectively enable/disable the detailed diagnosis capability will be available only if the following conditions are fulfilled:
The eG manager license should allow the detailed diagnosis capability
Both the normal and abnormalfrequencies configured for the detailed diagnosis measures should not be 0.
be Outputs of the test
One set of results for every queue owner (by default) of the server being monitored
Measurements
Number of queues: Indicates the number of queues for this owner. For the Total descriptor, this measure indicates the total number of message queues on the server.
Number This measure will be reported for the Total
descriptor, only if the REPORT BY flag is set to Total or Owner and Total.
Outstanding messages in queue:
For each owner, this
measure indicates the total
number of outstanding
messages in all queues owned by that owner.
Number A high value or a consistent increase in the value of this measure is an indication that many messages are still undelivered to the receiver. Typically, this occurs if either or both the following are true:
The number of bytes already on the queue is equal to the maximum number of bytes that the queue can handle.
The total number of messages on all queues system-wide is equal to the system-imposed limit.
In such cases, you may either have to remove messages from the queue, or reset the maximum limits, so that inter-process communication remains unaffected.
Data in message queue:
For each owner, this
measure indicates the total
number of bytes in
outstanding messages
across all queues owned by that owner.
KB Compare the value of this measure across
owners to identify that owner whose queues are of the maximum size. If the max value is abnormally high, it could mean that one or more queues owned by that owner contain heavy messages or too many messages. You may then want to identify which queues are of the maximum size and why. For this, you can use the detailed diagnosis of this measure. The detailed diagnosis, if enabled, reveals details of each queue owned by the owner. The details include the name of the creator of each message queue, the number of bytes of data that each queue contains, the number of messages in every queue, the sender process and receiver process for the last message to the queue, and more. From this, you can easily pick the queues with the maximum number of messages and those that are of the maximum size. If any queue contains very few messages but is of a large size, it could mean that those messages are heavy. On the other hand, if any queue contains many messages and is also of a large size, it could mean that the queue is not processing messages and delivering them as quickly as it should. This could signal a potential bottleneck in inter-process communication, which would require further investigation.
Maximum size allowed:
For each owner, this indicates the total number of bytes allowed in all message queues owned by that owner.
Is message queue full?
For each owner, this indicates whether/not any queue owned by that owner has been used upto capacity – i.e., whether/not the number of bytes in the outstanding messages on that queue is equal to the maximum number of bytes allowed.
If any message queue owned by an owner is full, the value of this measure will be Yes. If no message queue is full, then the value of this measure will be No.
The numeric values that correspond to the
above-mentioned measure values are
described in the table below:
Measure Value Numeric Value
Yes 0
No 1
Note:
By default, this measure reports one of the
Measure Values listed in the table above. The graph of this measure however will represent the same using the numeric equivalents only.
Number of non-zero message queues:
Indicates the total number of queues on the server that are of a size greater than 0.
Number This measure is available only for the ‘Total’ descriptor.
To know which queues are of a non-zero size, use the detailed diagnosis of this measure.
Total data in message queue:
Indicates the total number of bytes in outstanding messages in all message queues on the server.
KB This measure is available only for the ‘Total’
descriptor.
To know which queue contains the maximum number of bytes in outstanding messages, use the detailed diagnosis of this measure.
2.1.1.11
IPC Semaphores Test
Semaphores are data structures that are used for synchronization between two or more processes. They are often used to monitor and control the availability of system resources such as shared memory segments. Basically, they can be viewed as a single integer that represents the amout of resources available. When a process wants a resource, it checks the value of the semaphore, and if it it non-zero, it decrements the appropriate number from the semaphore in accordance to the amout of resources it wishes to use. The kernel will block the process if the semaphore is zero or doesn't have a value high enough for the decrement.
Semaphores can be operated on as individual units or as elements in a set. A semaphore set consists of a control structure and an array of individual semaphores. A set of semaphores can contain up to 25 elements. Like message queues, the semaphore set creator can change its ownership or permissions. To know the count and composition of semaphore sets and understand who owns which semaphore set, administrators can use the IPC Semaphores test.
Purposexx To know the count and composition of semaphore sets and understand who owns which
semaphore set, administrators can use the IPC Semaphores test