Drought preparedness, impact and response: A case of
the Eastern Cape and Free State provinces of South Africa
Author: Makala J. Ngaka1
Affiliation:
1Department of Agriculture, Forestry and Fisheries, South Africa
Correspondence to: Makala Ngaka
Email:
jeffreyn@daff.gov.za
Postal address:
PO Box 56314, Arcadia 0007, South Africa
Dates:
Received: Feb. 2012 Accepted: 09 May 2012 Published: 31 Aug. 2012
How to cite this article: Ngaka, M.J., 2012, ‘Drought preparedness, impact and response: A case of the Eastern Cape and Free State provinces of South Africa’, Jàmbá: Journal of Disaster Risk Studies 4(1),Art. #47, 10 pages.http://dx.doi. org/10.4102/jamba.v4i1.47
Drought is a major disaster in South Africa in terms of total economic loss and number of people affected. This study investigated and analysed the preparedness, impact of and response by the farming community to the 2007/2008 drought using the Eastern Cape and Free State provinces of South Africa as case studies. Both qualitative and quantitative approaches were used in this study. Primary data were collected through face-to-face interviews with sampled recipients of the 2007/2008 drought relief scheme. These were analysed using MedCalc® software and various statistical tests and correlations were performed to test for
statistical differences on key variables. Major findings of this study included inadequacy of the extension support service, particularly as a vehicle for disseminating early-warning information. The most significant impact was livestock losses, and t-test results supported the hypothesis that there was a significant difference in terms of drought impact for the three categories of farmers (i.e. small, medium and large scale), particularly with regard to the proportion of livestock lost. A Logit analysis showed that the decision to reduce livestock during drought was influenced by access to land and race. The main constraint to the drought relief scheme, as perceived by the respondents, was the turnaround time − they felt that the relief was provided long after the disaster had occurred.
© 2012. The Authors. Licensee: AOSIS OpenJournals. This work is licensed under the Creative Commons Attribution License.
Introduction
During the last decade the frequency and impact of natural disasters in the farming community in South Africa have increased significantly, and the most common type of disaster is drought. Data from the Centre for Research on the Epidemiology of Disaster (2011) show that drought is a major disaster in South Africa in terms of the number of people affected and total economic loss, whilst floods top the chart in terms of number of mortalities. People living in rural areas and resource-poor farmers are often cited as more vulnerable to the impact of drought (Akpalu 2005:58; Austin, 2008; Pelser et al. 2005:20; Benson & Clay 1994:35, 1998), and according to Austin (2008) their suffering and vulnerability are often exacerbated by a lack of progress in effective drought management. Many scholars attribute this lack of progress to the complexity and multitude of drought definitions (Wilhite & Knutson n.d.; World Meteorological Organisation n.d.; Goodrich & Ellis 2006).
About 60% of sub-Saharan Africa (SSA) is said to be vulnerable to drought, with 30% of it being estimated as highly vulnerable (International Fund for Agricultural Development 1994, cited in Benson & Clay 1998). South Africa is no exception, as it is estimated that about 65% of the country receives less than 500 mm of rain per year (Van Zyl, McKenzie & Kirsten 1996:250; Wilhite 1993a; Backeberg & Viljoen n.d.), implying that most of the farming in the Republic takes place under arid and semi-arid conditions (Wilhite 1993b). Despite this status quo, a greater concern for the farming community is the projected broad reduction of about 5% − 10% in the annual rainfall in the summer rainfall region (Department of Environmental Affairs and Tourism 2004:2).
In order to address the problem of drought in the South African agricultural sector, the government has over the past decade implemented a number of drought relief schemes as part of a national effort to assist affected farmers. This study aims to assess how the farming community prepared for, coped with and responded to the 2007/2008 drought, and investigated the impact of the drought relief scheme.
Context and justification
up to 30 LSU at a 90% subsidy rate, and medium-scale and commercial farmers enough to maintain up to 50 LSU at 80% and 70% subsidy rates respectively. In addition to fodder supply, the scheme further made provision for the repair of water infrastructure (namely desiltation of earthdams, repair of boreholes, etc.) for communal farmers or farmers sharing common property such as land (Department of Agriculture, Forestry and Fisheries [DAFF] 2007:1).
Despite the substantial government investment in disaster drought recovery measures, there is limited understanding of the impact of drought relief schemes in South Africa. This raises questions as to whether the government is providing a reasonable standard of welfare to drought-affected farmers, whilst ensuring sustainability and economic efficiency of the farming community. Moreover, on-going provision of drought assistance is proving to be costly. For instance, in 2007/2008 taxpayers in South Africa once again spent R285 million on drought relief, of which R20 million and R25 million were allocated to the Eastern Cape and Free State provinces respectively. M. Pitso (personal comm. 28 June 2011) outlined a breakdown of the 2009/2010 disaster management grant allocation, which showed that an additional R20 million for drought relief was allocated to the Eastern Cape Province at the time of undertaking this study. Despite many years of disaster relief assistance from the government, studies show a general consensus amongst analysts that drought assistance has been ineffective, poorly coordinated and untimely (Wilhite & Knutson n.d.; Austin 2008; Hobson 1994).
As a result of drought being a major limiting factor in semi-arid regions where rainfed agriculture predominates, issues relating to drought management policies and approaches have received much attention amongst researchers. In South Africa some of these studies have examined, inter alia, response scenarios of households in drought-stricken areas, government’s response to drought and drought assessment techniques (see Akpalu 2005; Du Pisani, Fouché & Venter 1998; Austin 2008; Backeberg & Viljoen n.d.). It is therefore anticipated that this study will add to a growing pool of literature on this topic, especially in the Free State and Eastern Cape provinces of South Africa where drought is becoming a permanent feature in the agricultural sector. This study contributes ’to a broader understanding of drought and to the design of more appropriate drought relief responses’ (Benson & Clay 1994).
Research hypotheses
The testable research hypotheses can be summarised as follows:
• Hypothesis 1: The impact of drought will be different amongst the farm categories (small-, medium- and large-scale farmers) under consideration; this will be tested using t-test statistics on the number of livestock lost and percentage increase in expenditure during the drought season.
• Hypothesis 2: There is a positive relationship between access to early-warning information and the drought risk reduction measure of interest (i.e. reducing the number of livestock). This hypothesis is supported by Backeberg and Viljoen (n.d.:15), who argue that provision of reliable early-warning information ’will enable farmers to correctly and timely [… plan and] adapt to expected changes in climate and weather’.
• Hypothesis 3: It is hypothesised that farmers’ resource endowments positively influence them to reduce livestock numbers during drought seasons. Farmers who have access to privately owned land and have a large number of livestock are more likely to sell some of the animals during a drought season than their counterparts in communal grazing areas. This hypothesis will be tested using a logistic regression analysis of factors influencing farmers’ decision to sell livestock.
Research objectives
The overall objective of this study is to investigate and analyse the level of preparedness, impact of and response to the 2007/2008 drought. The objective will be achieved through a set of specific objectives which includes:
• to determine the accessibility and use of early-warning information, including indigenous knowledge systems (IKS) as tools for drought disaster risk reduction
• to examine the manner in which farmers coped with the 2007/2008 drought
• to assess the impact of the drought disaster relief scheme and give policy recommendations where applicable.
Research methodology
The purpose of this section is to explain the nature of the data and methods that were used to collect and analyse it.
Sampling procedure and sample size
As a starting-point for sample selection, the study made use of the beneficiaries of the 2007/2008 drought relief scheme as a sampling frame. A sample was drawn, using a stratified random sampling procedure, from a population list of farmers who benefitted from the scheme. The reason for using the latter approach is, according to Cooper and Schindler (2001), threefold:
• to increase a sample’s statistical efficiency
• to provide adequate data for analysing the various sub-populations
• to enable different research methods and procedures to be used in different strata. (n.p.)
based on province and farmer category. After a population was divided into appropriate strata a basic random sampling method was applied to determine the appropriate sample size for each stratum, using the following formula:
[Eqn 1]
N, population size (number of farmers who benefitted from the drought relief scheme of 2007/2008); n, sample size (number of selected beneficiaries for the 2007/2008 drought relief scheme); Ni, stratum size for I = 1, 2,…; ni, stratum sample size for I = 1, 2,… (e.g. N1, small scale, N2, medium
scale).
Sample size was also dictated by research costs, and therefore whilst a resultant number of 120 farmers were sampled, owing to time and other logistical limitations only 91 (53% small-scale, 19% medium-scale and 29% large-scale farmers) were available for interviews.
Data collection methods
Both primary and secondary data were used during this study. Primary data (both qualitative and quantitative) were collected using a structured questionnaire. Face-to-face interviews were used to collect data and, in some instances, fax and telephone facilities were also used, especially where information was incomplete or inappropriately captured. Although cost-effective a postal survey was not considered because it has proved to be less successful in most studies (see Gouse 2004:4; Chisi 2007).
Study areas
Figure 1 shows a map of the Eastern Cape and Free State provinces, which were purposively selected for this study because of the frequency of drought there coupled with a relatively high number of rural populations who depend mostly on agriculture for their livelihood.
Research findings
General socio-economic characteristics of
respondents
The distribution of respondents according to various socio-economic characteristics is summarised in Table 1a. In general, the respondents were mature adults; 58% of them were above 55 years of age, with a mean age of 53.7 years. The average household had five members. There was a significant difference between household size and farm category, with small- and medium-scale farmers having on average larger households than the large-scale farmers.
Not taking into consideration communal land, the average size of the holding was 436 ha. There was a significant difference between provinces and farm category in terms of size of the holdings. The average size of the holdings in the Eastern Cape was much higher (661 ha) than that for the Free State (136 ha) and, as expected, holdings for small-, medium-
and large-scale farmers differed significantly at 18 ha, 54 ha and 1456 ha respectively. These results are not surprising, as over half (58%) of the farmers interviewed were in communal areas.
The demographic sample included 78.86% males and 13.14% females, of whom 74.81% were Black participants, 16.18% White participants and 1.1% Indian participants. An unequal distribution of gender across different farming categories was ascertained by the Chi-square test (χ2 = 6.215, degree of freedom (df) = 2, p = 0.0447), with women predominantly on smaller holdings than men. A significant number of respondents (22%) did not have a formal education, and about 10% had tertiary education. Those without any education at all were all Black farmers, and 55% of them were small-scale farmers; the Chi-square test showed a significant and statistical difference between education and respondents’ race and farm category (see Table 1b).
F = n = fi ni N Ni
Source: Adapted from Duvenhage, J., 2011,Department of Agriculture, Forestry and Fisheries, 14 June.
FIGURE 1: Location of study areas within the selected provinces.
Location of Free State and Eastern Cape provinces International boundaries Provincial boundaries Coastline District municipalities
These demographic and socio-economic characteristics are of significant importance, as they can influence households’ economic behaviour (Randela 2005:76).
Use of and access to early-warning information
Van Zyl (2006) advocated for an early-warning system that includes adequate access to and utilisation of timely, accurate, relevant and free information on the weather. In this study an investigation of access to early-warning information (EWI) was carried out, and the results are shown in Figure 2. About 70% (n = 64) of respondents had access to drought EWI. Benson and Clay (1998) argue that the weather forecast alone is insufficient and that information should be made available in a form that it will be meaningful to recipients.In order to measure the perception of farmers of EWI, they were asked questions on four key components (namely whether the information is understandable, useful, reliable and provided in a timely fashion). Figure 2 shows that a considerable number of small-scale farmers find EWI to be understandable, useful, reliable and provided in a timely fashion compared to large- and medium-scale farmers. This difference was statistically significant at the 1% level for ‘EWI is useful and understandable’ (see Table 2). As indicated in Table 1, there was a significant difference between education and farm category, with large-scale farmers having a higher educational level than small- and medium-scale farmers. In line with the assertion that people with higher educational levels interpret information better than those with less or no education (Mather & Adelzadeh 1998, cited in Jari 2009:14), it was expected that large-scale farmers’ attitude to EWI would be positive compared to small- and medium-scale farmers.
It can; however, be deduced that current methods of disseminating EWI do not meet the requirements of most medium- and large-scale farmers, as only a small proportion
TABLE 1b: Relationship between socio-economic characteristics and farm category.
Variables Chi-square (χ2) df p-value
Gender and farm category 6.215 2 0.0447*
Household size and farm category 41.049 20 0.0037*
Education and farm category 25.86 8 0.0005**
Education and race 28.625 8 0.0005**
df,degrees of freedom; p, probability.
*, Statistically significant at 5% level of significance (p < 0.05) **, Statistically significant at 1% level of significance (p < 0.01)
TABLE 1a: Socio-economic characteristics of survey respondents (N= 91).
Characteristics Sub-characteristics Eastern Cape (n = 52) Free State (n= 39) % (N = 91) Total
n %* n %* EC FS %
Age group (years) 26–35 1 2 2 5 1 2 3
36–45 7 14 8 21 8 9 17
46–55 9 17 11 28 10 12 22
> 55 35 67 18 46 38 20 58
Gender Male 45 87 33 85 49 36 86
Female 7 13 6 15 8 7 14
Education None 12 23 8 21 13 9 22
Primary 15 29 17 44 16 19 35
Secondary 19 37 11 28 21 12 33
Undergraduate 1 2 2 5 1 2 3
Postgraduate 5 10 1 3 5 1 7
Household size 1–4 18 35 17 44 20 19 39
5–8 27 52 17 44 30 19 48
> 8 7 13 5 13 8 5 13
Access to amenities School 49 94 30 77 54 33 87
Clinic 39 75 36 92 43 40 82
Electricity 49 94 28 72 54 31 85
Police station 39 75 32 82 43 35 78
Water and sanitation 33 63 27 69 36 30 66
EC, Eastern Cape; FS, Free State.
N, number.
*, Statistically significant at 5% level of significance (p < 0.05)
Based on the proportion of farmers who access EWI (n= 64). EWI, early-warning information.
FIGURE 2: Farmers’ perception of drought early-warning information. EWI is useful
Perception on drought EWI
EWI is
understandable EWI is prvided in a timely fashion
EWI is reliable Small Medium Large
Per
cen
tag
e
45
40
35
30
25
20
15
10
5
had a good perception of EWI as measured by the four components stated above. In general, the results suggest that although there has been a general improvement in scientific climate and seasonal forecasts in South Africa, many issues relating to the way the information is packaged and disseminated still remain.
Sources of
early-warning information
It is well established that provision of timely and reliable climate and seasonal forecasts is a critical component of drought planning, as it supports farmers’ decision making (Wilhite & Svoboda 2000:2; Backeberg & Viljoen, n.d.; Van Zyl 2006). Respondents were interviewed on their main sources of early-warning information (EWI), and the results are presented in Figure 3. Research results show, for example, that farmers’ main source of EWI is radio (70%) and television (66%). A negligible percentage of this group accessed EWI through extension services (11%) and other sources such as the Internet (9%). These results are consistent with the findings of Akpalu (2005:1), namely that extension services were inadequate in the areas considered in their studies.
Despite the fact that further information is sent to provincial Departments of Agriculture for dissemination to the farming community, these results are not surprising, especially for the Eastern Cape Province which has one of the country’s highest ratios of extension services to farmers which is 1:1079. The Free State, on the other hand, has a ratio that is within the norms and standards for extension and advisory services in the South African agriculture sector of 1:399 (DAFF 2005:11, 2009a). The unpopularity of extension services in disseminating EWI may be attributed to the fact that they are not part of the Agricultural Disaster Management Unit within the provincial Departments of Agriculture, and therefore are not obliged to render such services.
Indigenous Knowledge Systems
for drought risk
reduction
Indigenous Knowledge Systems (IKS) are increasingly regarded as an essential element of drought disaster risk reduction. However, as Pelser et al. (2005:17) point out, most studies do not report actual examples of strategies. In this study respondents were asked if they know about and use any IKS. IKS strategies were grouped and put into four categories: assess size and shape of the moon; monitor the behaviour of birds; monitor the behaviour of animals or reptiles; and monitor daily weather patterns (Table 3). This is, to the knowledge of the author, the first attempt of documenting IKS used for forecasting drought in South Africa. Results show that about 71% (n= 65) of respondents stated that they know about and use IKS. The widely known strategy for indigenous drought EWI is assessment of the size and shape of the moon (49%) followed by monitoring birds’ behaviour (32%).
There was no significant difference in terms of use of IKS by farm category, province and gender (see Table 4). This is an important finding, particularly in light of the growing call
TABLE 3: Examples of indigenous knowledge systems known to participants to relate to drought forecasting.
Indigenous Knowledge Systemstypes Participants†
n %‡
Assess size and shape of the moon 32 49
Concave moon is associated with more rain -
-Convex moon signifies less rain -
-Full moon is associated with more rain -
-Monitor the behavior of birds 21 32
Blue cranes flying very high signifies more rain -
-Birds nesting high signifies more rain -
-Birds nesting low signifies less rain -
-Monitor the behavior of animals or reptiles 11 17 Livestock galloping or rams excited (jumping)
signifies rain -
-Abundance of black snakes is associated with rain -
-Monitor daily weather patterns 9 14
Strong wind from west is associated with less rain -
-Strong wind from east is associated with more rain -
-Late rain is often associated with less rain -
-†,Total participants of the study who responded ‘yes’ to whether they use the indigenous knowledge systems (IKS) equals 65.
‡, Effective percentage based on the number of farmers who responded ‘yes’ to whether they use the indigenous knowledge systems (IKS) type.
Values represent an effective percentage based on the number of farmers who receive EWI (n = 64).
EWI, early-warning information.
FIGURE 3: Main sources of early-warning information by farm type.
TABLE 2: Relationship between farm category and farmers’ perception of early-warning information.
Variables Chi-square (χ2) df p-value
Farm category and EWI useful 12.723 4 0.0127*
Farm category and EWI
understandable 12.850 4 0.0120*
Farm category and EWI provided
in a timely fashion 8.958 6 0.1760
Farm category and EWI reliable 0.734 3 0.8652
EWI, early-warning information;df, degrees of freedom; p-value, probability-value. *, Statistically significant at 1% level of significance (p < 0.01)
Small scale
Main sources of EWI
Medium scale Large scale Total
Per
cen
tag
e
100
90
80
70
60
50
40
30
20
10
0
for adoption and use of IKS. It should be noted that some of the techniques are still vague, particularly category 1. For instance, the moon will at some point become full, convex or concave, and therefore the timing thereof still needs to be clarified. Furthermore, it is worth mentioning that although some of the farmers said that they know IKS, they were very sceptical about their relevance and applicability. As one farmer stated: ’I know about them [IKS] but am not sure if they are still applicable’.
Impact of the 2007/2008 drought disaster on
the farming community
An attempt was made to assess the impact of the 2007/2008 drought on the farming community. The study did not establish any abandonment of the farming enterprise as a result of drought impact. However, the effects outlined below were reported by respondents.
Livestock losses
Livestock mortality was found to be one of the most serious effects of the 2007/2008 drought. A quantitative assessment of stock losses is depicted in Table 5, which clearly shows that the average percentage stock losses were higher for
small-scale and medium-scale farmers than for large-scale farmers. This can be attributed to the number of livestock owned by these farmers. For instance, if a small-scale farmer owned 6 and lost 3 animals as a result of drought, it implies that he or she lost 50% of their livestock. Furthermore, there were variations in the number of livestock lost amongst the different farming categories. The average number of livestock lost ranged from 1.2 to 14.6 for small- scale and large-scale farmers respectively. This difference was statistically significant (p = 0.008) when small and medium were compared with large scale farmers (see Table 6).
Statistical analysis showed no significant difference in the number of livestock lost between the provinces (p-value = 0.98 > 0.05). In addition to this, a person correlation coefficient was conducted to assess the relationship between the number of livestock lost and livestock sold. The results showed a positive, although not so strong, correlation between the two variables (r= 0.4324,n= 91,p= 0.0001). These results suggest that most farmers who sold their livestock to cope with the drought did so presumably after they had already suffered losses in terms of livestock mortalities.
Production expenditure
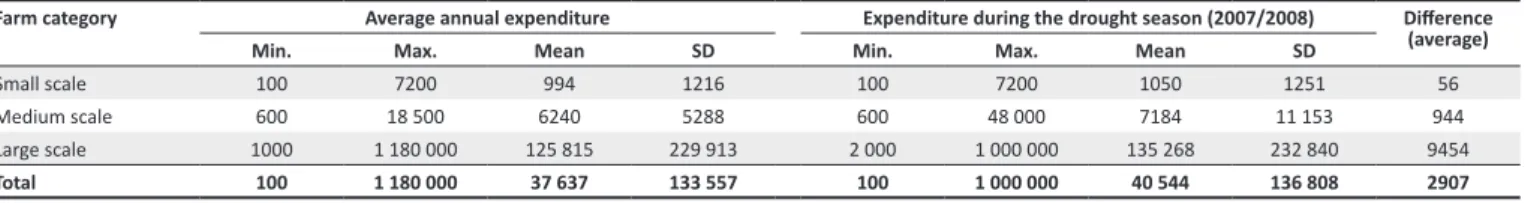
In order to assess how drought impacted on cost structure, respondents were asked to report on the three-year average annual costs as well as the costs during the 2007/2008 season, and results are summarised in Table 7. Although the difference was not statistically significant, the results show that large-scale farmers spent an additional R9454 during a drought season compared to R56 and R944 for small- and medium-scale farmers respectively. A comparison of average costs and those during the 2007/2008 season showed an increase in total expenditure of 25% for small- and medium-scale farmers combined and 22% for large-scale farmers (see Table 8).
Other effects
One of the effects of drought is that it resulted in a number of farmers (10%) moving their livestock to other camps with favourable grazing conditions. Movement of livestock per se cannot result in devastating effects, except for the cost of transportation and, in exceptional cases, physical injury and stress-induced abortions.
Drought also resulted in a reduced calving rate, reduced income as a result of increased expenditure, and low prices received on livestock (mean = R1804, SD = R1652) sold during drought years.
TABLE 4: Relationship between indigenous knowledge systems and farm category, province, gender and race.
Variables Chi-square (χ2) df p−value
IKS and farm category 3.368 2 0.1857
IKS and province 0.028 1 0.8670
IKS and gender 0.020 1 0.8870
IKS and race 7.236 2 0.0268*
IKS, indigenous knowledge systems, df, degrees of freedom; p probability. *, Statistically significant at 5% level of significance (p < 0.05)
TABLE 5: Number of livestock mortalities owing to drought by farm category in 2007/2008.
Farm category Livestock mortalities Mean SD Average (%) Min. Max.
Small scale 14 0 6.8 1.2 1.6
Medium scale 18 0 37 7.7 8.7
Large scale 6 0 72 14.6 20.7
Average (%) 13 0 72 6.2 12.9
Min., minimum; Max., maximum; SD, standard deviation.
Converted to Large Stock Unit (LSU), t-test percentage loss and province (p-value = 0.98).
TABLE 6: Comparison between livestock lost amongst the different scale farmers.
Farm catergory Livestock mortalities*
N Mean SD
Small and medium scale 65 0.15 0.21
Large scale 26 0.06 0.09
N, number; SD, standard deviation. *, p-value 0.008
TABLE 7: Comparison of farm expenditure (nominal) during drought season and difference from a 2-year average using 2005/2006 and 2006/2007 as baseline.
Farm category Average annual expenditure Expenditure during the drought season (2007/2008) Difference (average)
Min. Max. Mean SD Min. Max. Mean SD
Small scale 100 7200 994 1216 100 7200 1050 1251 56
Medium scale 600 18 500 6240 5288 600 48 000 7184 11 153 944
Large scale 1000 1 180 000 125 815 229 913 2 000 1 000 000 135 268 232 840 9454
Total 100 1 180 000 37 637 133 557 100 1 000 000 40 544 136 808 2907
Farming community preparedness and coping
strategies for drought
Coping strategies used
In the mid−1990s researchers (see Vogel 1995, as cited in Austin 2008) raised concern over a lack of detailed assessment of how people responded to and coped with periods of environmental stress. It is against this background that this study attempted to assess ways in which farmers prepared for and responded to the devastating drought conditions (see Table 9).
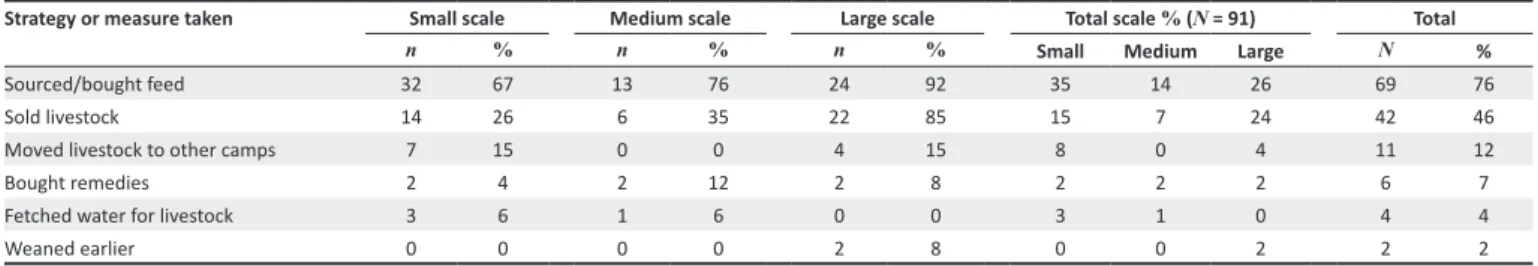
Research findings (see Table 9) show that a significant proportion (76%) of farmers bought or sourced livestock feed as a way of coping with drought. This suggests that the majority of farmers were willing to pay for livestock feed in order to maintain a nucleus herd of cattle. The table further shows that only 46% of respondents indicated that they had sold their livestock as a measure to cope with the devastating drought conditions. Inevitable selling of livestock tends to be a drastic measure for the emerging farming sector, as only 26% and 35% of small- and medium-scale farmers respectively sold livestock as a measure to alleviate the impact of a drought disaster, compared to 85% of large-scale farmers. These results were not surprising and echo the findings of Randela (2000), who found that livestock are kept for various reasons, including social, cultural and financial. Often farmers will sell their livestock whilst they are in poor condition, thereby deviating from the purchasing-power rationale because the value would have depreciated and there is therefore no economic rationale for it.
Other negligible coping strategies included movement of livestock to better grazing camps (11%), purchasing of remedies, particularly vitamin A supplements (5%), fetching livestock water (4%), and weaning calves earlier than expected (2%).
Factors influencing farmers’ decision to keep or sell
livestock
A study by De Haan et al. (1997), as cited in Morton and Barton (2002:215), asserts that progressive reduction of
livestock on the farm is one of the key strategies of reducing the potential impact of drought. As described in detail in the methodology section, a Logit regression analysis was carried out to examine factors influencing farmers’ decisions to sell livestock, and results are presented in Table 10a. This table clearly shows that only two of the 10 variables used in the model were statistically significant at the 5% level.
The coefficient on the farmsize variable is positive and statistically significant at p < 0.05 level. This implied that individuals or households on private land tenure arrangements were more likely to sell livestock than their counterparts on communal farms or commonages (ceteris paribus). This was in line with an a priori expectation, where private ownership of land was expected to positively influence selling of livestock.
A positive and significant relationship (p = 0.0120) was found between selling of livestock and race, with White farmers more likely to sell livestock than other racial groups. A higher odds ratio (28.1716) shows a higher probability of variable influence on the choice whether to sell or keep livestock during a drought season. The overall model is significant at the 1% level according to the Chi-square statistic χ2 = 35.576,
df = 10,p = 0.0001 (see Table 10b).
Drought relief scheme 2007/2008
Impact of drought relief scheme 2007/2008
An empirical quantitative analysis of the impact of drought relief schemes could not be performed because of limited data. Consequently, the study focused on the qualitative analysis based on face-to-face interviews with respondents.As indicated earlier, a significant proportion of respondents (76%) purchased fodder as a way of coping with drought. This contributed significantly to increased expenditure for the farming community. Introduction of the drought relief scheme made access to fodder easier and at an affordable price. About 35% (n= 32) of the participants indicated that their incomes have improved as a result of the scheme.
Not all participants provided evidence but held a strong view that implementation of the scheme improved the calving rate. The projects further contributed to creation of employment opportunities, particularly in Free State Province where about 500 unemployed people were hired on a contract basis to load and offload livestock feed (DAFF 2009b).
TABLE 8: Comparison between change in expenditure amongst the different scale farmers.
Farm catergory Change in expenditure*
N Mean SD
Small and medium scale 65 0.25 0.95
Large scale 26 0.22 1.01
N, number; SD, standard deviation. *, p-value is 0.894
TABLE 9: Strategies or measures used by farmers to cope with drought.
Strategy or measure taken Small scale Medium scale Large scale Total scale % (N = 91) Total
n % n % n % Small Medium Large N %
Sourced/bought feed 32 67 13 76 24 92 35 14 26 69 76
Sold livestock 14 26 6 35 22 85 15 7 24 42 46
Moved livestock to other camps 7 15 0 0 4 15 8 0 4 11 12
Bought remedies 2 4 2 12 2 8 2 2 2 6 7
Fetched water for livestock 3 6 1 6 0 0 3 1 0 4 4
Weaned earlier 0 0 0 0 2 8 0 0 2 2 2
However, the scheme only addressed the immediate needs of the farming community, therefore impacting less on the community’s resilience to future droughts. In the long run this will increase the dependency of the farming community on government hand-outs and lead to unsustainable farming practices. This sentiment was echoed by one farmer, who was quoted as saying ’Although I like freebies, the government should teach us how to fish instead of fishing for us’. Overcoming this will require a comprehensive and needs-directed policy approach aimed at improving the resilience of the farming community whilst at the same time encouraging sustainable management of the natural resources.
Perceived constraints to disaster relief scheme
implementation
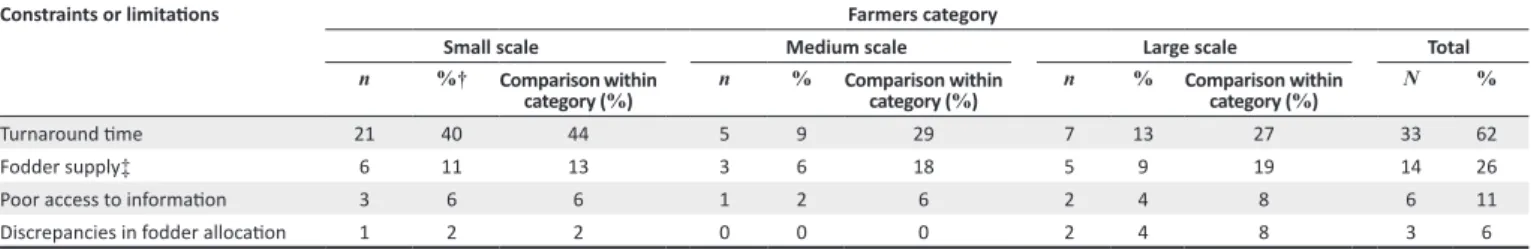
Relief assistance should be prompt and readily available during cases of severe drought (Van Zyl 2006). However, some constraints in the process of responding to drought as perceived by the farming community have been presented in Table 11. Respondents were asked what they thought were the main constraints to disaster relief scheme implementation. Altogether, 58% (n = 53) of the 91 interviewed farmers expressed some dissatisfaction with the manner in which the scheme was implemented.
The analysis (Table 12) revealed that the sequential process of applying for the drought relief scheme (turnaround time) and fodder supply logistics (availability, transportation and
storage of feed) were identified by 62% and 26% respectively as the main constraints to scheme implementation. Other constraints included access to information (11%) and discrepancy in fodder supply even within the province (6%). Chi-square testing (Table 13) showed no significant difference between farmers’ level of satisfaction and province, gender, farm category or race.
The problem of turnaround time can be attributed to the fact that the Public Financial Management Act (Act No. 1 of 1999) does not make provision for organs of state to budget for disasters logically because of the opportunity costs of the funds earmarked for a disaster which might or might not happen. Contrary to this, under sub-section 25(1)(vi) of the Disaster Management Act (Act No. 57 of 2002) calls for national organs of state to develop contingency strategies and emergency procedures, including measures to finance these strategies in the event of a disaster. As the drought management plan is still in the development stages, it implies that during cases of severe drought funds will be requested from the National Treasury, which makes allocations through either the Division of Revenue Act or Appropriation Act. The timing of government budget cycles therefore plays a major role in terms of disaster relief turnaround time. If requests are submitted late (once budgets have been drawn up), then they are usually processed during the following financial year which, in terms of drought, might coincide with a year of excessive rain thereby rendering drought relief ineffective and unnecessary.
Discrepancies in fodder allocation and other logistics relating to fodder may be attributed to customisation of the nationally developed standard operating procedures to meet local needs. Lack of information can lead to a number of deserving potential recipients being excluded from the scheme.
Discussion
The research described here concerns evaluation of the impact of drought relief schemes in South Africa, using the Free State and Eastern Cape provinces as case studies.
The study found that a considerable number of small-scale farmers regard EWI to be understandable, useful, reliable and provided in a timely fashion compared to large- and medium-scale farmers. Despite the negative perception of large-scale farmers, an assessment of drought impact showed that these farmers were least affected in terms of number of livestock lost and increase in expenditure, compared to small- and medium-scale farmers.
A wide range of coping strategies was used by farmers in the study areas. Purchasing fodder in order to maintain a nucleus TABLE 10b: Overall Model Fit of logistic regression results.
Indicator Result
Chi-square 35.576
df 10
Significance level P = 0.0001
df,degrees of freedom; P, probability value.
TABLE 10a: Logistic regression results.
Variable Coefficient SE Significant (P) Odds ratio
Age 0.00007946 1.5577 1 1.001
Household size -12086 1.483 0.4151 0.2986
Farm size 1.4671 0.7678 0.0560 0.2306
Total number of livestock 1.4494 0.7808 0.0634 4.2607
Access to early warning
information 0.6426 0.614 0.2953 1.9013
Attendance of disaster
awareness campaigns -1.0972 0.6795 0.1063 0.3338
Purchase fodder 1.1172 0.7104 0.1158 3.0564
Gender of household Head 0.1318 0.8721 0.8798 1.1409
Highest level of education for
Household Head -0.425 0.6705 0.5262 0.6538
Race 3.3383 1.3283 0.0120 28.1716
Constant -0.01535 - -
-The dependent variable equals livestocked. SE, standard error; P, probability value.
TABLE 11: Number of satisfied and unsatisfied farmers per farm category, province, gender and race (N = 91).
Variables Farm Category Province Gender Race
Small Medium Large EC FS Male Female Black White Indian
Satisfied with scheme 18 8 12 22 16 35 3 29 9 0
Not satisfied with scheme 30 9 14 30 23 43 10 45 7 1
Total 48 17 26 52 39 78 13 74 16 1
N = 91.
herd of cattle and reducing livestock numbers were the two main strategies used. Furthermore, a logistic regression model showed a positive and significant relationship between race and livestock reduction as a drought mitigation strategy. This implied that White farmers were more likely to sell livestock than their Black counterparts. It can therefore be concluded that greater awareness is needed to sensitise and encourage Black emerging farmers in particular to actively engage in drought risk reduction measures.
Respondents in this study acknowledged that there are still some constraints in the implementation of drought relief schemes in South Africa, particularly regarding turnaround time. Furthermore, assessment indicated that the 2007/2008 scheme focused on the immediate impact of drought and did very little to reduce the vulnerability of the farming community to the next drought. These findings suggest that the long-lasting impact of schemes remains an on-going task that needs the cooperation of all relevant stakeholders, particularly in ensuring that medium- and long-term measures are addressed, thereby reducing the vulnerability of farming communities. It is argued in this study that to achieve this will require a comprehensive and needs-directed policy approach aimed at improving the resilience of the farming community whilst at the same time encouraging sustainable management of natural resources.
Revisiting the hypotheses
In the study it was hypothesised that drought impact differed amongst the three categories of farmers. The results confirm this to be true for some of the variables, as indeed there was a significant difference between commercial and emerging (small- and medium-scale) farmers (p = 0.008) in terms of livestock lost. There was, however, no statistical difference between the proportion spent during drought and non-drought years for the above groups (p= 0.894).
Another hypothesis was that there is a positive relationship between access to EWI and drought risk reduction measures using livestock reduction as a proxy. However, no significant relationship was found in this study (p = 0.2953). A central finding of this study is that although access to EWI amongst the respondents was high, most of them did not value it as they perceived it to be unreliable and not provided in a timely fashion. This suggests that access to EWI alone is not enough to influence farmers to adopt drought risk reduction, as it can also be influenced by the perception they have of the information provided to them. Based on these arguments, the study does not overrule the assertion that access to EWI that
is provided in a timely fashion, is reliable and understandable is crucial in drought risk reduction.
Access to land (private ownership) and number of livestock owned by a farmer were used as proxies for farmers’ resource endowment. The former was significantly and positively related to farmers’ decision to reduce livestock, implying that farmers in communal settings were more reluctant to reduce livestock numbers during a drought.
Recommendations
The following key recommendations are made:
• Provision of financial assistance to address long-term developmental needs (such as investment in water infrastructure and water-harvesting techniques) of the farming community, thereby improving their resilience, may prove more beneficial in the long run than short-term drought relief assistance in the form of fodder supply. • A significant and sustained attempt should be undertaken
by government to ensure that an extension service becomes an integral part of disaster risk management at both provincial and local level.
• In order to protect the natural resource base and encourage sustainable and good farming practices, policies on drought management should emphasise and enforce adherence to stocking rates, particularly for private tenure farmers.
• There is a need to develop and maintain a systematic approach to collecting data on drought (and other hazards) at all levels of government (national, provincial and local). This will be helpful in understanding drought risk and conducting drought disaster impact assessments to inform policy making.
• Government should prioritise gazetting of the draft Drought Management Plan and implementing the long-overdue measures to enhance the resilience of the farming community to drought.
TABLE 12: Farmers’ perceptions of constraints to drought relief scheme implementation.
Constraints or limitations Farmers category
Small scale Medium scale Large scale Total
n %† Comparison within
category (%) n % Comparison within category (%) n % Comparison within category (%) N %
Turnaround time 21 40 44 5 9 29 7 13 27 33 62
Fodder supply‡ 6 11 13 3 6 18 5 9 19 14 26
Poor access to information 3 6 6 1 2 6 2 4 8 6 11
Discrepancies in fodder allocation 1 2 2 0 0 0 2 4 8 3 6
N = 53.
†, effective percentage based on number of dissatisfied recipients. ‡, availability, transportation and storage.
TABLE 13: Relationship between farmers’ perceived satisfaction with drought relief scheme and farm category, province, gender and race.
Variables Chi-square (χ2) df p-value
Farmers’ perceived satisfaction
and farm category 0.761 2 0.6836
Farmers’ perceived satisfaction
and province 0.008 1 0.9267
Farmers’ perceived satisfaction
and gender 1.372 1 0.2414
Farmers’ perceived satisfaction
and race 2.299 2 0.3167
df,degrees of freedom;p-value,probability.
Study limitations and future research
The lack of record-keeping, especially amongst smallholder farmers, was a major concern as most could not remember exact numbers (for instance, the number of livestock they had before and during implementation of the scheme, the value of assistance received and their own contribution, etc.). Interviewing only beneficiaries of the scheme implied that crucial information was overlooked, such as how non-participants in the scheme coped with drought disasters; reasons for non-participation, etcetera, and such information could be helpful in improving implementation of future schemes. Furthermore, the inclusion of extension officers, disaster risk reduction coordinators and fodder suppliers could have given a more comprehensive view of the 2007/2008 drought.
As a result of drought being a recurrent feature in South Africa’s climate, there is still a need to explore IKS and ways in which these can be incorporated in a drought management plan and policies. Secondly, there is a need to explore the role of social capital in farming communities with regard to drought risk reduction. Lastly, future research should also address the indirect and secondary impact of drought on the broader macro-economy.
Acknowledgements
The Department of Agriculture, Forestry and Fisheries (South Africa) and the African Land and Food Fellowship are acknowledged for their financial assistance. I thank Rebecca Atai for her assistance in editing the initial draft of the manuscript. My appreciation goes to Agricultural Disaster Management coordinators and farmers in the two provinces for their cooperation during the study. I fully acknowledge and appreciate the efforts of Mr Johan Duvenhage, who assisted with development of the GIS map showing the study areas. I am grateful to Ms Siphokazi Mntusanto, Mr Ntuli, Ms Annalie Marais and Ms Puleng Madigetla, who assisted with data collection. Finally, I would gratefully like to acknowledge the expert guidance, time and help of Dr John Conway and Mr John Nixon.
Competing interest
The author declares that he has no financial or personal relationship(s) which may have inappropriately influenced him in writing this article.
References
Akpalu, D.A., 2005, ‘Response scenarios of households to drought-driven food shortage in a semi-arid area in South Africa’, MA thesis, University of the Witwatersrand, Johannesburg.
Austin, W.D., 2008, ‘Drought in South Africa: Lessons lost and/or learnt from 1990 to 2005’, MSc dissertation (Unpublished), Faculty of Science, University of Witwatersrand, Johannesburg, viewed 13 February 2011, from http:// wiredspace.wits.ac.za/bitstream/handle/10539/5991/MSc%20WD%20AUSTIN. pdf?sequence=1
Backeberg, G.R. & Viljoen M.F., (n.d.), ‘Drought Management in South Africa’, Water Research Commission, Pretoria, viewed 01 March 2011, from http://www.irncid. org/workshop/pdf/w22/Backeberg.pdf
Benson, C. & Clay, E., 1994, ‘The Impact of drought on Sub-Saharan African economies: A preliminary examination’, Overseas Development Institute Working Paper No. 77, viewed 28 June 2011, from http://www.odi.org.uk/resources/ download/5603.pdf
Benson, C. & Clay, E., 1998, ‘The Impact of drought on Sub-Saharan African economies: A preliminary examination’, World Bank Technical Paper No. 401, World Bank, Washington, D.C.
Chisi, M., 2007, ‘Impact assessment of sorghum research in Zambia’, in P. Anandajayasekeram, P., Rukuni, M., Babu, S., Liebenberg, F. & C.L. Keswani
(eds.), Impact of science on African agriculture and food security, pp.
137−146, International Livestock Research Institute, Wallingford, Oxfordshire. Cooper, D.R. & Schindler, P.S., 2001, Business Research Methods, 7th edn.,
Mcgraw-Hill, Boston.
‘Centre for Research on the Epidemiology of Disaster, 2011’, South Africa Country Profile − Natural Disasters, OFDA/CRED International Disaster Database, Université Catholique de Louvain, Brussels, Belgium, viewed 14 June 2006, from http://www.emdat.be
Department of Agriculture, Forestry and Fisheries, 2005, ‘Norms and Standards for extension and advisory services in agriculture’, Directorate Agricultural Information Services, Pretoria.
Department of Agriculture, Forestry and Fisheries, 2007, ‘Framework to manage the implementation of drought relief scheme 2007/2008’, Directorate Agricultural Disaster Management, Pretoria.
Department of Agriculture, Forestry and Fisheries, 2009a, ‘Report on the profiling of the current government-employed extension and advisory service officers 2007’, Directorate Agricultural Information Services, Pretoria.
Department of Agriculture, Forestry and Fisheries, 2009b, ‘Directorate Agricultural Disaster Management handover report (2004−2009)’, Dept. of Agriculture, Forestry and Fisheries, Pretoria.
De Haan, C., Steinfeld, H. & Blackburn, H., 1997, Livestock and the environment: Finding a balance, European Commission Directorate-General for Development, Brussels.
Department of Environmental Affairs and Tourism, 2004, National Climate Change Response Strategy, viewed 07 April 2011, from http://unfccc.int/files/meetings/ seminar/application/pdf/sem_sup3_south_africa.pdf
Du Pisani, L.G., Fouché, H.J. & Venter, J.C., 1998, ‘Assessing Rangeland Drought in
South Africa’, Agricultural Systems 57(3), 367−380. http://dx.doi.org/10.1016/
S0308-521X(98)00024-9
Duvenhage, J., 2011,Department of Agriculture, Forestry and Fisheries.
Goodrich, G.B. & A.W., Ellis, 2006, ‘Climatological drought in Arizona: An analysis of indicators for guiding the governor’s drought task force’, Professional Geographer 58(4), 460−469. http://dx.doi.org/10.1111/j.1467-9272.2006.00582.x
Gouse, M., 2004, ‘The economic impact of genetically modified (GM) crops in South Africa’, MSc thesis, Dept. of Agricultural Economics, University of Pretoria, South Africa.
Hobson, S.D., 1994, ‘Vulnerability, Food Security and appropriate interventions’, MSc thesis, Dept. of Agricultural Economics, University of Pretoria, South Africa. Jari, B., 2009, ‘Institutional and technical factors influencing agricultural marketing
channel choices amongst smallholder and emerging farmers in the Kat River’, MSc Agricultural Economics thesis, University of Fort Hare, South Africa.
Morton, J. & Barton, D., 2002, ‘Destocking as a drought-mitigation strategy: Clarifying
rationales and answering critiques’, Disasters 26(3), 213−238. http://dx.doi.
org/10.1111/1467-7717.00201
Pelser, A.J., Redelinghuys, N., Viljoen, M.F., & Teweldemehin, M.Y., 2005, Policy Guidelines for the evaluation of social, economic and political impacts of drought and aridity, University of Free State, Bloemfontein, South Africa.
Randela, R., 2000, ‘Socio−economic impact analysis of livestock disease control programmes with special reference to ticks and tick-borne diseases’, MSc Agricultural Economics thesis, Dept. of Agricultural Economics, University of Pretoria, South Africa.
Randela, R., 2005, ‘Integration of emerging cotton farmers into the commercial agricultural economy’, PhD thesis, Dept. of Agricultural Economics, University of Free State, Bloemfontein, South Africa.
Republic of South Africa, 1999, Public Finance Management Act, Act no 1 of 1999, viewed 25 July 2011, from http://www.treasury.gov.za/legislation/pfma/act.pdf Van Zyl, J., McKenzie, C., & Kirsten, J., 1996, ‘Natural resource management issues in
rural South Africa’, in J. Van Zyl, J.F. Kirsten & H.P. Binswanger (eds.), Agricultural Land Reform in South Africa: Policies, Markets and Mechanisms, pp. 236−259, Oxford University Press, Cape Town.
Van Zyl, K., 2006, A study on a Disaster Risk Management Plan for the South African Agricultural Sector, viewed 29 June 2011, from http://www.agrisa.co.za/ Dokumente/Risk%20Management%20Plan.pdf
Wilhite, D.A., 1993a, ‘The Enigma of Drought’, in D.A. Wilhite (ed.), Drought
assessment, management, and planning: Theory and case studies, pp. 3−15, Kluwer Academic publishers, Boston. http://dx.doi.org/10.1007/978-1-4615-3224-8_1
Wilhite, D.A., 1993b, ‘Planning for drought’, in D.A. Wilhite (ed.), Drought assessment,
management and planning: Theory and case studies, pp. 87−108, Kluwer
Academic Publishers, Boston. http://dx.doi.org/10.1007/978-1-4615-3224-8_6 Wilhite, D.A. & Svoboda, M.D., 2000, ‘Drought early warning system in the context
of drought preparedness and mitigation’, in D.A. Wilhite, M.V.K. Sivakumar & D.A. Wood (eds.), Early Warning Systems in drought preparedness and drought management, Proceedings of an Expert Group meeting, Lisbon, Portugal, 05−07September, pp. 1−21, viewed 15 January 2011, from http://www.drought. unl.edu/monitor/EWS/ch1_Wilhite.pdf
Wilhite, D.A. & Knutson C.L. (n.d.), Drought management planning: Conditions for success − Options Mediterraneennes, Series A, No. 80, viewed 03 March 2011, from http://www.slideshare.net/Nostrad/drought-management-planning-conditions-for-success