RECOGNITION AND STATISTICAL SIZE DISTRIBUTION OF
MICRO-DOMAINS IN TEM-IMAGES OF POLYIMIDE FILMS DURING THEIR
PROCESSING
S
ERGEIB
RONNIKOVANDT
ATIANAS
UKHANOVAInstitute of Macromolecular Compounds, Russian Academy of Science, Bolshoi Prospekt 31, 199004 St. Petersburg, Russia
e-mail: [email protected] (Accepted...)
ABSTRACT
The surface morphology of polyamic acid films evolving under heating towards polyimide films is investigated with transmission electron microscopy. Micro-domains observed at the surface of the films are treated statistically and shown to form optimized statistical ensemble(s). The statistical size distribution of the micro-domains is described with the model of reversible aggregation. The distribution parameters, namely the aggregation energy and the mean diameter of micro-domains, are shown to depend on the chemical structure of the polymer and the heating temperature.
Keywords: micro-domains, model of reversible aggregation, polyimide films, statistical analysis, TEM-images.
INTRODUCTION
Thermal stability is an important property of polymeric materials. Aromatic polyimides (PI) show an excellent thermal stability, good mechanical properties, a high chemical resistance, and a low electric conductivity. In this respect, they are widely used in technical applications as thermally stable insulators, surface coverage, fibers, etc. (Bessonov et al., 1987). PI materials are usually produced through a twofold procedure. First, the synthesis of the precursor, a polyamic acid (PAA) dissolved in a polar solvents; second, the conversion (imidization) of PAA to PI. The latter step may be expressed as:
The morphology of PAA films all along their conversion to PI has been thoroughly studied with transmission electron microscopy (TEM) (Bessonov et al., 1987). Yet, to the authors’ knowledge, the statistical analysis of micro-domain ensembles has still not been carried out. The latter issue is addressed in this paper towards revealing new aspects of imidization.
The goals of the communication are: i) the identification and statistical analysis of micro-domain ensembles at the surface of PAA films during their conversion to PI under heating, ii) the subsequent description of the micro-domain statistical size distributions with the model of reversible aggregation, and iii) the analysis of the distribution parameters as a function of the heating temperature.
HOOC
HNOC CONH
COOH 2
N OC OC
CO CO N
n n
-2nH Q
R Q R
O
PAA PI
where Q and R are radicals.
Imidization has been investigated with different methods. It is known to happen along with such
EXPERIMENTAL PROCEDURE
onto a glass substrate, and dried in air for two days. Then the films were heated up to a chosen temperature (maximum: 420 °C) at a rate of 2°/min in an inert medium (nitrogen) to produce PI through the following reactions:
in the TEM-images of replica. The thicker carbon layer of the replicas was prepared by high vacuum evaporation from a carbon arc on the surfaces. The Pt/C replicas were then exfoliated from the etched surface of films with an aqueous solution
HOOC
HNOC CONH
COOH
2O
N OC
OC
CO
CO N
n n
-2nH
PAA DPP PI DPP
HOOC
HNOC CONH
COOH
CH2
2O
N OC OC
CO
CO N
CH2
n n
-2nH
PAA PMF PI PMF
Once removed from the substrate, the films showed many defects, probably due to mechanic distortion. Film surfaces turned out to be also polluted, so that the super-molecular (micro-domain) structure could not be identified in the TEM-images. To access by TEM the micro-domain structure of interest, the defective components had to be removed. In this respect, the surface of the samples was etched by submitting it to high frequency discharge plasma in the way and with a device similar to Neppert et al., (1983). The etching time varied from 15 min (PAA films) to 60 min (PI films heated above 300°C). During exposure, the surface temperature did not exceed 50°C. In such operational conditions, imidization could not be (re)-activated and sputtering was accordingly not observed. Of course, one must accept that the resulting micro-domain structure may not be exactly identical to the original one. Yet, even in this case, any deviations should be small as ensured by the very soft conditions of the treatment (Neppert et al., 1983). As far as the etched films were too thick to be investigated directly with TEM, they were immediately replicated, after shadowing first with a very thin platinum (Pt) layer at an angle of 30°. The diameter of platinum grains being smaller than 1 nm, we were able to identify even very small micro-domain
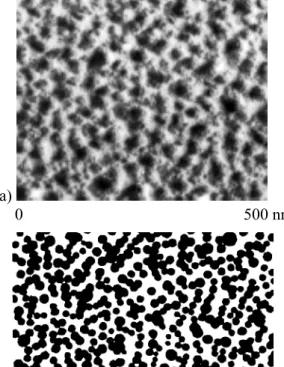
of polyacrylic acid (PAA) and cut away after drying using a razor blade. The replicas were placed in distilled water during about 2 h to remove the PAA Finally, Pt/C replicas in the form of 30-40 nm thick films were ultimately adsorbed on the copper grids, and were afterwards investigated with a Tesla BS-500 transmission electron microscope at magnifications 2×10⁴–4×10⁴. One example TEM-image of the surface of an etched and replicated sample is provided in Fig. 1a. The surface consists of micro-domains (super molecular entities) of varying size and creating a positive relief at the film surface.
a)
0 500 nm
b)
0 500 nm
Fig. 1.(a)grey level TEM-image (Sample: PAA DPP) showing micro-domains distributed at the film surface. Here the protocol discussed in section Experimental Procedure enhanced the (height-) contrast between the micro-domains of interest (dark greys) and their complement (inter-domain regions) (b) Binarized counterpart for digital analysis where the circular micro-domains in Fig. 1a (dark grey levels) are expressed in black.
MODEL
Micro-domains observed at the surface of PAA films all along their conversion (under heating) to PI were analysed with the model of reversible aggregation (Kilian et al., 1997; 2001; Köpf and Kilian, 1999). This model describes stationary ensemble properties whose characteristics are evaluated. The basic assumption of the model is that stationary structures are generated by the aggregation of identical units in metastable clusters called aggregates. Aggregates behave as a
∆u= y u∆ 0, (1)
where ∆u0 [J], the standard aggregation energy per
elementary identical unit, is supposed to be constant in all aggregates, independently of their size. ∆u being commensurable with kT (k [J.K-1] is the Boltzmann
constant and T [K] is the absolute temperature), the formation and the decomposition (reversible aggregation) of metastable aggregates are thermally activated. By analogy with many simultaneous and reversible linear chemical reactions, the thermodynamic interpretation of the reaction constant indicates that aggregation is controlled by the standard aggregation energy ∆u0. The dimensionless
fraction number n(y) of aggregates with y unit-to-unit contacts can be expressed as (Kilian et al., 1997, 2001; Köpf and Kilian, 1999):
( )
n y
ay
y u
kT
p
=
−
exp
∆
0 , (2)where a is a normalizing factor, and p defines the class of the aggregate ensemble with respect to the dimension D of the space where the aggregation occurs (D = p +1). Under our hypothesis, the size (area) of an aggregate and the number of unit-to-unit contacts y are intimately related (proportional). For this reason, y will represent from now on the area of an aggregate and will be expressed in [nm2]; ∆u
0 will
carry accordingly further on the dimension [J.nm-2].
Multiplying the fraction number (Eq. 2) by y [nm2]
yields the size distribution of the aggregates h(y):
(
)
− ∆
− −
=
− +
kT u y y y
y a y y
h p 1 0 0
0 0
) (
exp )
( , (3)
where a, a normalizing factor, is now expressed in [nm-4]. Note that the minimum (embryonic) aggregate size y0 [nm2] has been introduced. Eq. 3 may be
interpreted as the probability density of a thermodynamic phase, i.e., a canonical Gibbs distribution (Lavenda, 1991).
EXPERIMENTAL DATA AND THEIR
INTERPRETATION
Fig. 2 shows a set of representative micrographs of the C/Pt replicas of the etched surface of PAA DPP and PI DPP films heated up to different temperatures (see captions in Fig.2). The surface of the films is seen to be formed by micro-domains of nearly spherical shape whose size and packing depend on the final heating temperature.
a)
b)
c)
Fig. 2. TEM-micrographs of the surface of (a) PAA DPP and PI DPP samples heated up to (b) 200 and (c) 420°C.
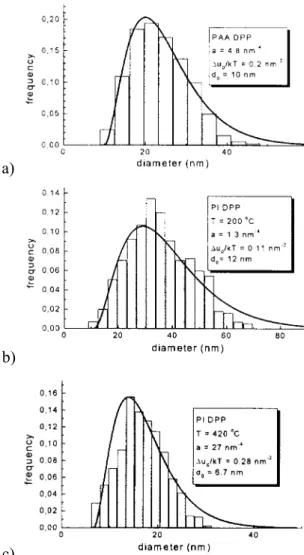
Fig. 3 displays the statistical distribution of the micro-domain diameters of the samples in Fig. 2; micro-domain diameter d [nm] (in histograms) and their size y [nm2] (Eq. 3) are related according to d = y1/2.
The histograms in Fig. 3 evidence a single statistical ensemble of micro-domains.
a)
b)
c)
Fig. 3. Statistic distribution of the micro-domain diameter at the surface of (a) PAA DPP and PI DPP samples heated up to (b) 200 and (c) 420°C.
When applying the model of reversible aggregation in the form of Eq. 3, micro-domains were treated as ‘identical units’ while their statistical ensemble as an ‘aggregate’.
Solid lines in Fig. 3 show the adjustment (curve fitting) of Eq. 3 to the experimental histograms for PAA DPP and PI DPP heated up to different temperatures. Here, a, ∆u0/kT, and d0 = y01/2 are tuned
(adjusted) parameters (their values are listed in Fig. 3) whereas p is a fixed parameter (p = 1 in agreement with the 2D version of the model of reversible aggregation used herein (Kilian et al., 2001)).
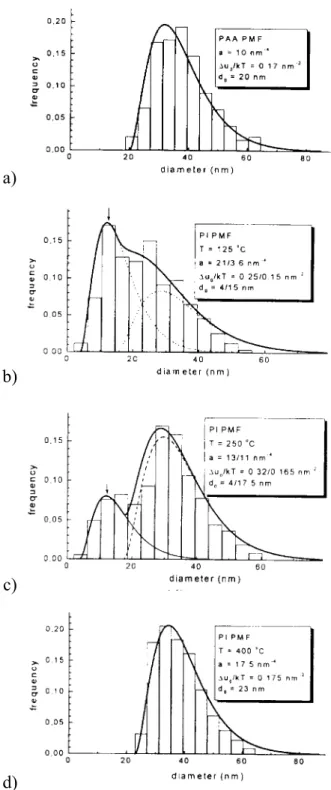
TEM-images of the surface of the PAA PMF films during their conversion to PI PMF are presented in Fig. 4. The obtained statistical distributions for their micro-domain diameters are shown in Fig. 5.
a)
b)
c)
a)
b)
c)
d)
Fig. 5. Statistic distribution of the micro-domain diameter at the surface of (a) PAA PMF and PI PMF samples heated up to (b) 125, (c) 250 and (d) 400 °C.
(
)
(
)
(
)
0
1 0 0
0 exp = + − = − ∆ − −
∑
i n p i i ii i i i
h y y
y y u
a y y
kT
, (4)
where n is the number of statistical ensembles. Such an interpretation based on Eq. 4 (n = 2) shows that the micro-domains form two overlapping statistical ensembles. In case of bimodal distribution (Fig. 5b-c), the dotted lines show the distribution of each of the two modes. In the TEM-images (Fig. 4b-c) one cannot observed directly the two ensembles whose existence is only revealed by the statistical analysis.
The statistical distribution of the micro-domain diameters may be characterized by the mean size <y> (normalized mathematical expectation):
< >=
+
−
−
−
∞ ∞∫
∫
y
y
y
y h y
y dy
h y
y dy
0 0 0 0 0 0
(
) (
)
(
)
. (5)For any modes, described by Eq. 4, Eq. 5 may be expressed as: 0 0
)
2
(
u
kT
p
y
y
∆
+
+
>=
<
. (6)The mean diameter of micro-domains is accordingly defined as <d> = <y>1/2.
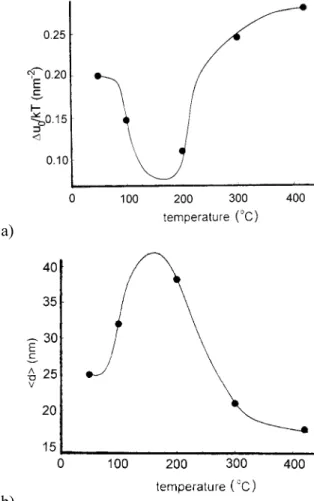
The distribution parameters ∆u0/kT and <d> are
presented as a function of the final heating temperature in Fig. 6 (PAA DPP and PI DPP) and in Fig. 7 (PAA PMF and PI PMF).
DISCUSSION
The analysis of ∆u0/kT and <d> vs. final heating
temperature (T) (Figs. 6-7) suggests that above 20°C, the aggregation energy decreases with T towards a minimum between 100°C and 200°C. At higher temperatures, ∆u0/kT increases and achieves an
almost constant value at about 350°C. <d> exhibits a mirror (i.e. inverse) evolution with T. Our results remain compatible with the achievement of extrema values for both ∆u0/kT and <d> at T ≅ 170 °C, a
temperature often referred to as specific for the process of imidization. For example, Bessonov et al., (1987) reported that around this specific temperature (170°C) an intensive chemical conversion occurs
along with a decrease of the molecular mass of polymer. Such conditions are very favorable for the arrival of the imide structure. For higher temperature (above 200°C), the increase of ∆u0/kT is associated to
the restitution of the molecular mass of polymer (Bessonov et al., 1987).
a)
b)
Fig. 6. Parameters of the size distribution, (a) ∆u0/kT
and (b) <d>, against the final heating temperature. Samples: PAA DPP and PI DPP.
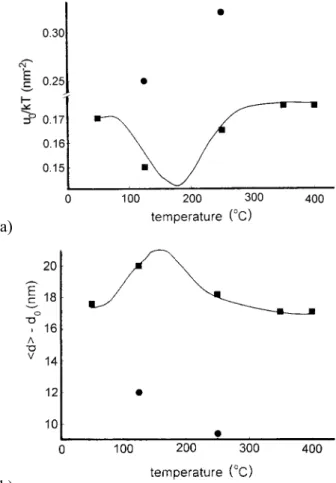
Herein, an interesting observation for PI PMF samples is the existence of an additional ensemble of at temperatures T = 125°C and T = 250°C identified in Figs. 5b-c with arrows. At T = 125 °C, the aggregation energy is higher for the additional ensemble (∆u02/kT) than for the basic ensemble
(∆u01/kT). Therefore, the mean diameter of the
the range 350-400°C, ∆u01/kT reaches a constant
value. As far as the additional ensemble vanishes in this temperature range, we may suppose that ∆u02/kT
becomes infinitely large and that <d2> becomes
accordingly infinitely small. Of course, such results are based on a limited number of experimental points, particularly for the additional ensemble.
a)
b)
Fig. 7. Parameters of the size distribution, (a) ∆u0/kT
and (b) <d> - d0, against the final heating temperature.
Basic and additional statistical ensembles are denoted as g and n. Samples: PAA PMF and PI PMF.
The appearance of a second ensemble of micro-domains in PAA PMF under heating may be explained by the sample specific chemical structure. Within the range 125-150°C, PAA PMF macromolecules are destroyed, and oligomers containing fluorene fragments
CONCLUSIONS
Micro-domains of different size and shape have been recognized in the TEM-images of the surface of the PAA films during their thermal conversion to PI. Micro-domains have been shown to form statistical ensemble(s) whose size distributions were successfully described with the model of reversible aggregation. The evolution with heating temperature of such distribution parameters as the aggregation energy and micro-domain mean diameter was analyzed, revealing for the investigated samples similar trends. Yet some peculiarities were acknowledged due to the different chemical structure of the studied polymers. Particularly, for some heating temperatures, micro-domains related to different intermediate chemical structures of the PAA PMF samples seem to form two overlapping statistical ensembles as opposed to one in all other examples. It is our hope that the current approach can be suitable for to the analysis of other solid-state chemical reactions.
REFERENCES
Bell VL (1976). Polyimide structure-property relationships. 1. Polymer from fluorene-derived diamines. J Polym Sci: Chem Ed 14:225-35.
Bessonov MI, Koton MM, Kudryavtsev VV, Laius LA (1987). Polyimides - thermally stable polymers. New York: Plenum Press.
Bronnikov S, Sukhanova T (2001). Statistical aspect of the polyimide films morphology. Image Anal Stereol 20(Suppl 1):133-8.
Bronnikov S, Sukhanova T, Laius L (2002). Surface morphology of polyamic acid and polyimide films prepared from 3,3′,4,4′-biphenyltetracarboxylic dian-hydride and p-phenylenediamine. Polymer Sci A 44:576-80.
Kilian HG, Metzler R, Zink B (1997). Aggregate model of liquids. J Chem Phys 107:8697-714.
Kilian HG, Kopf M, Vettegren VI (2001). Model of reversible aggregation: Universal features of fluctuating ensembles. Progr Colloid Polym Sci 117:172-81.
Köpf M, Kilian HG (1999). Relaxation in the glass transition regime interpreted in the terms of the aggregate model. Acta Polym 50:109-21.