A multiobjective optimization model
for optimal supplier selection in
multiple sourcing environment
M. K. Mehlawat, S. Kumar
Department of Operational Research, University of Delhi, Delhi, India
[email protected],[email protected]
Abstract
Supplier selection is an important concern of a firm’s competi-tiveness, more so in the context of the imperative of supply-chain management. In this paper, we use an approach to a multiobjective supplier selection problem in which the emphasis is on building sup-plier portfolios. The supsup-plier evaluation and order allocation is based upon the criteria of expected unit price, expected score of quality and expected score of delivery. A fuzzy approach is proposed that relies on nonlinearS-shape membership functions to generate different efficient supplier portfolios. Numerical experiments conducted on a data set of a multinational company are provided to demonstrate the applicabil-ity and efficiency of the proposed approach to real-world applications of supplier selection.
Key words: Multiobjective optimization, Fuzzy supplier selec-tion, Nonlinear optimizaselec-tion, Membership functions.
MSC 2010: 90C30, 90C70.
1
Introduction
chain supplier selection and flow allocation. Y¨ucel and G¨uneri [37] developed a weighted additive fuzzy programming approach for multi-criteria supplier selection. Recently, Amid et al. [4] developed a weighted maxmin fuzzy model to handle effectively the vagueness of input data and different weights of criteria in a supplier selection problem. Arikan [5] proposed a fuzzy math-ematical model and a novel solution approach to satisfy the decision maker’s aspirations for fuzzy goals.
In all the studies mentioned thus far, supplier selection is driven by non-portfolio based approaches only. This type of framework is restrictive as it does not provide the decision maker with an opportunity to leverage the supplier diversity with reference to preferences in respect of cost, quality and delivery. Recently, Guu et al. [15] discussed supplier selection problem with interval coefficients using portfolio based approach. In this paper, we con-sider three supplier’s selection criteria, namely, expected unit price, expected score of quality and expected score of delivery. The proposed fuzzy optimiza-tion model simultaneously minimize the expected unit cost and maximize the expected score of quality and expected score of delivery. The model is con-strained by several realistic constraints, namely, demand constraint, maximal and minimal fraction of the total order allocation to a single supplier, number of suppliers held in the portfolio. Note that in comparison to the approach used in Guu et al. [15], the proposed approach is capable of generating many efficient supplier portfolios using different shape parameters of the nonlinear
S-shape membership functions from which the decision maker may choose the one according to his/her preferences.
The paper is organized as follows. In Section 2, we present multiobjective programming model of supplier selection based on portfolio theory. In Section 3, we present fuzzy optimization models of supplier selection using nonlinear
S-shape fuzzy membership functions. The proposed models are test-run in Section 4. This section also includes a discussion of the results obtained. Finally in Section 5, we submit our concluding observations.
2
The supplier selection problem
Here, we assume that the decision maker allocate orders among n sup-pliers offering different price, quality and delivery. We use the following variables and parameters in the supplier selection model:
xi: the proportion of total order allocated to i-th supplier ,
pi: the per unit net purchase price from i-th supplier ,
di: the percentage of on-time-delivery level of i-th supplier ,
yi: the binary variable indicating whether the i-th supplier is contained in the supplier portfolio or not, i.e.,
yi =
(
1, if i-th supplier is contained in the supplier portfolio,
0, otherwise,
ui: the maximal fraction of the total order allocated to the i-th supplier ,
li: the minimal fraction of the total order allocated to thei-th supplier .
2.1
Objectives
• Expected unit price
The expected unit cost is the weighted average of the prices quoted by dif-ferent suppliers, the fractions of the overall quantity ordered to them serving as the respective weights. Here, we consider the overall demand as 1 which overcomes the dependence of supplier selection problem on the units of mea-surement of the commodities [15].
The expected unit price of the supplier portfolio is expressed as
f1(x) =
n
X
i=1
pixi.
• Expected score of quality
Quality of the supplies is measured in terms of the extent of satisfaction (fraction) with quality. We use the expected score of quality which in effect is the average of the satisfaction of the established standards by different suppliers as an objective of supplier selection [15]. The expected score of quality of the supplier portfolio is expressed as
f2(x) =
n
X
i=1
qixi.
• Expected score of delivery
A supplier’s compliance (fraction of 1) with on-time-delivery schedule is re-garded as his/her score of delivery. Using the fraction of quantity allocated to different suppliers as weight [15], the expected score of delivery of the supplier portfolio is expressed as
f3(x) =
n
X
i=1
2.2
Constraints
• Total order constraint on the suppliers:
n
X
i=1
xi = 1.
•Maximal fraction of the total order that can be allocated to a single supplier:
xi ≤uiyi, i= 1,2, . . . , n .
•Minimal fraction of the total order that can be allocated to a single supplier:
xi ≥liyi, i= 1,2, . . . , n .
The constraints corresponding to lower bounds li and upper bounds ui on the allocation to individual suppliers (0≤li, ui ≤1,li ≤ui,∀i) are included to avoid a large number of very small allocations (lower bounds) and at the same time to ensure a sufficient diversification of the allocation (upper bounds) [15].
• Number of suppliers held in a supplier portfolio:
n
X
i=1
yi =h
wherehis the number of suppliers that the decision maker chooses to include in the supplier portfolio [15]. Of all the suppliers from a given set, the decision maker would pick up the ones that are likely to yield the desired satisfaction of his/her preferences. It is not necessary that all the suppliers from a given set may configure in the supplier portfolio as well.
• No negative proportions of total orders:
2.3
The decision problem
The mixed-integer model for purchasing a single item in multiple sourcing networks is presented as follows:
(P1) minf1(x) =
n
X
i=1
pixi
maxf2(x) =
n
X
i=1
qixi
maxf3(x) =
n
X
i=1
dixi
subject to n
X
i=1
xi = 1, (1)
n
X
i=1
yi =h , (2)
xi ≤uiyi, i= 1,2, . . . , n , (3)
xi ≥liyi, i= 1,2, . . . , n , (4)
xi ≥0, i= 1,2, . . . , n , (5)
yi ∈ {0,1}, i= 1,2, . . . , n . (6) It may be noted that the basic framework of the supplier selection model (P1) is similar to the one used in [15]; however, instead of using interval coeffi-cients for an uncertain environment as in [15], we rely on fuzzy membership functions to generate supplier selection strategies that meets the preferences of the decision maker.
3
Supplier portfolio selection models based
on fuzzy set theory
choice from a ‘fuzzy’ set of subjective interpretations, the term ‘fuzzy’ being suggestive of the diversity of both the decision maker’s objective functions as well as that of the constraints.
Here, we formulate fuzzy multiobjective supplier portfolio selection prob-lem based on vague aspiration levels of decision makers to determine a sat-isfying supplier portfolio selection strategy. We assume that decision makers indicate aspiration levels on the basis of their prior experience and knowledge. As the aspiration levels are vague, we may refer to the fuzzy membership functions, for example, linear [39, 40], piecewise linear [17], exponential [23], tangent [22]. A linear membership function is most commonly used because it is simple and it is defined by fixing two points: the upper and lower levels of acceptability. However, there are some difficulties in using linear membership functions as pointed out by Watada [34]. Further, if the membership function is interpreted as fuzzy utility of the decision maker, describing the behavior of indifference, preference or aversion towards uncertainty, then a nonlinear membership function provides a better representation. It may also be noted that nonlinear membership functions are much more desirable for real-world decision making, as unlike linear membership functions, for nonlinear mem-bership functions, the marginal rate of increase (or decrease) of memmem-bership values as a function of model parameters is not constant-a technique that reflects reality better than the linear case.
In this paper, we use logistic function [34], i.e., a nonlinearS-shape mem-bership function to express vague aspiration levels of decision makers. This function has several advantages over other nonlinear membership functions and is considered an appropriate choice in portfolio selection, see Gupta et al. [14].
We now define the following nonlinear S-shape membership function of the goal of net price:
• µp(x) = 1 1 + exp
αp
n P
i=1
pixi−pm
,
0 1
0
Figure 1. Membership function of the goal of net price The membership function of the goal of quality is given by
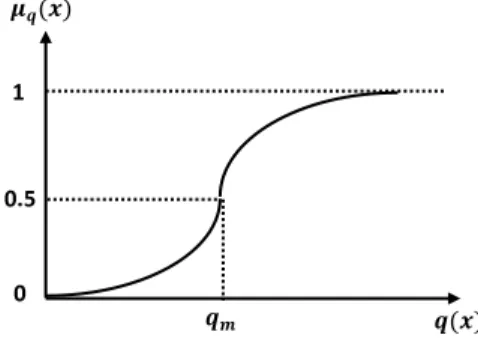
• µq(x) = 1 1 + exp
−αq
n P
i=1
qixi−qm
,
where qm is the mid-point and αq is provided by decision makers based on their degree of satisfaction regarding the level of quality (see Fig. 2).
Figure 2. Membership function of the goal of quality
Similarly, we define membership functions of the goal of delivery as fol-lows:
• µd(x) = 1 1 + exp
−αd
n P
i=1
dixi−dm
,
Using Bellman and Zadeh’s maximization principle [7] with the above defined fuzzy membership functions, the fuzzy supplier portfolio selection problem for selecting suppliers is formulated as follows:
(P2) max η
subject to
η≤µp(x), η≤µq(x), η≤µd(x),
0≤η≤1,
and Constraints (1)−(6).
The problem (P2) is a nonlinear programming problem. It can be trans-formed into a linear programming problem by letting θ = log η
1−η, so that η = 1
1 + exp(−θ). Since, the logistic function is monotonically increasing, hence, maximizing ηmakesθ maximize. Therefore, the problem (P2) can be transformed into the following equivalent linear programming problem:
(P3) maxθ
subject to
θ ≤αp pm− n
X
i=1
pixi
!
,
θ ≤αq n
X
i=1
qixi−qm
!
,
θ ≤αd n
X
i=1
dixi−dm
!
,
and Constraints (1)−(6).
in supplier portfolio selection. The weighted additive model of the fuzzy supplier portfolio selection problem is formulated as follows:
(P4) max
3 X
r=1
ωrηr
subject to
η1 ≤µp(x),
η2 ≤µq(x),
η3 ≤µd(x),
0≤ηr ≤1, r= 1,2,3 and Constraints (1)−(6),
whereωr is the relative weight of ther-th objective given by decision makers such thatωr >0 and
3 X
r=1
ωr = 1.
The max-min approach used in the formulation of the problems (P2)/(P3) and (P4) possesses good computational properties. However, the approach does not ensure fuzzy-efficient solution. To ensure efficiency of the solution, we take recourse to the two-phase approach proposed in [25]. As a result, it becomes possible to choose explicitly a minimum degree of satis-faction (taken to be equal to the solution of the max-min approach) for each fuzzy objective function and examine whether the same can be improved upon or not. Hence, we solve the problems (P5) and (P6) corresponding to the problems (P3) and (P4) respectively in the second-phase.
(P5) max
3 X
r=1
ωrθr
subject to log µp(x∗)
1−µp(x∗) ≤θ1 ≤αp pm−
n
X
i=1
pixi
!
,
log µq(x∗)
1−µq(x∗) ≤θ2 ≤αq
n
X
i=1
qixi −qm
!
,
log µd(x
∗)
1−µd(x∗) ≤θ3 ≤αs
n
X
i=1
dixi−dm
!
,
and Constraints (1)−(6),
where x∗ is an optimal solution of (P3), ω
1 = ω2 = ω3, ωr > 0, 3 X
r=1
(P6) max
3 X
r=1
ωrηr
subject to
µp(x∗∗)≤η1 ≤µp(x),
µq(x∗∗)≤η
2 ≤µq(x),
µd(x∗∗)≤η
3 ≤µd(x),
0≤ηr ≤1, r= 1,2,3 and Constraints (1)−(6),
wherex∗∗ is an optimal solution of (P4), ω
r is the relative weight of the r-th objective given by decision makers such thatωr >0 and
3 X
r=1
ωr= 1.
The problems (P3) and (P5) are linear programming problems which can be solved using the LINDO software [28]. The problems (P4) and (P6) are nonlinear programming problems. Although, for medium or large-sized prob-lems, one may suspect that solving these nonlinear programming problems could be computationally difficult, this is not the case, as many excellent softwares are available to solve them. We can use LINGO [29] to solve (P4) and (P6).
4
Numerical illustration
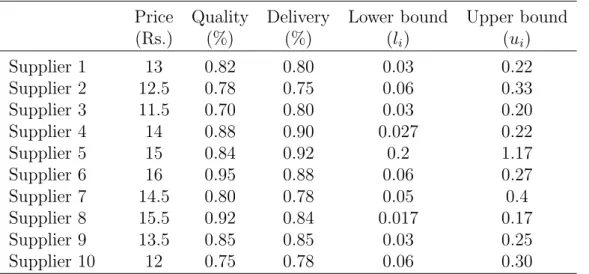
In this section, we present an illustration of the developed supplier portfo-lio selection decision procedure for a multinational company. The purchasing manager of the company have identified 10 potential suppliers. The manager will select the most favorable suppliers(s) and allocate various proportion of total order among selected suppliers(s) such that to minimize the net price of purchasing and to maximize total quality and delivery level of purchased items.
4.1
Supplier allocation
Table 1 Input data of suppliers
Price Quality Delivery Lower bound Upper bound
(Rs.) (%) (%) (li) (ui)
Supplier 1 13 0.82 0.80 0.03 0.22
Supplier 2 12.5 0.78 0.75 0.06 0.33
Supplier 3 11.5 0.70 0.80 0.03 0.20
Supplier 4 14 0.88 0.90 0.027 0.22
Supplier 5 15 0.84 0.92 0.2 1.17
Supplier 6 16 0.95 0.88 0.06 0.27
Supplier 7 14.5 0.80 0.78 0.05 0.4
Supplier 8 15.5 0.92 0.84 0.017 0.17
Supplier 9 13.5 0.85 0.85 0.03 0.25
Supplier 10 12 0.75 0.78 0.06 0.30
We now present the computational results.
Corresponding to pm = 13.3, qm = 0.83 and dm = 0.82, we obtain supplier portfolio selection strategy by solving the problem (P3). To check efficiency of the solution obtained, we use the two-phase approach and solve the problem (P5). If the purchasing manager is not satisfied with the supplier portfolio obtained, more supplier portfolios can be generated by varying the values of the shape parameters in the problem (P3). The computational results summarized in Table 2 are based on three different sets of values of the shape parameters. Note that all the three solutions obtained are efficient, i.e., their criteria vector are nondominated. Table 3 presents proportions of the total order allocated to suppliers in obtained supplier portfolios
Table 2 Summary results of supplier portfolio selection
Shape parameters & variables Net price Quality level Delivery level
η θ αp αq αd
Table 3 The proportions of the total order allocated to suppliers in obtained supplier portfolios
Shape parameters Suppliers
αp αq αd S1 S2 S3 S4 S5 S6 S7 S8 S9 S10
200 600 600 0.22 0.27635 0 0.22 0 0 0 0.03365 0.25 0 100 100 100 0.22 0.27443 0 0.22 0 0 0 0.03557 0.25 0 6 30 30 0.22 0.27797 0 0.22 0 0 0 0.03203 0.25 0
Next, we present computational results considering preferences of the purchasing manager for the three objectives.
• Case 1
We consider the following weights of the fuzzy goals of expected net price (ω1), expected quality level (ω2) and expected delivery level (ω3): ω1 = 0.6,
ω2 = 0.25, ω3 = 0.15. Corresponding to pm = 13.3, qm = 0.81 and dm = 0.88, we obtain supplier portfolio selection strategy by solving the problem (P4). The efficiency of the solution is verified by solving the problem (P6) in the second phase. The corresponding computational results are listed in Tables 4-5. The achievement levels of the various membership functions are
η1 = 0.95744,η2 = 0.41261,η3 = 0.31576. Note that these achievement levels
are consistent with the purchasing manager preferences, i.e., (η1 > η2 > η3)
agrees with (ω1 > ω2 > ω3).
• Case 2
Here, we consider the weights as ω1 = 0.15, ω2 = 0.6, ω3 = 0.25. By
taking pm = 13.3, qm = 0.81 and dm = 0.88, we obtain supplier portfolio selection strategy by solving the problem (P4). The solution is verified for efficiency. The corresponding computational results are listed in Tables 4-5. The achievement levels of the various membership functions areη1 = 0.00023,
η2 = 0.90362,η3 = 0.70285 which are consistent with the purchasing manager
preferences. • Case 3
As performed above in case 1 and case 2, corresponding to the weights ω1 =
0.15, ω2 = 0.2, ω3 = 0.65 and pm = 13.3, qm = 0.81, dm = 0.88, we obtain
portfolio selection strategy by solving the problem (P4). The solution is found to be efficient. The corresponding computational results are listed in Tables 4-5. The achievement levels of the various membership functions are
η1 = 0.00028, η2 = 0.77664, η3 = 0.78516 which are consistent with the
Table 4 Summary results of supplier portfolio selection incorporating pur-chasing manager preferences
Case Shape parameters Price Quality level Delivery level
αp αq αd
Case 1 6 30 30 12.78110 0.79823 0.85422
Case 2 6 30 30 14.69752 0.88460 0.90870
Case 3 6 30 30 14.66650 0.85154 0.92320
Table 5 The proportions of the total order allocated to suppliers in obtained supplier portfolios incorporating purchasing manager preferences
Class Suppliers
S1 S2 S3 S4 S5 S6 S7 S8 S9 S10
Class 1 0.0661 0 0.2 0.22 0 0 0 0 0.25 0.2639
Class 2 0 0 0 0.22 0.21496 0.27 0 0.04504 0.25 0 Class 3 0 0 0 0.027 0.646 0.06 0 0.017 0.25 0
The foregoing analysis of the various decision situations from the stand point of decision makers preferences demonstrates that the supplier portfolio selection models developed in this paper discriminate among decision makers. Thus, it is possible to construct efficient portfolios with reference to the diversity of decision maker preferences.
5
Conclusions
verified using the two-phase approach.
The main advantage of the proposed models is that if decision maker is not satisfied with any of the supplier portfolios, more portfolios can be generated by varying the values of the shape parameters. These parameters may be configured to suit decision makers preferences. Thus, the fuzzy sup-plier portfolio selection models proposed in this paper can provide satisfying portfolio selection strategies according to vague aspiration levels, degrees of satisfaction and relative importance of the various objectives.
Acknowledgment
We are thankful to the Editor-in-Chief and anonymous referees for their valuable comments and suggestions to improve presentation of the paper. The first author acknowledges the Research and Development Grant received from University of Delhi, Delhi, India. The second author acknowledges the financial support received from UGC, New Delhi, India.
References
[1] N. Aissaoui, M. Haouari and E. Hassini, Supplier selection and order lot sizing modeling: a review, Computers and Operations Research 34 (2007), 3516-3540.
[2] A. Amid, S. H. Ghodsypour and C. O’Brien,Fuzzy multiobjective linear model for supplier selection in a supply chain, International Journal of Production Economics 104 (2006), 394-407.
[3] A. Amid, S. H. Ghodsypour and C. O’Brien, A weighted additive fuzzy multiobjective model for the supplier selection problem under price breaks in a supply Chain, International Journal of Production Economics 121 (2009), 323-332.
[4] A. Amid, S. H. Ghodsypour and C. O’Brien,A weighted maxmin model for fuzzy multi-objective supplier selection in a supply chain, Interna-tional Journal of Production Economics 131 (2011), 139-145.
[5] F. Arikan, A fuzzy solution approach for multi objective supplier selec-tion, Expert Systems with Applications 40 (2013), 947-952.
[7] R. Bellman and L. A. Zadeh, Decision making in a fuzzy environment, Management Science 17 (1970), 141-164.
[8] J. Chai, J. N. K. Liu and E. W. T. Ngai,Application of decision-making techniques in supplier selection: a systematic review of literature, Expert Systems with Applications 40 (2013), 3872-3885.
[9] C. T. Chen, C. T. Lin and S. F. Huang, A fuzzy approach for sup-plier evaluation and selection in supply chain management, International Journal of Production Economics 102 (2006), 289-301.
[10] G. W. Dickson, An analysis of vendor selection systems and decisions, Journal of Purchasing 2 (1966), 5-17.
[11] I. Erol, G. William and Jr. Ferrel,A methodology for selection problems with multiple, conflicting objectives and both qualitative and quantitative criteria, International Journal of Production Economics 86 (2003), 187-199.
[12] B. Feng, Z. Fan and Y. Li, A decision method for supplier selection in multi-service outsourcing, International Journal of Production Eco-nomics 132 (2011), 240-250.
[13] S. H. Ghodsypour and C. O’Brien,The total cost of logistics in supplier selection, under conditions of multiple sourcing, multiple criteria and capacity constraint, International Journal of Production Economics 73 (2001), 15-27.
[14] P. Gupta, M. K. Mehlawat and A. Saxena,Asset portfolio optimization using fuzzy mathematical programming, Information Sciences 178 (2008), 1734-1755.
[15] S.M. Guu, M. Mehlawat and S. Kumar, A multiobjective optimization framework for optimal selection of supplier portfolio, Optimization 63 (10) (2014), DOI:10.1080/02331934.2014.917306.
[16] W. Ho, X. Xu and P. K. Dey,Multi-criteria decision making approaches for supplier evaluation and selection: a literature review, European Jour-nal of OperatioJour-nal Research 202 (2010), 16-24.
[18] C. Kahraman, U. Cebeci and Z. Ulukan,Multi-criteria supplier selection using fuzzy AHP, Logistics Information Management 16 (2003), 382-394. [19] B. Karpak, E. Kumcu and R. R. Kasuganti, An application of visual in-teractive goal programming: a case in vendor selection decisions, Journal of Multi-Criteria Decision Analysis 8 (1999), 93-105.
[20] M. Kumar, P. Vart and P. Shankar,A fuzzy goal programming approach for supplier selection problem in a supply chain, Computer and Indus-trial Engineering 46 (2004), 69-85.
[21] C. K. Kwang, W. H. Lp and J. W. K. Chan,Combining scoring method and fuzzy expert systems approach to supplier assessment: a case study, Integrated Manufacturing Systems 13 (2002), 512-519.
[22] H. Leberling,On finding compromise solutions in multicriteria problems using the fuzzy min-operator, Fuzzy Sets and Systems 6 (1981), 105-118. [23] R. J. Li, and E. S. Lee, An exponential membership function for fuzzy multiple objective linear programming, Computers and Mathematics with Applications 22 (1991), 55-60.
[24] C. C. Li, Y. P. Fun and J. S. Hung, A new measure for supplier perfor-mance evaluation, IIE Transactions 29 (1997), 753-758.
[25] X. -Q. Li, B. Zhang and H. Li, Computing efficient solutions to fuzzy multiple objective linear programming problems, Fuzzy Sets and Systems 157 (2006), 1328-1332.
[26] P. Parthiban, H. A. Zubar and P. Katakar,Vendor selection problem: a multi-criteria approach based on strategic decisions, International Jour-nal of Production Research 51 (2013), 1535-1548.
[27] M. Punniyamoorthy, P. Mathiyalagan and P. Parthiban, A strategic model using structural equation modeling and fuzzy logic in supplier se-lection, Expert Systems with Applications 38 (2011), 458-474.
[28] L. Scharge, Optimization Modeling with LINDO, Duxbury Press, CA, 1997.
[30] K. Shaw, R. Shankar, S. S. Yadav and L. S. Thakur,Supplier selection using fuzzy AHP and fuzzy multi-objective linear programming for de-veloping low carbon supply chain, Expert Systems with Applications 39 (2012), 8182-8192.
[31] R. N. Tiwari, S. Dharmar and J. R. Rao, Fuzzy goal programming-an additive model, Fuzzy Sets and Systems 24 (1987), 27-34.
[32] M. Toloo and S. Nalchigar,A new DEA method for supplier selection in presence of both cardinal and ordinal data, Expert Systems with Appli-cations 38 (2011), 14726-14731.
[33] W. Tsai and S. Hung, A fuzzy goal programming approach for green supply chain optimisation under activity-based costing and performance evaluation with a value-chain structure, International Journal of Pro-duction Research 47 (2009), 4991-5017.
[34] J. Watada,Fuzzy portfolio selection and its applications to decision mak-ing, Tatra Mountains Mathematical Publications 13 (1997), 219-248. [35] C. A. Weber, J. R. Current and W. C. Benton,Vendor selection criteria
and methods, European Journal of Operational Research 50 (1991), 2-18. [36] C. A. Weber and J. R. Current, A multiobjective approach to vendor selection, European Journal of Operational Research 68 (1993), 173-184. [37] A., Y¨ucel and A. F. G¨uneri, A weighted additive fuzzy programming approach for multi-criteria supplier selection, Expert Systems with Ap-plications 38 (2011), 6281-6286.
[38] L. A. Zadeh, Fuzzy sets, Information and Control 8 (1965), 338-353. [39] H. -J. Zimmermann, Description and optimization of fuzzy systems,
In-ternational Journal of General Systems 2 (1976), 209-215.