Premature Breast Cancer Mammographic Detection Using Image
Segmentation Approaches
*Bilal Rasheed, DR Omer Suleman Department of Computer Science University of management and technology
Lahore, Pakistan
[email protected],[email protected]
Abstract—In the current era digital image processing occupies a dynamic role in every aspect of human survival. Image processing refers to progress digital images and mined attributes from images. In this paper we describe the experimental testing ofMammographic approach based on research towards early breast cancer detection. The main objective is to detect breast cancer using computer aided automated detection scheme. We extracted variables from previous papers and refined the important variables for experiment then apply different samples of images to acquired using Mammographyimages.
Keywords—image recognition using Mammography, F – Fatty, G Fattyglandular, D -Dense-glandular, CALC – Calcification, CIRC -Well-defined/circumscribed masses, SPIC -Speculated masses, MISC - Other, ill-defined masses, ARCH - Architectural distortion, ASYM –
Asymmetry, NORM– Normal, B– Benign and M–
Malignant, MIAS.
I. INTRODUCTION
A number of women die every year due to breast most cancers. Research on greater green remedies are being made worldwide, but high survival rates rely upon early detection of each disease. numerous non-invasive imaging approaches exist for doing diagnostics consisting of mammography, ultrasound and MRI (magnetic resonance imaging). however, the evaluation of a surgical biopsy taken from the breast is yet the maximum reliable test, but it is invasive, painful and stressful to the patient, highly-priced and time-eating. For those motives, patients have a tendency to avoid the system and take it when it's far too overdue. A much less invasive screening method is the MRI and Mammography of breast hundreds. it's far taken into consideration safe and has a high sensitivity to differentiate among a benign tumor and a malignant one. Magnetic resonance
imaging (MRI) is a medical imaging technique used in radiology to form pix of the anatomy and the physiological techniques of the body in both health and sickness. MRI scanners use robust magnetic fields, radio waves, and discipline gradients to generate snap shots of the internal of the body. MRI may be used to view, display, or diagnose
1. Spine, joint or muscle problems. 2. Abdominal tumors and disorders. 3. Brain tumors and abnormalities. 4. Breast cancer.
5. Heart or blood vessel problems
Imaging Tests Used to Evaluate Breast Disease
An imaging test is a way to see what’s going on
inside your body. The pictures can show normal body structures and functions, as well as abnormal ones caused by diseases like cancer. While seeing the image we can predict cancerous part of the body which present in the specific area of that part.These are some of the more common imaging tests used to look for or learn more about breast changes and breast cancer:
Mammograms
Mammography is X-ray imaging of your breasts which is designed to detect tumors and other abnormalities. Mammography is the technique which play a key role in early breast cancer detection and help decrease breast cancer deaths. During a mammogram breasts are compressed between two firm surfaces to spread out the breast tissue. An X-ray captures black-and-white images of your breasts that are displayed on a computer screen and examined by a doctor who looks for signs of cancer.
Mammography can be used either for screening or for diagnostic purposes in evaluating a breast lump
Screening mammography
Screening mammography is used to detect breast disorder in women who have no signs or symptoms
Premature Breast Cancer Mammographic Detection Using Image
Segmentation Approaches
*Bilal Rasheed, DR Omer Suleman Department of Computer Science University of management and technology
Lahore, Pakistan
[email protected],[email protected]
Abstract—In the current era digital image processing occupies a dynamic role in every aspect of human survival. Image processing refers to progress digital images and mined attributes from images. In this paper we describe the experimental testing ofMammographic approach based on research towards early breast cancer detection. The main objective is to detect breast cancer using computer aided automated detection scheme. We extracted variables from previous papers and refined the important variables for experiment then apply different samples of images to acquired using Mammographyimages.
Keywords—image recognition using Mammography, F – Fatty, G Fattyglandular, D -Dense-glandular, CALC – Calcification, CIRC -Well-defined/circumscribed masses, SPIC -Speculated masses, MISC - Other, ill-defined masses, ARCH - Architectural distortion, ASYM –
Asymmetry, NORM– Normal, B– Benign and M–
Malignant, MIAS.
I. INTRODUCTION
A number of women die every year due to breast most cancers. Research on greater green remedies are being made worldwide, but high survival rates rely upon early detection of each disease. numerous non-invasive imaging approaches exist for doing diagnostics consisting of mammography, ultrasound and MRI (magnetic resonance imaging). however, the evaluation of a surgical biopsy taken from the breast is yet the maximum reliable test, but it is invasive, painful and stressful to the patient, highly-priced and time-eating. For those motives, patients have a tendency to avoid the system and take it when it's far too overdue. A much less invasive screening method is the MRI and Mammography of breast hundreds. it's far taken into consideration safe and has a high sensitivity to differentiate among a benign tumor and a malignant one. Magnetic resonance
imaging (MRI) is a medical imaging technique used in radiology to form pix of the anatomy and the physiological techniques of the body in both health and sickness. MRI scanners use robust magnetic fields, radio waves, and discipline gradients to generate snap shots of the internal of the body. MRI may be used to view, display, or diagnose
1. Spine, joint or muscle problems. 2. Abdominal tumors and disorders. 3. Brain tumors and abnormalities. 4. Breast cancer.
5. Heart or blood vessel problems
Imaging Tests Used to Evaluate Breast Disease
An imaging test is a way to see what’s going on
inside your body. The pictures can show normal body structures and functions, as well as abnormal ones caused by diseases like cancer. While seeing the image we can predict cancerous part of the body which present in the specific area of that part.These are some of the more common imaging tests used to look for or learn more about breast changes and breast cancer:
Mammograms
Mammography is X-ray imaging of your breasts which is designed to detect tumors and other abnormalities. Mammography is the technique which play a key role in early breast cancer detection and help decrease breast cancer deaths. During a mammogram breasts are compressed between two firm surfaces to spread out the breast tissue. An X-ray captures black-and-white images of your breasts that are displayed on a computer screen and examined by a doctor who looks for signs of cancer.
Mammography can be used either for screening or for diagnostic purposes in evaluating a breast lump
Screening mammography
for visual or new breast abnormalities. The goal is to detect cancer before active signs are noticeable.
Screening mammograms usually take 2 views x-ray pictures taken from different angles of each breast.
Diagnostic mammography
Diagnostic mammography is used to investigate suspicious breast changes, such as a new breast lump, breast pain, an unusual skin appearance, nipple thickening or nipple discharge. It's also used to evaluate abnormal findings on a screening mammogram. A diagnostic mammogram includes additional mammogram images.
II. LITERATURE REVIEW
JawadNagi [1] developed the adaptive mean filter method which processes a region with rectangle shape. This filter makes the image smooth out by filling neighborhood image information unless blurring the edge and also maintain image details. Devi, C. Maya, Mary VasanthaBai,[2] developed filter methods to perform the de-noising process. High pass filter method enhances the image information. The low pass filter method removes noise. It gives the image information but makes the image to be smoothened. The best solution to filter the noise is to use both filter methods partially to achieve the image quality.
Juan Shah Vidal,[3] promotes a new method called mean filter. This method replaces blurred image pixels by identical of neighborhood pixels. It improves the image quality and makes the image smooth. It becomes best for eliminating Gaussian noise.
Roselin, R., and K. Thangavel.[4] proposed histogram equalization method. This method preprocesses the mammogram image and improves the gray-scale quality of an image. this method can be used and obtain better views of the image. Most commonly occurring pixel information can be scattered.
In Yuchun Tang [5] depicted a modified SVM RFE al- gorithm with FCM-SVM RFE [5] for the gene selection. In this paper they proposed a new method for gene selection by implementing Fuzzy K-Means clustering algorithm[6] for grouping related genes into clusters and then apply SVM to each clusters. They showed that FCM -SVM RFE is more efficient and accurate than SVM-RFE. And also they demon-strate the SVM-RFE algorithm is much better than traditional correlated based algorithms.
Kannan, G., A. NoorulHaq, and M. Devika.[6] developed particle swarm Optimization algorithm
that supports genetic algorithm method of classification. In this method, fuzzy rules were enveloped and buildup the procedures during pre-processing stage. This gives an excellent outcome though related to other classification methods.
Raykar, VikasChandrakant, and
RamaniDuraiswami.[8] described segmenting the image into k-clusters. From the segmented image, each pixel is appropriated to at least one of the cluster. It assembles the observed pixel based on cluster with minimum distance. By calculating the distance between pixel and its center, it can be added to the cluster. Whenever a pixel is added to a cluster, the distance is re-computed to find its new center. Using weighted mean cluster, identify the mass in mammogram image.
III. METHODOLOGY
The main purpose of this paper is to develop an efficient analyzer for predicting breast cancer in early stage for future and the main objective is to find out the overall accuracy of the purpose algorithm. The dataset took from MIAS(Mammographic Image Analysis Society)of breast cancer data base.
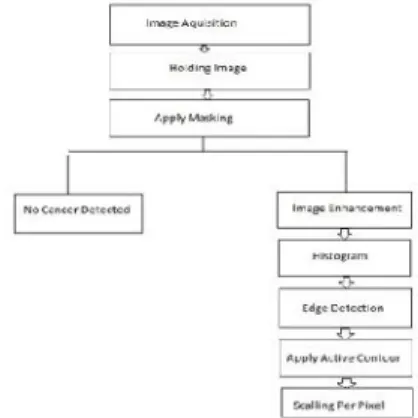
This section presentto explain the techniques used for detection of breast cancer through mammogram images. Thresh-holding, edge-based method comes under segmentation section. All these procedures are used together to solve a complex problem
Fig III.1 Image Segmentation
In this research paper we have purposed early detection of breast cancer using image segmentation
approaches.First we acquire an
we apply active contour then image to remove background and get cancerous area if cancer is present. Then we can apply scaling pixel by pixel with ground truth image and actual picture to check accuracy of given output result.
III.1 Thresh-Holding
Thresh-Holding is a well-known approach. It segments images into foreground and background. Based on the intense, this method acquires an intensity value. The coordinate function is adjusted to the image pixel intensity.
Consider I (i, j) be an image, I(I,j) = {o, f(I,j)<G
{1, F(I,j)>= G
Here the pixel value can be referred by f (i, j).Thresh-holding could be separated into global and local thresh-holding. Global thresh-holding partitions the image into two based on the prior equation. When G is constant, then the approach is referred to as global thresh-holding. In local thresh-holding, partition an image into sub images and derive the local properties of the image
Procedure for selecting the threshold value automatically.(Gayathri, 2016)
1. Choose an initial threshold value for G. 2. Partition an image based on threshold value
G. The resultant contains two distinct classes of pixels.
3. T1 contains the pixels whose intensity values ≥ G, whereas T2 contains the pixels
whose values < G.
4. Calculate the intensity values μ1 and μ2 for
T1 and T2. whereμ1 is 0 and μ2 is 1
5. G=1/2(μ1+μ2)
6. Iterate the procedure up to variation in G.
III.2 Edge-BasedSegmentation
An edge can be represented as the boundary in middle of regions with relationally different gray level properties. In general, an edge occurs among two different regions in an image. Neighboring intensity changes in an image is referred to as edges. Two derivatives are available in edge operators namely: first order derivative operators and second order derivative operators.
1. Gray histogram
Based on gray level intensity and heavily depends on threshold value.Tricky to find the maximum and minimum intensity because histogram is not smooth for the impact of noise
2. Gradient Based Method
If there is a little noise in image, then gradient based method works well. This method includes wrap around gradient operators with the image. Large value of gradient magnitude is possible only when rapid transition takes place between regions. Gradient based operators are Roberts, Prewitt, Sobel, Laplacian of Gaussian(LOG), Zero-cross and Canny operators etc. From the annotation, it is accomplishing that Sobel operator gives better result when compared to other operators.(Gayathri B. K., 2016)
IV. EXPERIMENTAL STEPS IV.1 Data Set Description
In this study we are only consider breast cancer data set, as breast cancer is leading cause of death in women of every age in the world and as well as in our country. We are usingthe Pilot European Image Processing Archive (PEIPA) MIAS data to analysis cancer in women. This data set provided with under license which is publically available at PEIPA. The MIAS data set contain MAMMOGRAPY images of benign and malignant breast tumors.
The data set has 322 instances characterized by 7 attributes. The 1st column identifies MIAS database reference number while the 2nd column Character of background tissue
F – Fatty, G - Fatty-glandular, D - Dense-glandular. 3rd column identifies Class of abnormality present in the instance CALC – Calcification, CIRC - Well-defined/circumscribed masses, SPIC - Speculated masses, MISC Other, illdefined masses, ARCH -Architectural distortion, ASYM – Asymmetry, NORM–Normal. 4th column of the data table is that of the class label that describe Severity of abnormality, the label is being benign and malignant. The class labels are originally encoded as B–Benign and M – Malignant. 5th,6th columns describe x,y image-coordinates of center of abnormality. 7th column describe Approximate radius (in pixels) of a circle enclosing the abnormality.
1. The list is arranged in pairs of films, where each pair represents the left (even filename numbers) and right mammograms(odd filename numbers) of a single patient. 2. The size of ALL the images is 1024pixels’
x 1024 pixels. The images have been centered in the matrix.
than individual calcifications.Coordinate system origin is the bottom-left corner. 4. In some cases, calcifications are widely
distributed throughoutthe image rather than concentrated at a single site. In thesecases,center locations and radii are inappropriate and havebeen omitted.
IV.2 Purposed Procedure:
1. Image acquisition (Mammography) 2. Holding that image
3. Apply masking 4. Image enhancement 5. Histogram
6. Edge detection 7. Apply active contour 8. Scaling per pixel
IV.3 Procedure Explanation
1. Find the histogram of mammography images
2. Apply sharpness algorithm to enhance the image
3. Apply edge base segmentation to detect breast edges by applying thresh-holding on it.
V. RESULT
We have passed cancerous image and non cancerous images in our algorithm and we get these result in initial result which are given below
Fig V.1(Enhancement of normal) Fig V.2 (Histogram for normal image) Fig V.3(Thresh-holding)
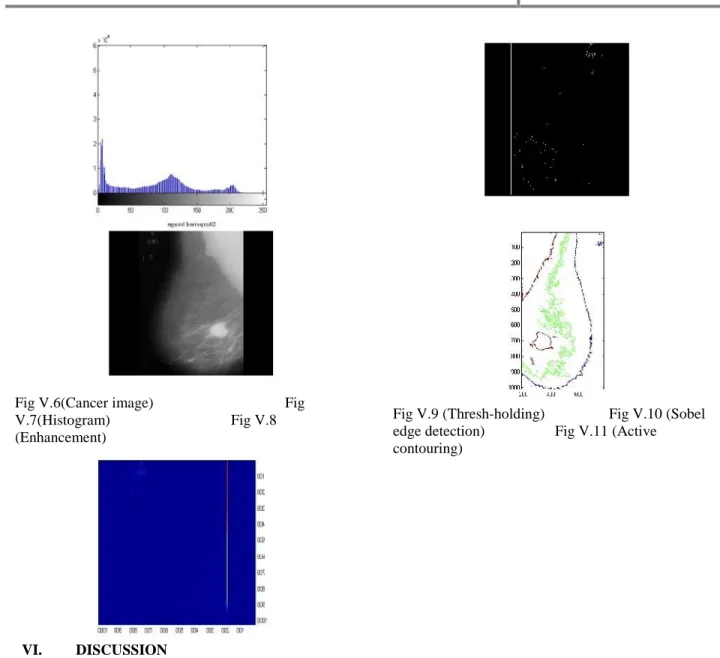
Fig V.6(Cancer image) Fig
V.7(Histogram) Fig V.8
(Enhancement)
Fig V.9 (Thresh-holding) Fig V.10 (Sobel edge detection) Fig V.11 (Active contouring)
VI. DISCUSSION
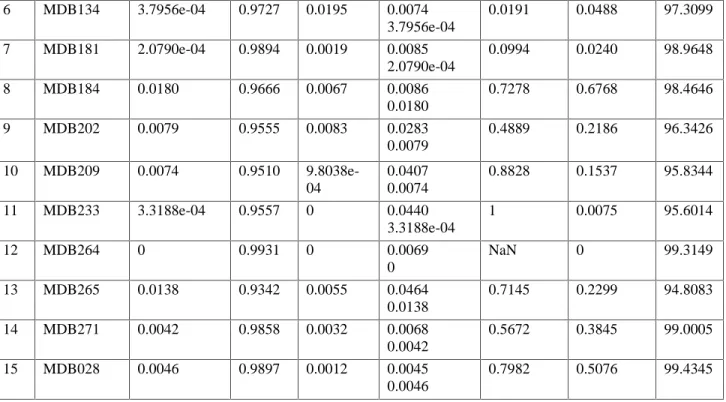
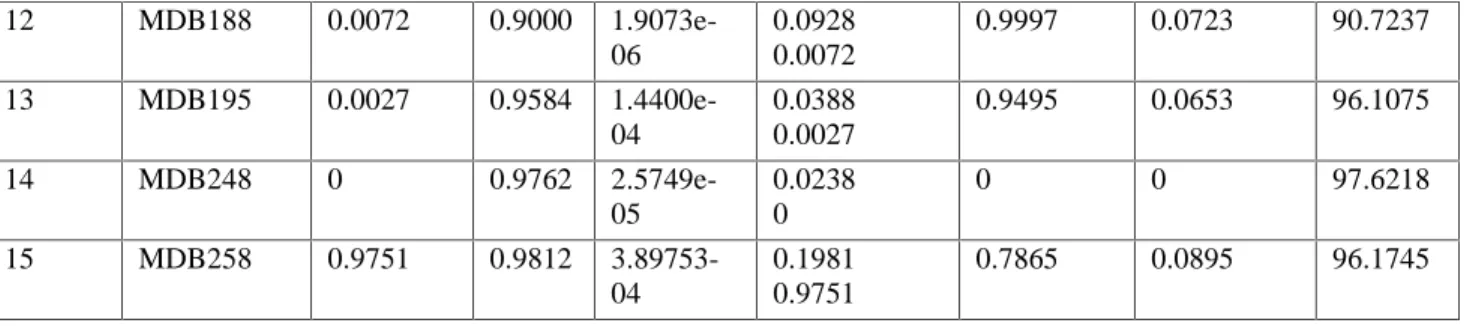
We passed 15 picture of malignant, 15 picture benign and 15 picture normal and we purpose three table which is given below
Table 1 cancerous images result SR
no
IMAGE NAME
TP TN FP FN Precision Recall Accurac
y
1 MDB003 0.0116 0.9253
4.2820e-04
0.0627 0.0116
0.9644 0.1560 93.6871
2 MDB111 0.0173 0.9336 0.0069 0.0422
0.0173
0.7151 0.2911 95.0890
3 MDB117 9.4986e-04 0.9896 00014 0.0080
9.4986e-04
0.3968 0.1063 99.0566
4 MDB120 0.0035 0.9407 0.0075 0.0483
0.0035
0.3145 0.0667 94.4187
5 MDB132 1.2207e-04 0.8329 0.1609 0.0060
1.2207e-04
Table 2 benign images result
6 MDB134 3.7956e-04 0.9727 0.0195 0.0074
3.7956e-04
0.0191 0.0488 97.3099
7 MDB181 2.0790e-04 0.9894 0.0019 0.0085
2.0790e-04
0.0994 0.0240 98.9648
8 MDB184 0.0180 0.9666 0.0067 0.0086
0.0180
0.7278 0.6768 98.4646
9 MDB202 0.0079 0.9555 0.0083 0.0283
0.0079
0.4889 0.2186 96.3426
10 MDB209 0.0074 0.9510
9.8038e-04
0.0407 0.0074
0.8828 0.1537 95.8344
11 MDB233 3.3188e-04 0.9557 0 0.0440
3.3188e-04
1 0.0075 95.6014
12 MDB264 0 0.9931 0 0.0069
0
NaN 0 99.3149
13 MDB265 0.0138 0.9342 0.0055 0.0464
0.0138
0.7145 0.2299 94.8083
14 MDB271 0.0042 0.9858 0.0032 0.0068
0.0042
0.5672 0.3845 99.0005
15 MDB028 0.0046 0.9897 0.0012 0.0045
0.0046
0.7982 0.5076 99.4345
SR no IMAGE
NAME
TP TN FP FN Precision Recall Accurac
y
1 MDB005 0 0.9922 0 0.0078 NaN 0 99.2167
2 MDB015
3.4428e-04
0.9784 3.1719e-05
0.0212 3.4428e-04
0.9025 0.0160 97.8776
3 MDB021
9.9945e-04
0.8964 0.0145 0.0881 9.9945e-04
0.0644 0.0112 89.7384
4 MDB025
6.1989e-05
0.9740 0.0104 0.0156 6.1989e-05
0.0059 0.0040 97.4016
5 MDB063 0.0091 0.9444 0.0127 0.0338
0.0091
0.4177 0.2125 95.3490
6 MDB081 0.0213 0.9574 0.0019 0.0195
0.0213
0.9198 0.5216 97.8637
7 MDB083
4.8637e-04
0.5898 0.0026 0.4071 4.8637e-04
0.1588 0.0012 59.0279
8 MDB127
6.1989e-04
0.9316 0.0035 0.0643 6.1989e-04
0.1496 0.0096 93.2225
9 MDB132
1.2016e-04
0.8340 0.1609 0.0050 1.2016e-04
7.4614e-04 0.0235 83.4085
10 MDB150
1.2684e-04
0.9109 0.1648 0.0242 1.2684e-04
0.0020 0.0052 91.1000
11 MDB165
1.9741e-04
0.9730 4.1962e-05
0.0267 1.9741e-04
Table 3 Normal images result
We acquire the mammographic image from MIAS data base firstly we have enhanced the image using enhancement technique which is sharpness brighten up to visualize small cancer clearly/extract features from given image then we take histogram of enhance imagebasically we have 266 shades in given image histogram provided us grey level which start from 0 to 255 if the coordinate is near to zero then it means more congestion in given image to seeing
12 MDB188 0.0072 0.9000
1.9073e-06
0.0928 0.0072
0.9997 0.0723 90.7237
13 MDB195 0.0027 0.9584
1.4400e-04
0.0388 0.0027
0.9495 0.0653 96.1075
14 MDB248 0 0.9762
2.5749e-05
0.0238 0
0 0 97.6218
15 MDB258 0.9751 0.9812
3.89753-04
0.1981 0.9751
0.7865 0.0895 96.1745
SR no IMAGE
NAME
TP TN FP FN Precision Recall Accuracy
1 MDB006 0 0.9978 0.0022 0
0
0 NaN 99.7809
2 MDB009 0 0.9898 0.0102 1.0490e-05
0
0 0 98.9837
3 MDB011 0 0.9999
6.9618e-05
0 0
0 NaN 99.9930
4 MDB014 0 0.9764 0.0236 0
0
0 NaN 97.6398
5 MDB022 0 0.9872 0.0128 0
0
0 NaN 98.7180
6 MDB024 0 0.9987 0.0013 0
0
0 NaN 99.8676
7 MDB029 0 0.9026 0.0974 1.9073e-05
0
0 0 90.2572
8 MDB050 0 0.9810 0.0190 0
0
0 NaN 98.0959
9 MDB053 0 0.9476 0.0523 4.0054e-05
0
0 0 94.7650
10 MDB054 0 0.9716 0.0284 1.9073e-06
0
0 0 97.1621
11 MDB057 0 0.9920 0.0080 0
0
0 NaN 99.1993
12 MDB070 0 0.9999
8.9645e-05
4.7684e-06 0
0 0 99.9906
13 MDB077 0 0.9989 0.0011 5.7220e-06
0
0 0 99.8923
14 MDB084 0 0.9940 0.0060 0
0
0 NaN 99.3962
15 MDB091 0 0.9914 0.9812 0
0
histogram we can realizewhich area is more congested we apply thresh-holding on that image which value is 200 basically it is (x,y) coordinates to describe histogram of most cancerous area if the cancer is present shows fig V.7. then we apply edge detection while using sobel edge detection techniques because sobel edge detection is one the most appropriate to detect large area of object as well as small area sobel have merit of smoothing edge detection. Then we apply Active Countering to detect the actual area where cancer is present.
Active counter is well defindactivecontour(object,mask) segments the 2-D grayscale object into foreground (object) and background regions using active contour based segmentation. The output image where the foreground is white (logical true) and the background is black (logical false). mask is a binary image that specifies the initial state of the active contour. The boundaries of the object region(s) (white) in mask define the initial contour position used for contour evolution to segment the image. For obtain faster and more accurate segmentation results, specify an initial contour position that is close to the desired object boundaries. Then we get ground truth of that image to calculate the accuracy of our algorithm and we get 98.12 accuracy.
For calculating the accuracy we use TN(True Negative) FN(False Negative ) TP(True Positive) TN(True Negative) Precision=tp/(tp+fp)
Recall=tp/(tp+fn)
Accuracy=(tp+tn)/(tp+fp+tn+fn) Accuracy=accuracy*100
VII. CONCLUSSION
In this paper, we demonstrate the performance of our algorithm in detection of breast cancer in early stage to safe life of many women we have passed 200 images in our algorithm and result seems perfect in our passed images. First we pass the image and apply enhancement on that to get better result, then we apply masking on that image to check which area is cancerous, then we apply histogram to check the result of masking area weather it is a cancerous or not then we apply Sobol edge detection and then we apply thresh-holding on it to get that area and then we contour image to outline that cancer area as shown in figures given above.
VIII. REFFERENCES
1. Xavier Castells Eduard
MolinsFrancescMacià (2006). Journal of epidemiology and community health, 60, 316–321.
2. Hubbard W.-K, R. A., & Chen et al (1993). Cumulative probability of false-positive recall or biopsy recommendation after 10 years of screening mammography (Hubbard W.-K & , 1993).
3. H. Gilbert Welch Honor J. Passow (2014). Quantifying the benefits and harms of screening mammography. JAMA internal medicine, 174, 448–454.
4. Paul M. Meaney et al (2000). A clinical prototype for active microwave imaging of the breast. Microwave Theory and Techniques IEEE Transactions, 48, 1841–
1853.
5. Jing-song Hong, M. H. B., &Deedar Ali Jamro (2015). UWB antenna design and implementation for microwave medical imaging application. Communication Software and Networks (ICCSN)
6. Arslan Brian Flynn, H. Z. T. (2013). Microwave imaging of a realistic cancerous phantom using an ultra-wideband antenna transceiver system. Antennas and Propagation Conference (LAPC)
7. Marco ChiappeGian Luigi Gragnani (2002). Vivaldi antennas for microwave imaging. Theoretical analysis and design considerations, 55 no. 6, 1885–1891. 8. Peng Fei et al (2011). A miniaturized
antipodal Vivaldi antenna with improved radiation characteristics. Antennas and Wireless Propagation Letters IEEE, vol. 10, 127–130.
9. Rohit Chandra IlangkoBalasingham (2015). Detection of brain tumor and localization of a deep brain RF-source using microwave imaging. Antennas and Propagation (EuCAP) 2015 9th European Conference 10. Mohammed et al, B. J. (2014). Microwave
system for head imaging. Instrumentation and Measurement IEEE Transactions, vol. 63 no,1, pp. 117–123.
11. Haoyu Zhang et al (2012). Microwave imaging for brain tumour detection using an UWB Vivaldi Antenna array. Antennas and Propagation Conference (LAPC) 2012 12. Arslan Brian Flynn, H. Z. T. (2013).
13. Jones Mary T. Anita (2014). Design of Vivaldi antenna for brain cancer detection. Electronics and Communication Systems (ICECS) 2014 International Conference 14. L. Teixeira, A. E. F. F. (2014).
Ultra-wideband microwave imaging of breast cancer tumors via Bayesian inverse scattering. Journal of Applied Physics, vol. 115 no. 6, pp. 064–701.