A Model-based Health Monitoring and Diagnostic System for the UH-60 Helicopter Ann Patterson-Hine
William Hindson Dwight Sanderfer
NASA Ames Research Center
Somnath Deb Chuck Domagala
Qualtech Systems, Inc.
Abstract
Model-based reasoning techniques hold much promise in providing comprehensive monitoring and diagnostics capabilities for complex systems. We are exploring the use of one of these techniques, which utilizes multi-signal modeling and the TEAMS-RT real-time diagnostic engine, on the UH-60 Rotorcraft Aircrew Systems Concepts Airborne Laboratory (RASCAL) flight research aircraft. We focus on the engine and transmission systems, and acquire sensor data across the 1553 bus as well as by direct analog-to-digital conversion from sensors to the QHuMS (Qualtech health and usage monitoring system) computer. The QHuMS computer uses commercially available components and is rack-mounted in the RASCAL facility. A multi-signal model of the transmission and engine subsystems enables studies of system testability and analysis of the degree of fault isolation available with various instrumentation suites. The model and examples of these analyses will be described and the data architectures enumerated. Flight tests of this system will validate the data architecture and provide real-time flight profiles to be further analyzed in the laboratory.
Introduction
The rotorcraft community has supported research in health and usage monitoring systems (HUMS) through both industry and government sponsored programs [1,2]. The main emphasis to date has been reduction of vibration and, thus, reduction in maintenance requirements. While high vibration loads are a major cause of wear and damage in rotorcraft systems, it is important to monitor process parameters such as engine
temperature, oil temperature, oil pressure, and chip detection in addition to vibration for complete real-time condition monitoring of the flight system. These parameters provide health status and enable monitoring of the safety of critical systems. Monitoring of the safe operating ranges of parameters such as these provides input to the caution/advisory panel and other displays in the cockpit. Many of the displays are related due to
relationships among the physical parameters, but it is left to the pilot to recognize and utilize these relationships in reasoning about the basic cause of caution/advisory lights. The model-based reasoning approach has much to offer in addressing the problem of failure identification. While current instrumentation and data analysis techniques provide
failure detection, often the true cause of an anomalous condition cannot be determined without a higher order reasoning capability.
The goal of this work is the development and validation of a real-time model-based reasoning system for the RASCAL flight research aircraft. The transmission and engine systems were selected due to their criticality for flight and their level of instrumentation. During the design of the hardware architecture necessary to support the automated reasoning goals, a testability analysis highlighted the importance of signal selection to insure that the necessary information was available to the on-board computer performing the reasoning task. Modifications to the aircraft were made based on analyses performed on the same model that is used by the real-time reasoning software. Using a consistent model during the design phase through operations enabled continuous verification of the models by pilots and aircraft experts and increased confidence in the automated system. This paper describes the model-based reasoning approach used in this research, the hardware and software architecture of the vehicle health monitoring system, the testability studies performed during the design of the system, and progress-to-date in flight validation.
Model-based reasoning approach
A coarse-grain, graphical dependency model was selected for this application in order to allow system-level diagnostics of several helicopter subsystems. Interfaces and
dependencies between subsystems and their components were determined and modeled using multi-signal flow graphs [3,4]. The multi-signal modeling methodology is a
hierarchical modeling methodology where the propagation paths of the effects of a failure are captured in terms of a directed graph. Propagation algorithms convert this graph to a single global fault dictionary for a given mode and state of the system. This dictionary contains the basic information needed to interpret test results and diagnose failures during on-board monitoring. Multi-signal modeling allows the modeler to hierarchically
describe the structure of a system and then specify its functional attributes via signals. It is not a simulation model, and is ideally suited for building accurate low-cost models that can be used by a reasoner in real-time to interpret test results and assess system health. An important aspect of multi-signal modeling is identification of signals – a process in which the modeler summarizes his understanding of the functions of components in the system in terms of their distinct attributes. For this application, it took approximately one month for the modeler to gain familiarization with the transmission system of the Black Hawk so that the system attributes could be accurately described by signals in the multi-signal model. The development of the model took approximately 2 months. The structure of the multi-signal model was derived directly from schematics and maintains a one-to-one relationship with the system compone-to-onents. Several examples of the models developed for this project are given in the next section. The modeling task continued by identifying the field/line replaceable units, adding failure modes of the components, and attaching signals to qualitatively describe the functions of the components. Next, the sensors were
identified as well as the tests that were performed based on their measurements, and these tests were tied to the signals they observe.
Qualtech Systems, Inc. (QSI) provides an integrated diagnostic tool suite based on the multi-signal model which includes TEAMS for system testability analysis and TEAMS-RT for real-time monitoring and diagnosis [5]. A series of analyses was performed on the Black Hawk multi-signal models using TEAMS. Instrumentation modifications were suggested. The real-time diagnostic reasoning system that monitors the Black Hawk during flight runs on the QHuMS flight computer. The details of the testability analyses and the real-time diagnostic system are described in later sections. QSI is a participant in the JAHUMS program providing a demonstration of an integrated support system with Sikorsky Aircraft [2]. Our work complements this program by providing an early proof-of-concept demonstration of on-board model-based diagnosis capability.
RASCAL multi-signal model and testability analysis
NASA Ames Research Center, in conjunction with the US Army Aeroflightdynamics Directorate, has developed the Rotorcraft Aircrew Systems Concepts Airborne
Laboratory (RASCAL) [6] – a JUH-60A Black Hawk helicopter equipped with a full-authority, high-bandwidth, fully-programmable research flight control system. The RASCAL is highly instrumented with the entire crew cab area dedicated to research equipment and crew. The aircraft is instrumented with two MIL-STD 1553 data buses. The availability of the aircraft at Ames, the high level of instrumentation and advanced communications buses, and the familiarity of the diagnostics team members with this family of helicopters were all factors that supported the selection of the RASCAL as a flight testbed for advanced diagnostics research.
The major components that are modeled in this effort appear in the top-level multi-signal model, shown in Figure 1. These include the fuel storage system, the engines, the
transmission, main rotor, and tail rotor. Most of the modeling effort has focused on the engines and the transmission. Two engines are shown providing torque to the
transmission, which in turn is providing torque to the main rotor, and tail rotor systems. The fuel storage system supplies fuel to the two engines. The different systems are interconnected with links that represent actual coupling or dependency. Such couplings could be electrical (e.g., via wires), or mechanical (e.g., a shaft), hydraulic (e.g., a hose), or anything else (physical or abstract) flowing through the system. These interconnecting links are color coded and labeled with the flow for ease of interpretation of the model. For example, the links running from the fuel storage system to the two engines are colored blue and labeled “Fuel” and represent the fuel hoses. The flow of power from the two engines to the transmission and the main rotor and tail rotor systems is colored red and labeled as “Torque.”
An example of an increased level of detail in the hierarchical multi-signal model can be found in Figure 2. The sub-modules of the transmission system consist of a main module, two input modules, two accessory modules, two generators and two hydraulic pumps. Each of these modules is modeled within the transmission. The modules are then
interconnected with links. The torque from engines 1 and 2 are connected to the left and right input modules respectively. Each of these input modules then drives the main module and the accessory modules; therefore, a link is drawn from the input module to the accessory module and from the input module to the main module. Each accessory module drives a generator and hydraulic pump, so red (Torque) links are drawn from the accessory module to the generator and from the accessory module to the hydraulic pump. Red (Torque) links are also drawn to connect the output of the main module to the Main Rotor and Tail Rotor System. Several instrumentation points, represented by circles, are shown in this view. These will be explained in more detail in a later section.
Figure 2. Model detail of transmission.
In the next level of detail, the main transmission, input modules, accessory and chip detector modules are expanded. An advantage of the multi-signal modeling technique is that the model structures follow schematics quite closely, making verification much easier. As an example, the main transmission, shown in Figure 3, is represented by the multi-signal model in Figure 4. Torque enters the main module via the left and right quill shafts, which drive the main bevel gear. The main bevel gear then drives the tail takeoff pinion, the sun gear, and the main bevel pinion of the opposing engine when in freewheel mode. The sun gear drives the planetary gears, which in turn drive the planetary carrier. The planetary carrier drives the lubrication and scavenge pumps and is part of the main rotor shaft, which drives the main rotor. Modules are added to the main module depicting each of these gears and shafts. They are interconnected using red (Torque) links.
Figure 3 - Main Transmission Schematic (Organizational Maintenance, Principles of Operation, Main Transmission and Indicating Systems, A1-H60CA-260-100, January
1999).
Figure 4 - Main Transmission Model
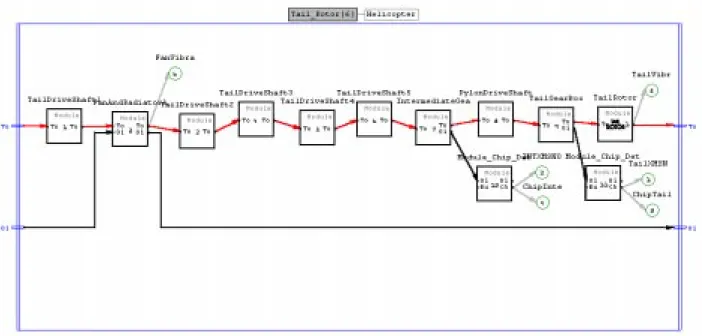
The model of the tail rotor drive train is also a good example of how closely the multi-signal models follow the system schematics. The helicopter drive train assembly is
shown in Figure 5. The tail rotor drive train consists of a drive shaft that transfers torque from the main transmission to the oil cooler drive shaft, four drive shaft interconnected sections that transfer torque from the oil cooler drive shaft to the intermediate gear box, and another drive shaft that transfers torque from the intermediate gear box to the tail gear box. Each of these elements is modeled within the tail rotor system shown in Figure 6 and interconnected with red (Torque) links.
Figure 5 - Helicopter Drive Train Assembly Drawing (Technical Manual, Aviation Unit and Intermediate Maintenance for Army Models UH60A, UH60L, and EH60A
Figure 6 - Tail Drive Train Model
Once the structure of the model has been developed, the locations where there is visibility into the health of the system are identified. Test points are denoted by circles in the multi-signal model and represent instrumentation points. A test point is a location within the model where one or more tests are performed. When defining tests, one or more labels can be assigned to the tests. Then, when the testability analysis is run, it is possible to select a specific category of tests and make conclusions based on the outcome. This capability proved extremely valuable in the current application. The multi-signal models were analyzed by the TEAMS testability analysis software and the ability of the QHuMS systems to detect and isolate the modeled failures was determined.
The testability of the RASCAL systems was analyzed using TEAMS to characterize expected coverage of an on-board monitoring and diagnostic system which would utilize currently available instrumentation and data paths. A summary of the tests whose results are modeled using the QHuMS label appears in Table 1. Only the 9 parameters available originally on the 1553 bus provided input to the model at the start of this project. The testability figures of merit (TFOMS) using these 9 parameters indicated that there would be 26% fault detection and 5% isolation for the systems modeled. The additional 11 tests in Table 1 were easily obtainable from the basic UH-60 cockpit instrumentation, so the Black Hawk was modified to provide these parameters to the QHuMS computer via 28vdc discretes. The TFOMS for this configuration are 67% fault detection and 9% fault isolation. The UH-60 caution and warning panel is shown in Figure 7 with the additional 11 signals routed to the QHuMS system indicated with red/dark outlines. The signals included in the multi-signal model but not routed to the QHuMS system are indicated with yellow/light outlines.
The Appendix lists all of the test points defined within the transmission model and the tests assigned to those test points. By categorizing the tests using labels, testability
analysis can be performed for various levels of instrumentation accessible to the onboard reasoner, and the anticipated fault detection and isolation capabilities can be quantified. If all of the onboard tests included in the model are utilized, 98% fault detection and 29% fault isolation is achievable. This suite of tests includes Pilot Observable (including, but not limited to, the Vertical Indicating Display System (VIDS) and the Caution Advisory System), Vibration, and 1553 test groups. The QHuMS group is a subset of this group, so it does not need to be included explicitly for this analysis. The Vibration group focuses on the speeds of components in the main drive train and the tail drive train. For instance, the engine input drive shaft operates at 20,900 RPM, the main rotor head at 258 RPM, the tail drive shaft at 4110 RPM, and the tail rotor at 1190 RPM. Tests are defined at these major frequencies. If the QHuMS group and the Vibration group are utilized, TEAMS-RT would be able to detect 88% of failures and isolate 13% of them.
Two flight research pilots, one a specialist in maintenance of UH-60s, verified that the model was an accurate representation of the systems addressed in this effort. The pilots were comfortable with the multi-signal modeling technique after a very brief introduction (less than 30 minutes) and were able to navigate the model on their own to review the lower level details. One feature of TEAMS that proved useful in the model verification is the display of fault propagation and corresponding sensor coverage on the graphical model. The pilots were able to use this feature to check the model with respect to assumed system behavior based on their experience. Pilot confidence in the model representation is crucial to any future application of TEAMS-RT for providing real-time decision-aiding to the pilot when diagnosis system malfunctions in flight.
Test Test Description Label Source Fuel_Rate_L_1553 Monitor the rate at which fuel is being
consumed by Number 2 engine. Note any exceedences.
QHUMS 1553
Fuel_Rate_R_1553 Monitor the rate at which fuel is being consumed by Number 1 engine. Note any exceedences.
QHUMS 1553
Engine1_Np_1553 Np Speed was high during normal flight operations.
QHUMS 1553
Engine2_Np_1553 Np Speed was high during normal flight operations.
QHUMS 1553
Engine2Torque_1553 Engine2Torque QHUMS 1553
Engine1Torque_1553 Engine1Torque QHUMS 1553
Engine1_Ng_Speed_1553 Ng speed exceeded during normal flight normal operation.
QHUMS 1553
Engine2_Ng_Speed_1553 Ng speed exceeded during normal flight normal operation.
QHUMS 1553
Rotor_Speed_1553 % RPM Rotor speed not in green range QHUMS 1553
Pilot_Observe_Oil_Temp_2 The MAIN XMSN OIL TEMP capsule
on the caution/advisory panel is ON.
QHUMS MCWP
Pilot_Observe_Oil_Press_2 The MAIN XMSN OIL PRESS capsule
on the caution/advisory panel is ON.
QHUMS MCWP
Pilot_Observe_Tail_Rotor_Chip The CHIP TAIL XMSN capsule on the caution/advisory panel is ON.
QHUMS MCWP
Pilot_Observe_Intermediate_Chip The CHIP INT XMSN capsule on the caution/advisory panel is ON.
QHUMS MCWP
Pilot_Observe_INT_Oil_Temp The INT XMSN OIL TEMP capsule on the caution/advisory panel is ON.
QHUMS MCWP
Pilot_Observe_MainMdl_Chip The CHIP MAIN MDL SUMP capsule
on the caution/advisory panel is ON.
QHUMS MCWP
Pilot_Observe_Accessory_Chip The CHIP ACCESS MDL-RH capsule on the caution/advisory panel is ON.
QHUMS MCWP
Pilot_Observe_Accessory_Chip The CHIP ACCESS MDL-LH capsule on the caution/advisory panel is ON.
QHUMS MCWP
Pilot_Observe_Input_Mdl_Chip The CHIP INPUT MDL-RH capsule on the caution/advisory panel is ON.
QHUMS MCWP
Pilot_Observe_Input_Mdl_Chip The CHIP INPUT MDL-LH capsule on the caution/advisory panel is ON.
QHUMS MCWP
Pilot_Observe_Tail_Oil_Temp The TAIL XMSN OIL TEMP capsule on the caution/advisory panel is ON.
QHUMS MCWP
QHuMS Flight Computer
The QHuMS computer was developed by QSI under a NASA SBIR contract NAS2-99048. It is designed to host the TEAMS-RT software on-board the RASCAL and perform real-time monitoring and diagnostic functions. The core system consists of a dual Pentium III 450 MHz CPU card, a 9GB hard drive, cooling fan, and standard power supply housed in a ruggedized chassis with an 8 slot PICMG industrial backplane. Power is supplied by the UH-60 which powers the chassis cooling fan and provides power to the internal supply. A Jaz drive is located outside the chassis. Several PCI cards are located on the backplane, including a 1553 card, discrete I/O and A/D cards to receive data from the aircraft and a SCSI card to interface to the Jaz drive. The system architecture is depicted in the block diagram below (Figure 8). Figure 9 shows the QHuMS computer mounted in the UH-60.
Figure 9 - TEAMS-RT computer installed on RASCAL.
The QHuMS computer was designed and developed using commercial-off-the-shelf (COTS) components which provide generous processing capability at low cost. The components were packaged in a ruggedized chassis specially configured to accommodate the vibration and temperature environment of the RASCAL research helicopter. This tailored adaptation of COTS hardware greatly lowered the cost compared to industry HUMS efforts. The constraints placed on the system due to these design decisions was determined to be satisfactory for the research program the system is supporting.
Flight tests
Flight tests of this system are underway as of March 2001. At the time of this writing, we are verifying the data paths on the aircraft. The flight tests will validate the data
architecture in real-time and will provide performance information for the on-board reasoner. The QHuMS hardware system will also be validated in the vibration environment characteristic of the Black Hawk helicopter. Data will be recorded for further validation of the model-based reasoning capability in the laboratory using seeded faults in a simulation environment.
Conclusions
This research is demonstrating that model-based reasoning systems can augment
traditional HUMS architectures with increased fault detection and isolation capabilities. A low-cost, COTS hardware architecture is coupled with a commercial diagnostic software suite to provide analysis of HUMS instrumentation during design of diagnostic reasoning systems and on-board, real-time diagnostics. The multi-signal model is easily understood and verified by maintenance personnel and pilots. The on-board system utilizes the same model developed for design activities which increases the confidence of the flight crew in the automated system.
Future work includes additional aircraft instrumentation suggested by the testability analysis and migration of the system from a monitoring capability to an in-flight crew advisory system. The higher level of fault detection and isolation available by including modest vibration monitoring indicates that the addition of an accelerometer to the sensor suite will have a large payoff. Keeping the crew involved in the development and verification of the sensor architecture with TEAMS, validation of the performance of TEAMS-RT in the flight environment, and continued review of diagnostic information available from TEAMS-RT during flight using recorded flight data and a simulation tool will assure crew confidence in the system for in-flight advisories. The provision of greater depth in system assessment when faults are detected and automated synthesis of system interrelationships to enhance fault isolation would enhance the safety of rotorcraft flight.
Appendix
The test categories used in the multi-signal transmission model are summarized in the table below. The test labels used to group the tests for analysis purposes are defined as follows:
1. 1553 – These are tests which can be accessed over the 1553 bus.
2. COSSI_HUMS – Tests defined as COSSHUMS are onboard tests currently used under the COSSI HUMS program.
3. Vibration – Vibration tests are those which detect an excessive vibration at a particular frequency. The frequency value will usually indicate which modules in the drive train system are defective. The test results are obtained through the use of accelerometers placed at strategic locations throughout the helicopter.
4. Pilot Observable – Test results that can be observed by the pilot during flight are assigned this label. They include, but are not limited to, Vertical Indicating Display System (VIDS) and the Caution Advisory System.
5. VIDS – VIDS tests are analog signals that are presented to the pilot as a graphical indication of drive train parameters. They include the oil pressure and temperature of the main transmission system.
6. Caution Advisory – The caution advisory panel within the cockpit is a series of lights that
illuminate when the pre-determined threshold of a helicopter parameter has been exceeded, indicating a possible system failure. They include metal chips in the accessory modules, input modules, main module, intermediate gear box, tail gear box, failure of the #1 or #2 generators, failure of the #1 or #2 hydraulic pumps, main transmission oil temperature or pressure exceedance, intermediate gear box oil temperature exceedance and tail gear box oil temperature exceedance.
TEST POINT NAME TEST NAME 1553 COS S I_ HUM S V ibrat io n P ilo t Ob s e rv abl es VID S Caut ion A d v is o ry QHuMS VibrationC_4116 X Engine1Start X Engine2Start X Fuel_Rate_R_1553 X X X Fuel_Rate_L_1553 X X X Engine1Torque_1553 X X X X X Engine2Torque_1553 X X X X X Vibration_258 X Vibration_1207 X CabinVibration_and_Torque Vibration_451 X Vibration_258 X Vibration_1207 X Vibration_451 X Vibration_4116 X Vibration_3319 X Vibration_1190 X Vibration_20900 X Vibration_11809 X Aircraft_Vibrations Vibration_5750 X FanVibration Vibration_4116 X No1_Fuel_Low(CA) No1_Fuel_Low(CA) X X No2_Fuel_Low No2_Fuel_Low X X
No1_Fuel_FiltBypass(CA) No1_Fuel_ FiltBypass(CA) X X
Chip_Engine(CA) Chip_Engine X X X Eng_Oil_Temp(CA) Eng_Oil_Temp X X X No1_Eng_Fuel_Low_Pressure(CA) No1_Eng_Fuel_Low_Pressure X X Pilot_Observe_Eng_Oil_Press_1 X X Engine_Oil_Pressure_Gauge Pilot_Observe_Eng_Oil_Press_3 X X TGT_To_VIDS TGT_To_VIDS X X X Np_To_VIDS(PDU) Np_1553 X X X X X Torque_To_VIDS(PDU) Torque_To_VIDS X X Ng_Speed_To_VIDS(CDU) Ng_Speed_1553 X X X X X INTXMSNOilTemp Pilot_Observe_INT_Oil_Temp X X X X ChipIntermediateMdl Pilot_Observe_Intermediate_Chip X X X X Vibration_3319 X Vibration_1190 X TailVibration VibrationT_4116 X TailXMSNOilTemp Pilot_Observe_Tail_Oil_Temp X X X X ChipTailRotorMdl Pilot_Observe_Tail_Rotor_Chip X X X X Rotor_Speed_1553 Rotor_Speed_1553 X X X X X
TEST POINT NAME TEST NAME 1553 COS S I_ HUM S V ibrat io n P ilo t Ob s e rv abl es VID S Caut ion A d v is o ry QHuMS Vibration_20900_R X Vibration_11809_R X Vibration_7188_R X Vibration_5750_R X InputRVibration Vibration_Ng_R X No2Gen Pilot_Observe_Gen_2 X X HydraulicLight1 Pilot_Observe_Hydraulic1 X X ChipAccessoryMdl Pilot_Observe_Accessory_Chip X X X X ChipInputMdl Pilot_Observe_Input_Mdl_Chip X X X X MainXMSNOilTemp Pilot_Observe_Oil_Temp_2 X X X Pilot_Observe_Oil_Press_1 X X XMSN_Oil_Pressure_Gauge Pilot_Observe_Oil_Press_3 X X ChipInputMdl Pilot_Observe_Input_Mdl_Chip X X X X ChipMainMdlSump Pilot_Observe_MainMdl_Chip X X X X HydraulicLight2 Pilot_Observe_Hydraulic2 X X XMSN_Oil_Temperature_Gauge Pilot_Observe_Oil_Temp_1 X X X Vibration_20900_L X Vibration_11809_L X Vibration_7188_L X Vibration_5750_L X InputLVibration Vibration_Ng_L X MainXMSNOilPress Pilot_Observe_Oil_Press_2 X X X ChipAccessoryMdl Pilot_Observe_Accessory_Chip X X X X No1Gen Pilot_Observe_Gen_1 X X References
1. R.E. Hayden and R. Muldoon, “US Navy/USMC/BF Goodrich IMD-COSSI Program: Status,” Proceedings of the American Helicopter Society Annual Forum, Montreal, Quebec, Canada, May 25-27, 1999.
2. David J. Haas, et al, “Joint Advanced Health and Usage Monitoring System
(JAHUMS) Advanced Concept Demonstration (ACTD),” Proc. of the 53rd American Helicopter Society Annual Forum, Virginia Beach, VA, May 2-4, 2000.
3. S. Deb, Krishna Pattipati, Vijay Raghavan, Mojdeh Shakeri, and Roshan Shrestha, “Multi-Signal Flow Graphs: A Novel Approach for System Testability Analysis and Fault Diagnosis,” Proc. IEEE AUTOTESTCON, Anaheim, CA, pp. 361-373, Sept. 1994.
4. Somnath Deb, Sudipto Ghoshal, Amit Mathur, Roshan Shrestha, and Krishna R. Pattipati, “Multisignal Modeling for Diagnosis, FMECA, and Reliability,”
Proceedings of the IEEE Conference on Systems, Man, and Cybernetics, San Diego, CA, October 11-14, 1998.
5. Somnath Deb, Krishna Pattipati, and Roshan Shrestha, “QSI’s Integrated Diagnostic Toolset,” Proceedings of the IEEE AUTOTESTCON, 1997.
6. Philip John Ellerbrock, Zsolt Halmos, and P. Shanthakumaran, “Development of New Health and Usage Monitoring System Tools Using a NASA/Army Rotorcraft,” Proc. Of the 55th American Helicopter Society Annual Forum, Montreal, Quebec, Canada, May 25-27, 1999.