The difference in the outcomes of educational
attainment between students with and without a
migration background
AVIVAH HOEFDRAAD
Student number: 1969161
Leiden University – Faculty Governance and Global Affairs
ECONOMICS AND GOVERNANCE
Year: 2017/2018
Supervisor: Prof. dr. M.G. Knoef
Second reader: Dr. P.W. van Wijck
2
Graduation Thesis
Master of Economics and Governance
Leiden University – Campus The Hague
Author: Avivah Hoefdraad
Supervisor: Prof dr. Marike Knoef
(Leiden University, The Hague, the Netherlands)
Date: 03-12-2018
3 Table of contents
Abstract ... 5
Foreword ... 7
I. Introduction ... 8
1.1 Scope of the document ... 8
Main research question ... 9
Sub-questions: ... 9
II. Literature review ... 13
2.1 General and common factors ... 13
2.2 Financial situation of students parents... 14
2.2.1 Wealth ... 14
2.2.2 Income ... 15
2.2.3 Greater need for financial contribution parents and scholarship ... 16
2.3 Education level of parents ... 18
2.4 Stress, pressure and time ... 18
2.5 Conclusion ... 19
III. Research design ... 21
3.1 Research approach and design ... 21
3.2 Methodology ... 22
3.2.1 Research methods ... 22
3.2.2 The description of the variables ... 24
3.3 Data ... 25
3.4 Sample selection ... 26
3.5 Descriptive statistics ... 27
IV. Result of research and analysis ... 35
4.1 Multiple regression analysis of students without migration background ... 36
4.2 Multiple regression analysis of students with a migration background ... 37
4.3 Regression analysis with interaction terms ... 40
4.4 Results of the Blinder-Oaxaca decomposition ... 41
4.5 Summary ... 43
V. Final conclusion ... 45
4
VII. Recommendations for further research ... 48
VIII. Obstacles and limitations ... 50
Afterword ... 52
5 Abstract
Students are important for the economy of the Netherlands. Higher education can result in economic growth as students are able to expand their knowledge and skills. A large part of the students in the Netherlands participate in higher professional education and many of those students have a migration background. It is argued that there are large differences between students with a migration background and students who do not have a migrant background, in particular in the educational attainment. It is also claimed that the difference in educational attainment could be explained by factors related to ethnicity and the background of parents. Two factors related ethnicity, which are the financial situation and the educational background of parents, are central in this study and are empirically examined. The Dutch government aims to improve the quality of education for every student and to provide a school system that allows students to be more equal and prepared for the labor market. With that in mind, it has been investigated if these factors can explain the difference.
This master thesis addresses the question to what extend the difference in educational outcomes between students with and without a migration background who participate in higher professional education can be explained by the two factors related to ethnicity. In order to answer this research question, empirical research is performed. The Studentmonitor database is the main provider of data that are utilized in this study. The data provide information of students who participate in higher professional education in 2015. The total number of students participating in this research is 6,358. Two different groups, group M and group B, take an essential part of the empirical analysis. Group M in this study consists out of students with a migration background who participate in higher professional education. Group B consists out of students participating in higher professional education without a migration background.
In order to empirically examine if the financial situation and the educational background of parents can explain part of the difference in educational attainment between the two groups, three different multiple regression analyses are performed. The first regression analysis gives emphasis to students without a migration background. And the second regression analysis is focused on students with a migration background. The final regression analysis is the multiple regression including interaction terms. It shows the results of the independent variables that have been interacted with the variable migration, with the aim of explaining and determining whether there are significant differences between the groups of students or not. Besides the regression analyses including the zero statistical tests, a Blinder-Oaxaca decomposition is carried out as it can provide the explanation of the difference in the mean value of the dependent variable, study progress compared to the program, between Group M and Group B.
6
have a lower educational attainment. However, these significant differences disappear after correcting for male and age. The significant differences that are found can to a very small extent be explained by the financial situation of parents.
Based on the findings of this research, three policy recommendations are formulated in order toreduce inequality between group M and B. First, the results show that the education level of parents, the financial contribution of parents and income from additional scholarship do not have a major influence on the significant differences. For that reason, the recommendation is to exclude that these factors are fundamental for the inequality in education. Second, is to recommend the Ministry of Education, Culture and Science to carry out further research on the difference in outcomes, with the aim of finding explanatory factors that are significant. In this way, it can be possible to determine the factors that can explain the difference between the groups of students to a larger extend. And to create policies that may be effective in reducing inequality between students at universities of applied sciences and in Dutch education. Third, the empirical analysis showed that the socio-demographic characteristics and independent variables male and age are significant for students without a migration background. In order to identify if the composition of the groups or other factors correlated with male and age matter, I would recommend the Ministry of Education, Culture and Science to carry out further research and to set up a project with scholars, teachers and students. In this way, policy-makers can be acquainted with the causes of the significant affects that these two background characteristics have on students. If there are indeed differences between men and women which cause female students to have a lower educational attainment? Then it is possible for policy-makers to implement a policy and to tackle the inequality in education.
7 Foreword
At the beginning of the first semester, I was informed by the Olaf van Vliet, the coordinator of the MSc program Economics and Governance about writing a master thesis with a topic related to the program. I immediately knew that I wanted to choose a topic that I have a strong interest and connection with. The topic of this study is focused on the difference in educational outcomes between students with and without a migration background who participate in higher professional education. And to what extend this difference can be explained by factors related to ethnicity? This topic is very appealing to me and I want to be more acquainted with this topic because I noticed that many of my friends who have a migration background were often studying with many special conditions, while this was not the case for most of my friends who did not have a migration background. The difference in the educational attainment between the two groups allows for the discussion of different perceptions and opinions of scientific researchers on a national and international basis. Moreover, the empirical analysis and the reviewing of literature allows for the examination of scientific facts and the reasoning behind their fundamental theories and ideologies. My expectation is that this master thesis can help me to have a clear comprehension of the economic-policy issue and how to recommend policy-makers on how to acquire more equality in higher professional education
I hope you will enjoy reading this master thesis,
8 I. Introduction
A shift in the education level has been noticed as the number of students that graduate from higher education has been increasing over the years (CBS, 2013). This is a positive development because higher education improves the economic growth in a country (Hanushek, 2016). However, different sources are indicating that there is a significant difference in the educational attainment between students with a migration background and students without a migration background (Dronkers, 2010, p.5, p.18; Ooijevaar, 2010, p.37). Moreover, on average, students with a migration background are lower educated than students without a migration background (CBS, 2013). The Dutch government is striving to improve the quality of education for every student and to provide a school system that allows all students to be prepared for the labor market. In 2011, The Committee on Future-proof Higher Education System, found that the Dutch higher education system was not future-proof in its current form (OCW, 2011). In view of that, the Dutch government not only decided to invest more funds in the education system, but also to provide less financial resources to individuals who are registered at an educational institution. These definitive decisions were ought to be processed and implemented in January 2015 (PVDA, 2014).
Despite the objective of the Dutch government to improve the quality of education, there seem to be large differences in the outcomes of educational attainment between students with a migration background and students who do not have a migration background. The difference in educational outcomes between the two groups of students are relatively small on academic level, however, for students who participate in higher professional education, also known in the Dutch language as ‘Hoger Beroeps Onderwijs’, the differences in educational attainment between the groups are much higher (Wolf, 2007; Studentenmonitor, 2018). Why is there a difference? And can fundamental factors such as the financial situation or educational background of parents explain the difference? For that reason, this research has been designed to investigate and find out the differences in educational outcomes between these two groups of students that study on the level of higher professional education. And to examine if and to what extend these factors can explain these differences.
1.1 Scope of the document
9
analyzed, with the aim of providing final recommendations to policy-makers on how to aim and acquire for more equality in higher professional education.
1.2 Research question
A prominent development since the inflow of immigrants to Western European countries in the 1980s and afterwards is that students with a migration background tend to participate in lower educational levels than students with very similar characteristics which do not have a migration background (CBS, 2016). The educational background can in many cases be very influential in a person’s life and can determine a person’s success (UNICEF, 2018). Research results suggest that factors related to ethnicity and the background of parents, can explain part of the differences between the educational attainments of different ethnic groups (Lan Rong & Grant, 1992). In view of that, this study has been designed to provide an extensive and empirical analysis on the educational attainment of students with and without a migration background who participate in higher professional education. The sample only consists out of students who participate in higher professional education because the difference in educational attainment between the two groups is much higher in higher professional education than on academic level (Studentenmonitor, 2018). Is there indeed a difference in the educational attainment between the students? Does the background and involvement from parents matter? And can I find empirical evidence for these claims. Therefore, I have created the main research question and sub-questions for this study, which are stated below this paragraph.
Main research question: “ To what extend can the difference in the outcomes of educational attainment between students with and without a migration background who participate in higher professional education be explained by factors related to ethnicity?”
Sub-questions:
To what extend can the difference in the outcome of educational attainment between
students with and without a migration background who participate in higher
professional education be explained by the financial situation of their parents?
To what extend can the difference in the outcome of educational attainment between
students with and without a migration background who participate in higher
10
The main research question for this study has been descent from theory as explained above. Correspondingly, the sub-questions are also derived from theory related to ethnicity and educational attainment. Two factors correlated with ethnicity have been selected for the examination of the effects on the educational attainment of students in higher education. These factors are (1) the financial situation of parents and (2) the education background of parents. Both factors are aligned with its sub-question. The factors have several components such as the education level of the mother and father, the financial contribution from parents and the income from additional scholarship that in this study determine the educational background and the financial situation of parents. These are also components on which a student has no influence on.
1.3 Key concepts
This section describes the key concepts of this study. The concept migration background is defined as an individual’s characteristic which is based on if and when, the individual, the parents or ancestors have become migrants. In this study we define students with a migration background as the first and second generation of immigrants. This implies that only individuals from a first or second generation can represent the part of the research group that consists out of students with a migration background. The remaining students are defined as students without a migration background. Hence, if an individual belongs to the third generation or if they only have a Dutch background, they are considered to be an individual without a migration background (CBS, 2016). Furthermore, the concept educational attainment is in relation to study progress compared to nominal study. Thus, the concept refers to the progress of students relatively to their study program.
In the Netherlands there is often a distinction made between two educational levels for students, after secondary education (high school). First, there are Community colleges which are institutions for vocational education ‘Middelbaar Beroeps Onderwijs’. Second, is higher education ‘Hoger Onderwijs’ which includes universities and universities of applied sciences. To be more exact, higher education only concerns bachelor and master level of education (Studentmonitor, 2018). Students that go to universities of applied sciences are part of higher education and are recognized as students who participate in higher professional education (HBO/ Hoger Beroeps Onderwijs). In this study, focus is not on vocational education or on all levels of higher education, but is limited to students who participate in higher professional education within the Dutch schooling system. Thus, the definition of educational attainment is with reference to participating in higher professional education. In this matter, the concepts for this research are aligned with the aim of this study which is to find out to what extend can the difference in the outcomes of educational attainment between students with and without a migration background that study on higher professional education level be explained by factors related to ethnicity.
11 1.4 Academic and social added value of the study
Lan Rong & Grant (1992) argue that factors related to ethnicity can explain the differences between the educational attainments of different ethnic groups (Lan Rong & Grant, 1992). They performed an Ordinary Least Squares (OLS) multiple regression and made use of both the effects of generation and ethnicity on the years of schooling. They included data from previous schools including elementary school until college completion level in order to measure the difference among the ethnic groups. This study, however, contributes to existing knowledge by having students who participate in Dutch higher professional education as the focal point. Furthermore, in this study, only a distinction is made between students with and without a migration background. No distinction is made among the different groups of students with a migration background. This study is only focused on the difference between the two groups, M and B, and is not focused on the differences between multiple ethnic groups that differ in ethnic and cultural background. In this way, it is possible obtain a clear view of the difference in outcomes between group M and B only, and not to obtain different results in educational outcomes between, for example, Asian and Hispanic students (Lan Rong & Grant, 1992 ; Price, 2004).
Next to the differences in the research approach, this study aims to provide final recommendations to policy-makers based on empirical evidence on how to aim for and acquire more equality in higher professional education in the Netherlands. Nowadays, government bodies perceive empirical research and evidence-based policymaking from data as an added value (de Laaf, 2017). Policy-makers use information in order to achieve policy goals. Empirical research and data gives them the opportunity to make righteous decisions and to get support from voters, other politicians and civil servants in the policy arena (de Laaf, 2017). Furthermore, this study intends to create acknowledgement for the difference in educational attainment between the groups and to create a greater understanding among politicians and the public about status quo. This study also intends to ask for attention to the policy decisions related to education and reducing inequality education, that have been made up to this point.
1.5 Reading guide
12
further research are described with great attention and accuracy in chapter 7. The last chapter extensively discusses the obstacles and limitation of this study.
13 II. Literature review
Policy-makers try to create policies that improve the quality of life. Education is generally perceived as a very important component for the success of an individual’s life (UNICEF, 2018). Every day the minister, managers and employees of the Ministry of Education, Culture and Science invest a lot of time to reach the targets that are set to help people in society (OCW, 2017). They aim to make sure that everyone can experience education of high quality. However, statistics show that students with a migration background have different outcomes of educational attainment (CBS, 2018). Could it be the case that the quality of education is weaker for this group? Or could there be other factors that can explain this development. Empirically studying if there is a difference in the effects of factors related to ethnicity and migration background, on the groups of students is of high importance in order to describe the difference in the educational attainment. The aim of the literature review is to concentrate on books and articles which have been published in recent years about ethnicity and educational attainment. In this chapter, the theory related to the thesis subject will be reviewed. Identifying the effects of ethnicity on educational attainment involves a deep understanding of the differences between students with and without a migration background.
2.1 General and common factors
Over the years, multiple researchers have conducted research and examined the effects of ethnicity on the educational attainment. Some scholar put emphasis on the influence of ethnicity on the attainment of students and found a significant negative effect. Conversely, the school type and gender of students has less influence (Jobbins, 2014). Prior studies have found positive and negative significant differences in school attainment between ethnic groups (Heath & McMahon, 1997) (Lan & Grant, 1992). Xue Lan Rong & Linda Grant (1992) argue that factors related to ethnicity can explain the differences between the educational attainments of different ethnical groups. A study shows that, the longer a student is a residence of the country or the higher the number of generations you belong to, the more a person’s school attainment improves (Lan Rong & Grant, 1992).
14
a migration background are more frequently living with unemployed family members who have less financial resources to invest in their children’s study progress.
Not only factors outside of school can affect the attainment of a student but also inside of school factors can have an effect. Researcher Farkas (2003) found that factors related to ethnicity can have a major affect on the educational achievement of an individual. He argues that there is often still a clear difference as some ethnicities on average perform worse. It can also be the case that university teachers have low expectations of students with a migration background which causes a difference in the school attainment between students with and without a migration background. Teachers may discriminate and have low expectations of students from certain ethic groups. It is argued that these groups of students are expected to perform poor or poorer and that teachers have a tendency not to encourage them. Ultimately this could result in less development of students and therefore also a weaker performance (Farkas, 2003).
Despite low expectations and discrimination of teachers, students are habitually required to make use of their writing and language skills. In cases where language proficiency plays a major role and much has to be written, students with a migrant background more frequently have insufficient grades. Even if it concerns a test that is not about individuality but about networking, students with a migrant background more frequently have insufficient grades. The cause of this problem would be the cultural background. Former research has shown that precisely the network is often of poorer quality among students with a migrant background. Students with a migrant background often do meet the language requirements but are repeatedly given a lower grade than their fellow students that do not have a migration background. This impedes the transfer to the follow-up study program (Maarse, 2017).
2.2 Financial situation of students parents
2.2.1 Wealth
15
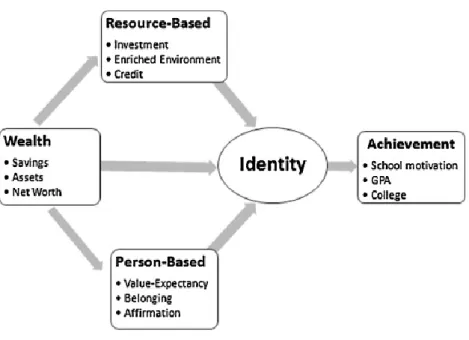
Destin (2013) argues that there are three different factors that influence the identity and ultimately the educational achievements of a person. Resource-based factors are related to resources of students to perform in school. Person-based factors are more focused on the personal goals and expectations of students related to school. Identity takes a central role as a mechanism that connects the observable influence of resources into the role of motivation and into cognitive factors that encourage school achievement. For example, the person-based factor entails that when students feels that they have found their ‘place’ in the learning institution, they have a higher probability to be a better student. Resource-based suggests that when parents have more wealth they invest more in their children’s education. However, there is one factor that also influences the other factors. This is the factor wealth, which is related to the financial capabilities of students and affects the Resource-based and Person-based factors. Wealth may affect the identity, for example, how a person feels or to which groups they want to belong to. The three factors that influence the educational achievement are illustrated in Figure 1.
Figure 1: Achievement outcomes
Figure 1: The three types of factors that influence outcomes in school achievements according to Destin (2013).
2.2.2 Income, debts and expenses
16
with a migration background often have worse jobs and lower salaries than people without. People with a migration background often not only have less income. Another research found that there are differences in debts between students of different ethnic groups. Moreover, low-income groups also have more (student) debts (Heller, 2001). Derek Price (2004) examined the relationship between educational debt burden among students and ethnicity. The results show that among student borrowers, Black and Hispanic students invest more money in schooling as they are more likely to borrow money and to pay (higher) interest rates. He also suggest that students with high educational debt burdens are borrowing more for college and have lower average salaries than other students. According to his theory students who have a lower– income with a migration background have a significantly greater risk of having an excessive educational debt burden such as student loans (Price, 2004). Somer and Cofer also examined the effects of expenses on education and agree with Price on the disadvantages of cost and expenses on schooling. They also argue that debts affect the success of students in college and their decision after a bachelor program (Somer & Cofer, 1999).
2.2.3 Greater need for financial contribution parents and scholarship
In 2014, the Dutch government parties agreed upon a new policy proposal, which was created by the prior Minister of Education Mrs. Bussemaker, to reduce inequality in education and to improve the quality of education (PVDA, 2014; Rijksoverheid, 2018). This research is based on the period of year 2015, in which political decisions changed the prospects for students. Since 1 September 2015 to be exact, the new policy was implemented at the beginning of a new school year. Making decision in order to solve policy issues is what policy-makers do. However, this policy does come with a price tag. In order to finance the educational quality impetus that is needed to make the improvements, the following policy measures were taken that could affect students who participate in higher professional:
• Changing the social loan system through a longer repayment period.
• Shortening student travel law.
• Modernizing the service to all students including easier regulations.
17
they need more money to pay for the cost of schooling, they can loan money from the government instead.
The Ministry of Education, Culture and Science considers these three measures to be justified. It is based on the fundamental idea that studying is an investment for an individual’s future and that the accessibility is guaranteed by the student loan system (OCW, 2011). However, according to a different source, these measures would imply that studying is more expensive and that students with a migration background are more likely to have parents with a lower income than students without a migration background. A larger number of students may need financial support from their parents in order to finance their study costs than they would before the implementation of the investing law (NIBUD, 2017). This could make it more difficult for students with a migration background to pay for a study and to have a study progress that is equal to that of students without a migration background.
According to NIBUD, which investigates the changes in the student finance system, parents grant their children with a financial contribution so that students can pay for their study costs and living expenses (NIBUD, 2017). Besides the income that students receive from their parents another possible source of income for students who participate in higher professional education is income from additional scholarship. Dutch students can receive income from additional scholarship, but only if they have parents with a ‘low’ income. The maximum monthly income from additional scholarship for students who participate in higher professional education is € 255,57 for students who live at home and € 277,41for students who do not live at home. Before the implementation of the new law in 2015, this amount was € 389,16 (DUO, 2017). Consequently, this type of scholarship and its amount is dependent on the income level of the parents. In this way, the parents and the government can influence the income, debts and expenses of students. In order to meet the income limit requirements for receiving an addition scholarship, parents must not earn more than €48.500 per year (DUO, 2018). A student can receive income from additional scholarship for a maximum of 4 years until the age of 30 years (DUO, 2018). After this period, a student has the possibility to borrow from DUO for a maximum of 3 years.
18
their study progress due to a lack of income and wealth. Price (2004) would agree with this claim. His theory suggests that the differences between students with and without a migration background will only increase once costs and debts are increasing. Another reason why the changes in policy are relevant for this study is because the effect the income, basic scholarship and financial contribution of parents. And these are all components of what can partly explain the difference in educational attainment between the two groups of students.
2.3 Education level of parents
According to Statistics Netherlands, the educational performance of individuals is strongly related to the home situation. Having low-educated, non-working or single parents and a low household income increases the chance of early school leaving (Verhoef, 2014). The level of education of immigrant parents is lower than that of parents without a migration background (NJI, 2013 p.4). A study from Statistics Netherlands shows of all students participating in higher professional education, the percentage that achieves the required ECTS (study points) in the first year of the study program, is much higher for students that have highly educated parents than students with low educated parents (CBS, 2001). It is based on the fundamental idea that not just the environment in general but in particular the education level of the parents is an essential factor related to ethnicity that affects the school attainment of students taking part in higher professional education. A report from Britain’s Statistics confirms this claim as they found empirical evidence that the education level of the mother is an important factor. They also found that the education level of the father is more important and is a much stronger factor than the education level of the mother in determining success at school (Tonkin & Serafino, 2014). Socioeconomic factors such as family income and the child’s achievements are also influenced by the education level of parents. For that reason it is argued that the education level of the parents indirectly influences the parental expectations and the home environment (Davis-Kean, 2005).
2.4 Stress, pressure and time
19
stress due to struggles with household responsibilities and trying to achieve good grades in school. In addition, some students feel more pressure because they were not able to get equal education in the country where they were born.
Furthermore, in many cultures it is tradition, and the expectation, to have responsibility over the family. In particular women are expected to do more work at home and men to have the financial responsibility. The authors that found evidence for these statements also made recommendations about these conditions. They recommend that parents need to be involved in their children's school activities and that these activities do not have to be academically related in order to show appreciation (Duongtran, Lee & Khoi, 1996). Another research confirms this claim and emphasizes the importance of parental involvement in school. Parents that are involved in the school activities and progress of their children have a higher educational attainment than that the children whose parents are not (Zellman & Waterman, 1998).
Parents who have too little income and too many debts are often suffering from stress. Additionally, they have a higher probability to feel less well and to become uncertain about their role as an educator. This could have an effect on their children when growing up (NJI, 2015). Students can perform better or worse at school due to pressure (Baumeister, 1984) (Knobel, 2010). Several sources suggest that studying under pressure and with lots of stress can cause insomnia, headaches and abdominal pain and even worse complaints such as a burnout (TPO, 2017) (RIVM, 2017). This development could negatively affect the school attainment of students. Since students with a migration background and their parents more often have little or less income, and suffer from more pressure and stress. A study shows that family income and ethnicity influence the expectations and the school performance. In particular for low income families. This effect is much less for students from families with a high income (Desimone, 1999). Another study suggests that children from stepfamilies and single-fathers consistently have a lower educational attainment due to their family structure and lower-status occupational position, for example, due to a low income of the parents. Children that live with their biological parents or with a single mother have a higher educational attainment (Biblarz & Raftery, 1999).
2.5 Conclusion
20
21 III. Research design
The research design chapter describes the methods and the steps to be taken in order to collect
and analyze the data. This chapter also explains how the research will be conducted and
discusses the importance of the hypotheses. Furthermore, all variables related to the two factors related to ethnicity and the regression equations are explained in detail. And in order to measure the concepts, the operationalization and the research approach are be specified in detail.
3.1 Research approach and design
This section defines the research approach and the design of this study. The nature of this study is descriptive as it aims to describe the outcome of the relationship between the dependent and the independent variables. Hence, to describe to what extend the difference in the educational outcomes for students with and without a migration background who participate in higher professional education can be explained by factors related to ethnicity. The unit of analysis for this study is the individuals. To be exact, the students who participate in higher professional education, because they are the ones that are studied. Both the dependent and the independent variables are identified in section 3.2.2 - The description of the variables and the equations of the regression. The independent variables refer to the factors that are correlated with ethnicity. The dependent variable refers to the educational attainment of individuals. In order to explain the relationships between the dependent and the independent variables, two hypotheses have been formulated, H1 and H2. The relationship is supported by the assumptions that the two factors related with ethnicity, that have been descent from the literature review and the research questions, can explain the difference in educational attainment. Ultimately, the results of chapter four can falsify the hypotheses of this study (Toshkov, 2016: 295- 296).
H1: The financial situation of parents explains part of the difference in educational attainment between students with and without a migration background in higher professional education.
22 3.2 Methodology
The methodology chapter explains and discusses the research methods that are applied in this study. By applying these methods, it is possible to make measurements and to ultimately give an accurate answer to the main research question. The first part explains in detail why the multiple regression analysis and the Blinder-Oaxaca decomposition are suitable for this study, and how they will be applied. The second part of this chapter provides the reader with the formulas expressing the variables and the equations of the regression that can explain the difference in outcome between the two groups. And whether that influences the educational attainment or not.
3.2.1 Research methods
The aim of this study is to gain a greater understanding of the correlation between the factors related to ethnicity and the educational attainment of students who participate in higher education on bachelor level. Two important questions have been inferred from the research rationale. (i) To what extent is it the factors that lead to a different educational attainment? (ii) And to what extent are there other effects that lead to a different educational attainment? The literature review has instigated two main different factors related to ethnicity. These two factors are the 1) financial situation of their parents and 2) educational background of their parents. The factor financial situation of parents is related to several characteristics of the students such as the income from additional scholarship and the financial contribution of parents. And the educational background of parents is a combination of the education level of the mother and the education level of the father, in order to measure the correlation of the education levels with the educational attainment.
23
Multiple regression analysis
A multiple regression analysis entails that not only one independent variable is used to predict the outcome similar to a single regression, but allows for the use of multiple independent variables to explain and predict one single outcome. In this way, it is possible to measure the relationship of the dependent variable with multiple independent variables. Chapter 4 shows one multiple regression analysis for students without a migration background and another regression analysis for students with a migration background. In order to test if the coefficients of students with a migration background and students without a migration background are the same, additional zero statistical tests are conducted. The zero statistical tests examine if the independent variables are equal to zero. The results of these tests can also indicate whether the independent variables can explain the difference in educational attainment, or not.
The Blinder-Oaxaca decomposition method
As this study is focused on the variation between two groups, students with a migration background and students without a migration background, the Blinder-Oaxaca decomposition
equation is created as follows: = m − b. The difference in educational attainment is
the difference in mean outcome of Group M and Group B, thus, the difference in the
educational attainment between the two groups is (
)
= m − b.Ym symbolizes the mean outcome in educational attainment of group M, the students who
participate in higher professional education with a migration background. Yb symbolizes the
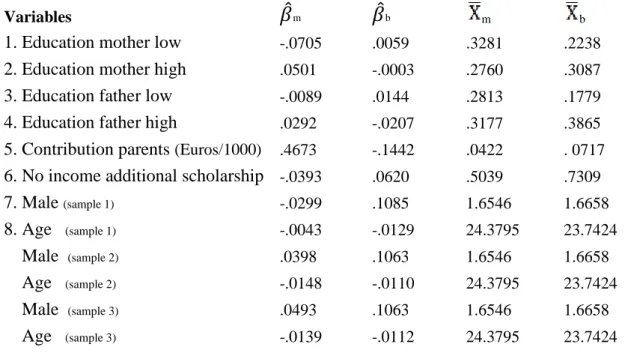
mean outcome in educational attainment of group B, the students who participate in higher professional education and do not have a migration background. The following independent variables are part of the empirical research and equation: 1= Education level mother, 2= Education level father, 3= Contribution parents, 4= No income additional scholarship, 5= Male, 6= Age.
The expression of the mean outcome for group M in a linear regression is: m = m′
m . The
first part which is the notation m , includes the independent variables’ mean values and the
last part of the notation
m represents the estimated regression coeficients. The right side of
the equation exists out of explanatory variables which explain the outcome. The equation
below shows what consists of, by expressing the estimated regression of the coeficients and the estimation more extensively:
24
(
′
m -′
b)
m is the extent to which the difference in educational outcomes can be
explained by a difference in the composition of students with and without a migration background. Accordingly, it provides me with the exact results that this study intends to examine. If students with a migration background and students without a migration background would have equal background characteristics, the expressions and also the difference in outcome, due to these background characteristics, would be both equal to zero. Furthermore, there is a part that does not explain the compilation effect. This part is expressed
as b
′(
m -
b) and is the ameliorated educational attainment, that illustrates how students
with a migration background, that is similar to students without a migration background in many respects, would have a lower educational attainment.
3.2.2 The description of the variables
The main variables
The main variables of this study and their description are stated below. All of these variables are part of the equation and express how to find if there is a difference in the educational outcomes between students with and without a migration background. They also assist in finding out to what extend the explanatory factors explain the difference in educational outcomes. A dummy variable is added in the multiple regressions in order to determine the background of the students; 1= if the student has a migration background and 0= if the student has no migration background.
25
Background characteristics variables
Ultimately, it is important to get an idea of the variables that are important for the study progress. And whether it differs for students with a migration background compared with students without a migration background or not. Based on the literature of chapter 2, the variables which are expected to be predictive of the study progress of the students with and without a migrant background have been selected. All of the independent variables are associated with background characteristics that have been selected in order to carry out the describing analysis. In total there are six independent variables that are essential for this research. Four independent variables are related to the financial situation and the educational background of the parents. The other two independent variables are related to socio-demographic characteristics, namely male and age.
X0 = Education level mother
X1 = Education level father
X2 = Contribution parents
X3 = No income additional scholarship
X4 = Male
X5 = Age
3.3 Data
26 3.4 Sample selection
Two different groups: students with a migration background (M) and students without a migration background (B), take an essential part in the empirical analysis. The total number of observations in the raw dataset is 70,632. The total number of observations for which immigrant status is unknown in the raw dataset is 105. That is the amount of missing values that are not part of the sample. 70,527 observations remain in the sample after inspecting the variable migration. Because this research has been conducted with data of year 2015 only, many observations are lost, namely 64,169. Therefore, the total number of students who participate in this research is 6,358. The total number of students who participated in higher professional education is year 2015 is 446,434 (CBS, 2018).
The variable study progress compared to the program is very important for the empirical analysis. Without this variable it is not possible to measure the educational outcome. For that reason, this variable is essential and necessary for this study. When observing the education level of the parents, group B has a greater number of missing observations than group M. This could be due to the fact that the diploma and the education level of the parents could be obtained in a foreign country. It is possible that the foreign education level is unknown or that it cannot be compared to the Dutch education level. However, I cannot ascertain this assumption. Furthermore, the variable that represents the income of both the mother and father has not been filled in well enough by the participants. As a result, the variable is not possible in combination with study progress compared to the program and the other independent variables because no observations remain. Without any observations, it is impossible to make use of the variable net income parents. In order to give an indication of the various income levels, the income from additional scholarship of students is an essential element in this study. This adjustment is further explained in chapter 8 obstacles and limitations
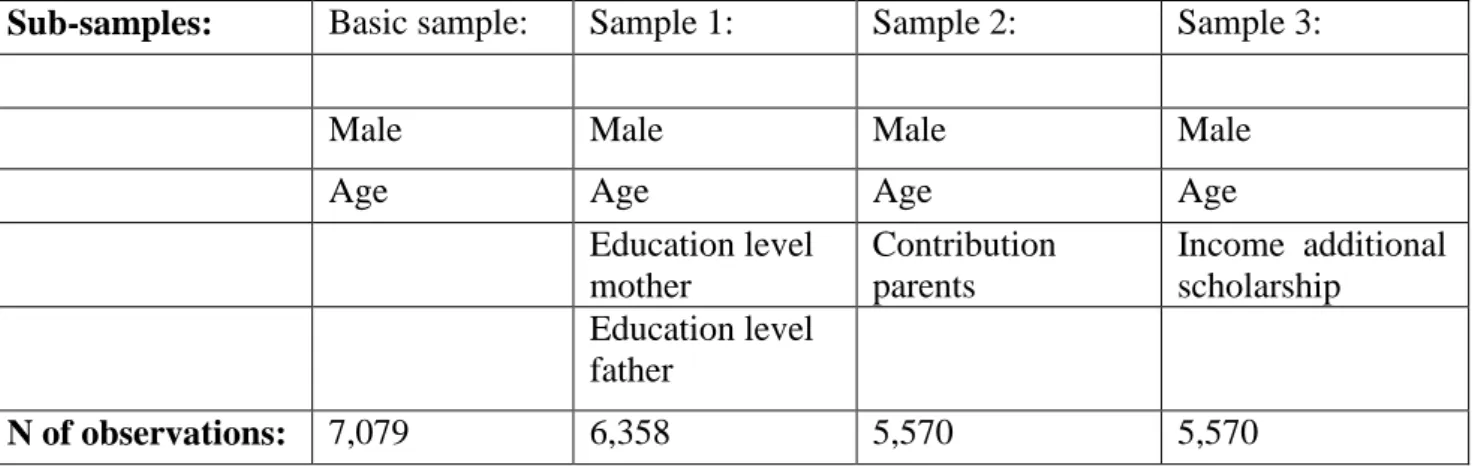
Table 1 - Regressions Samples
Sub-samples: Basic sample: Sample 1: Sample 2: Sample 3:
Male Male Male Male
Age Age Age Age
Education level mother
Contribution parents
Income additional scholarship
Education level father
27
In order to keep enough observations, four different sub-samples are created. One sample is the basic sample, which includes the independent variables male and age. These variables are put together with the three subsamples, see table 1. First, is the education level sample (sample 1), which includes the independent variables related to the educational background of the parents, namely education level mother, education level of father (low, medium, high), male and age. Second, is the sample that is related to the financial situation of the parents (sample 2) namely, the financial contribution of parents, male and age. Third, is the sample which also relates to the financial situation of parents (sample 3). This sample includes the variables no income additional scholarship, male and age.
3.5 Descriptive statistics
This section presents a comprehensive description of the data that is used in the multiple regression analyses. In order to present the description of the data at the most proficient way, four different tables have been constructed. All tables present the main characteristics of the students who participate in higher professional education, that are important for this study.
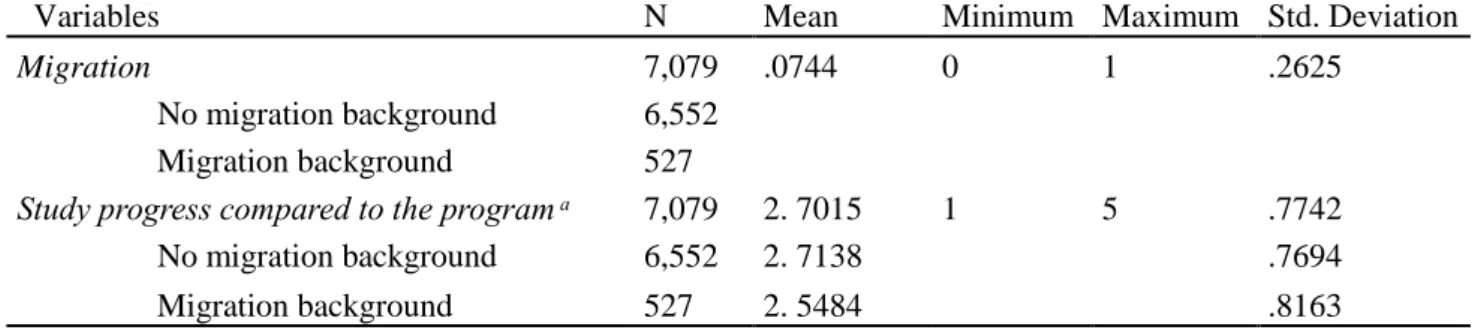
Table 2 - Main descriptive statistics of the students
Variables N Mean Minimum Maximum Std. Deviation
Migration 7,079 .0744 0 1 .2625
No migration background 6,552
Migration background 527
7,079 2. 7015 1 5 .7742
No migration background 6,552 2. 7138 .7694
Migration background 527 2. 5484 .8163
: 1= much behind, 2= somewhat behind, 3= on schedule, 4= little ahead, 5= very much ahead
Migration
28
professional education. The total number of students in the sample who have a migration background is 527. This is approximately 7% of the participants. The total number of students who do not have a migration background is 6,552.
Study progress
The variable study progress compared to the program is collectively with the variable migration essential for this research because the dependent variable represents the educational attainment. The average study progress compared to the program of students with a migration background is 2.56 and the average study progress compared to the program of students without a migration background is 2.72. The sample averages indicate that the average study progress compared to the program of students with a migration background is lower than that of students without a migration background. The standard deviation of students without a migration background is .7694 and is smaller than the standard deviation .8163 of students with a migration background. This indicates that the variance among this group is larger than that of group B.
Figure 2 - Study progress compared to the program (in percentages)
5,95
28,46
55,51
8,39
1,68 9,30
36,05
47,25
5,31
2,09
I am much behind
I am somewhat behind
I am running on schedule
I am a little ahead
29
Figure 2- Study progress compared to the program, also exhibits the descriptive statistics of the study progress compared to the program. The participants of the basic sample were asked by Studentmonitor to answer how they would categorize their study progress. The Y-axis shows the percentage of the respondents that have chosen a particular answer. The X-axis shows the categories of how they have categorized themselves to be in. The statistics show that most of the students with a migration background have categorized themselves as I am running on schedule [55.51%]. This development is not different for respondents that do not have a migration background. Most of them have also opted in large numbers that they are able to keep up with their study program. A total of 47.25% have categorized themselves as I am running on schedule. Next, group M [2.09%] and B [1.68%] both have the lowest percentage of students that categorized themselves as I am a very much ahead. Remarkably, the percentage of students that argue to be very much ahead is higher for students with a migration background than students without a migration background. However, the category I am somewhat behind shows the largest percentage difference between group B [28.46%] and M [36.05%]. This indicates that a much larger percentage of the students with a migration background in comparison to students without a migration background have categorized themselves as being somewhat behind.
The way in which the students answered the questions shows that the study progress is significantly different for students with a migration background compared to students without a migration background.1 Students with a migration background are much more likely to lag behind than students without a migration background, which shows that there is a significant difference in the educational attainment between student with and without a migration background.
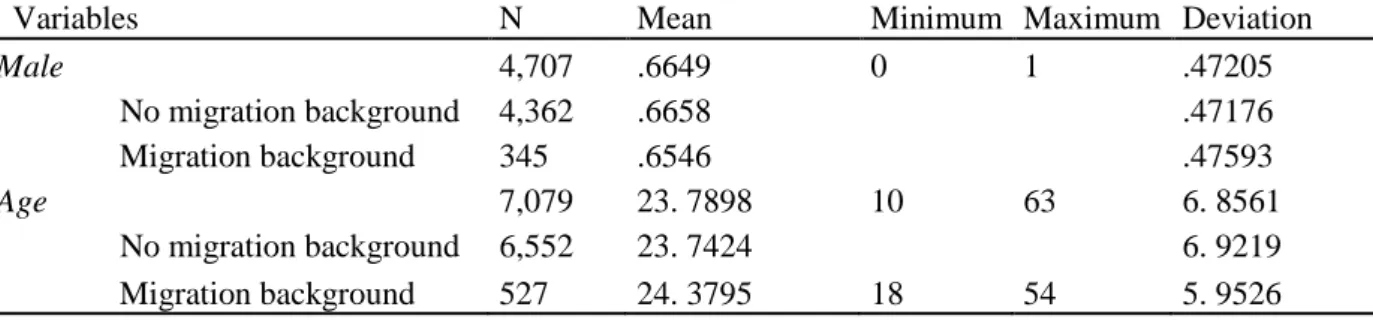
Table 3 - Sociodemographic descriptive statistics of the students
Variables N Mean Minimum Maximum
Std. Deviation
Male 4,707 .6649 0 1 .47205
No migration background 4,362 .6658 .47176
Migration background 345 .6546 .47593
Age 7,079 23. 7898 10 63 6. 8561
No migration background 6,552 23. 7424 6. 9219
Migration background 527 24. 3795 18 54 5. 9526
1
30
Table 3 presents sociodemographic characteristics of students who participate in higher professional education. The descriptive statistics show that from the respondents, men present a larger number [4,707] of students than women do [2,372]. Approximately 66% of the students with a migration background are male. This is no different for students without a migration, because approximately 66% of this group also consists out of males. In addition, questions were asked to the participants about their date of birth. The average age of the whole sample is 23.8. The statistics illustrate that on average, students with a migration background have a higher age than students without a migration background. The average age of students with a migration background is 24.4 and for students without a migration background the average age is 23.7.
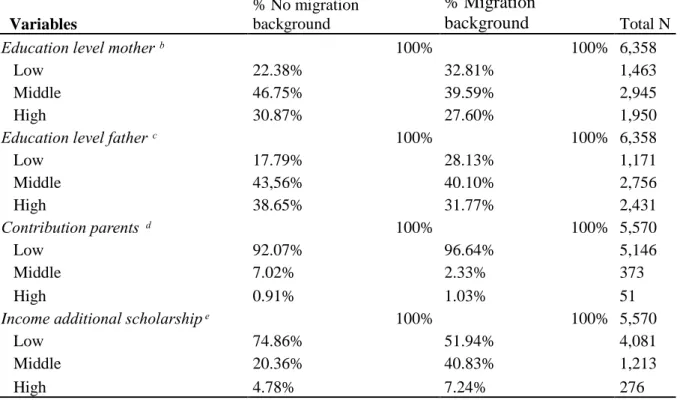
Table 4 - Descriptive statistics Financial situation and education level parents
Variables
% No migration background
% Migration
background Total N
E i n l v l ᵇ 100% 100% 6,358
Low 22.38% 32.81% 1,463
Middle 46.75% 39.59% 2,945
High 30.87% 27.60% 1,950
E i n l v l f ᶜ 100% 100% 6,358
Low 17.79% 28.13% 1,171
Middle 43,56% 40.10% 2,756
High 38.65% 31.77% 2,431
n i i n n 100% 100% 5,570
Low 92.07% 96.64% 5,146
Middle 7.02% 2.33% 373
High 0.91% 1.03% 51
In i i n l l i 100% 100% 5,570
Low 74.86% 51.94% 4,081
Middle 20.36% 40.83% 1,213
High 4.78% 7.24% 276
ᵇ : 1=Low 2=Middle 3=High ᶜ : 1=Low 2=Middle 3=High
: 1= €0- €250, 2= €250- €500, 3= €500- €2000 : 1= €0- €50, 2= €50- €300, 3= €300- 800
31
Middle, High) 2. The first category is an average education level of 1 until 5 and is defined as Low. From the 13 categories numbers 5 until 10 are defined as Middle education level and is category 2. The categories 11 until 13 are defined as a High, which is category 3. This entails that the minimum education level in the table is 1 and the maximum is 3. For that reason, the mean averages cannot be larger than 3 as it is the highest category representing the level 11 until 13, as explained above.
Table 4 shows the descriptive statistics of the financial situation and the educational background of the parents, which are part of the socio-economic characteristics. These statistics indicate that on average the education level of the parents (of students with a migration background) is higher than of students without a migration background. This is because in comparison to students with a migration background, students without a migration background represent larger percentages to have parents with a Middle or High education level. This indicates that the average education level of parents of students without a migration background is higher than that of students with a migration background. This finding is expected from theory that initiates that the education level of parents is a contributor of backlogs in education (OCW, 2014). And that the level of education of immigrant parents is lower than that of parents without a migration background (NJI, 2013 p.4). The percentage of parents with a low education level is higher for group M [32.81%] than group B [22.38%]. However, category middle education level shows that group B [46.75%] has a higher percentage than group M [39.59%]. Nevertheless, for both groups, the average education level of the parents is considered to be Middle as most of the respondents have categorized the education level of their parents as Middle.
The financial contribution that students receive from their parents, both the mother and father, range from €0 until €2000 per month. Three different categories are created for the financial contribution. The lowest category ranges from €0 until €250. The middle category ranges from €250 until €500. And the highest category of contribution ranges from €500 until €2000 euro per month. A very low percentage of the students with and without a migration background indicated that the financial contribution falls under the highest category [0.91%] and [1.03%]. However, both groups have the highest percentage in the lowest range, namely 92.07 % for group B and 96.64% for group M. A slightly larger percentage, namely 4.57% more students with a migration background indicated that the financial contribution is low. The average contribution of parents for students with a migration background is €42,17, which falls under the category low. For students without a migration background, the average financial contribution from their parent is €71,74 per month, which entails that this group receives the highest amount when comparing them to students with a migration background. Yet both group M and B are categorized in the lowest contribution range.
2
32
33 Table 5 - correlation between variables
Variables
Study progress compared
to the program Migration
Education level mother
Education level father
Contribution parents
No income additional
scholarship Male Age
Study progress compared to the program 1.0000
Migration -0.0456** 1.0000
Education level mother 0.0066 -0.0645*** 1.0000
Education level father -0.0137 -0.0750*** 0.4823*** 1.0000
Contribution parents (Euros/1000) -0.0041 -0.0562*** 0.2080*** 0.2154*** 1.0000
No income additional scholarship 0.0153 -0.1028*** 0.0993*** 0.1538*** 0.1475*** 1.0000
Male 0.0704*** -0.0037 -0.0008 -0.0160 0.0213 -0.0134 1.0000
Age -0.0936*** 0.0328* -0.1933*** -0.0996*** -0.1327*** 0.1414*** -0.0534** 1.0000
* significant at 0.05 level
The final descriptive statistics in table 5 describe the correlations between the variables. In order to obtain these statistics, a correlation analysis is applied. The variables that are aligned with the financial situation and the educational background of the parents are incorporated (1: migration 2: education level of mother, 3: education level of father, 4: contribution of parents and 5: no income additional scholarship, 6: male and 7: age). The dependent variable 8: study progress compared to the program is also included.
The variables migration, male and age are significantly correlated with the dependent variable study progress compared to the program. The variable male is positively correlated, however, the p-value of migration and age do show a negative correlation with the dependent variable. This shows that being a male has a significant and positive effect on study progress but having a migration background and having a higher age, which students with a migration background on average have, has a significant negative effect on the study progress. Furthermore, the education level of parents, contribution of parents and no income from additional scholarship are significantly and negatively correlated with migration. This indicates that the financial situation and the education level of parents are strongly related to migration. The variables education level father, contribution parents, no income additional scholarship, and age all show significant correlations with the educational level of both the mother and father. Prominent is that the education level of the father is positively and significantly associated with the education level of the mother.
The statistics show that no income from additional scholarship is positively and significantly correlated with the contribution of parents. Age is negatively and significantly correlated with the contribution of parents. This indicates that as students get older, the less will be the financial contribution of their parents. Moreover, the correlation analysis indicates that the higher the net income from additional scholarship, the lower is the financial contribution of their parents. This outcome was to be expected as the report and theory from NIBUD in chapter 2 is based on the fundamental idea that the financial contribution of parents is influenced by no income additional scholarship. And that additional scholarship causes students to need financial support from their parents in order to finance their study costs (NIBUD, 2017).
35 IV. Result of research and analysis
The previous chapter described the data for this research. This chapter illustrates the main results that are retrieved from the multiple regressions. The multiple regression analyses are carried out for students with a migration background and students without a migration background, in section 4.1 and 4.2. The multiple regression analysis with interaction terms provides additional information about whether there are significant differences between students with and without migration background or not, and is presented in section 4.3. Section 4.4 shows the analysis and the regression equation of the Blinder-Oaxaca decomposition. The chapter ends with a summary of the main findings in section 4.5
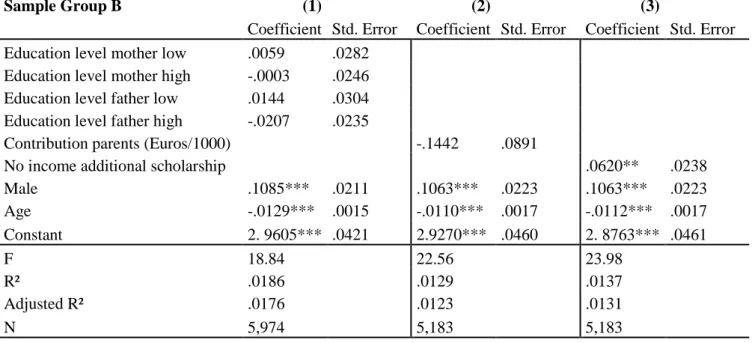
Table 6 - Multiple regression results of students without a migration background
Sample Group B (1) (2) (3)
Coefficient Std. Error Coefficient Std. Error Coefficient Std. Error
Education level mother low .0059 .0282
Education level mother high -.0003 .0246
Education level father low .0144 .0304
Education level father high -.0207 .0235
Contribution parents (Euros/1000) -.1442 .0891
No income additional scholarship .0620** .0238
Male .1085*** .0211 .1063*** .0223 .1063*** .0223
Age -.0129*** .0015 -.0110*** .0017 -.0112*** .0017
Constant 2. 9605*** .0421 2.9270*** .0460 2. 8763*** .0461
F 18.84 22.56 23.98
R² .0186 .0129 .0137
Adjusted R² .0176 .0123 .0131
N 5,974 5,183 5,183
* significant at 0.05 level ** significant at 0.01 level
***significant at 0.001 level Contribution parents is in thousands
1= basic sample + education level
2= basic sample + finance sample contribution
36 4.1 Multiple regression analysis of students without migration background
Table 6 illustrates the multiple regression results for those that have no migration background. When the standard errors are small, it can be claimed that the estimated difference is statistically significant, and is based on empirical evidence. Moreover, it confirms that the result from the test is not likely to occur randomly or by chance (Angrist & Pischke, 2015 p.36, 58). The coefficient of the variable income from additional scholarship is statistically significant and positive at 0.01 level. Age and male are also statistically different from zero. As presented in table 5, age is negatively correlated with the study progress compared to the program. And male is positively correlated with the study progress compared to the program. This means that except for income from additional scholarship, the regression coefficients of other independent variables related to the educational background and the financial situation of parents are not statistically significant.
The next results to consider are the R² and the adjusted R². The adjusted R² informs us about the percentage of variation that is explained by the independent variables. The R² shows to what extent the data can be explained by the model and reveals the percentage of variation that is explained by the independent variables. It tells us how well it fits is with the model. The R²’s are relatively low which indicates that the fit of the model is limited. And that means that the variables can only contribute a little bit to explaining the dependent variable.
In contrast to the multiple regression results, the zero statistical test does not asses all the coefficients of the independent variables. Only the significance of those that represent the education level of parents are examined simultaneously.3 Contribution parents and no income additional scholarship have already been examined separately, so therefore do not need to be tested again in this section. The results of the multiple regression suggest that the association of the educational background of parents with the study progress compared to the program is little. By examining the independent variables simultaneously instead of individually, it can be verified if the educational background does matter. The results of the zero statistical test do not show any significance [0.7294]. This shows that irrespective of whether the variables are examined individually or collectively, there is no significant association of the educational level of the parents with the study progress compared to the program for students without a migration background.
3 ( 1) Education level mother low = 0
( 2) Education level mother high = 0 ( 3) Education level father low = 0 ( 4) Education level father high = 0
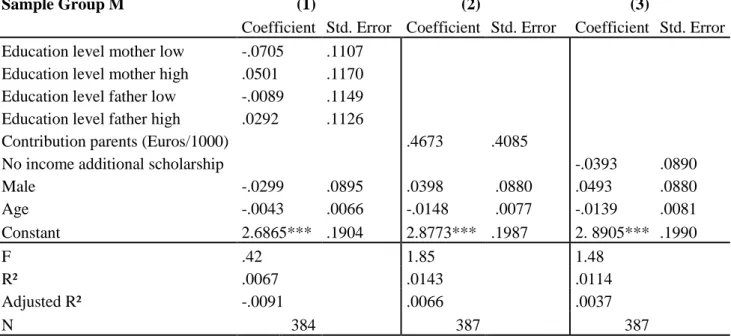
37 Table 7 - Multiple regression results of students with a migration background
4.2 Multiple regression analysis of students with a migration background
Table 7 displays the multiple regression results of students with a migration background. The results show that of all the regression coefficients of variables that are related to the educational background and the financial situation of parents, there is not one that is statistically significant. Age and male are also not significantly correlated with the study progress compared to the program. Furthermore, the R² and the adjusted R² are also relatively low in this model. These results of the multiple regression indicate that there are no significant associations of the educational background and the financial situation of parents with the study progress compared to the program. What would happen if the variables are being examined together by means of the zero statistical test?
Sample Group M (1) (2) (3)
Coefficient Std. Error Coefficient Std. Error Coefficient Std. Error
Education level mother low -.0705 .1107
Education level mother high .0501 .1170
Education level father low -.0089 .1149
Education level father high .0292 .1126
Contribution parents (Euros/1000) .4673 .4085
No income additional scholarship -.0393 .0890
Male -.0299 .0895 .0398 .0880 .0493 .0880
Age -.0043 .0066 -.0148 .0077 -.0139 .0081
Constant 2.6865*** .1904 2.8773*** .1987 2. 8905*** .1990
F .42 1.85 1.48
R² .0067 .0143 .0114
Adjusted R² -.0091 .0066 .0037
N 384 387 387
* significant at 0.05 level
** significant at 0.01 level
***significant at 0.001 level
Contribution parents is in thousands
1= basic sample + education level parents 2= basic sample + finance sample contribution
38
The zero statistical test for students with a migration background also looks once more at the educational level of the parents. The results show that the independent variables together are not statistically significant [0.5392].4 This means that the results indicate that there is no significant relationship between the educational level of the parents with the study progress compared to the program, for students with a migration background.
4 ( 1) Education level mother low
= 0 ( 2) Education level mother high = 0 ( 3) Education level father low = 0 ( 4) Education level father high = 0
![[−2]proPSA versus ultrasensitive PSA fluctuations over time in the first year from radical prostatectomy, in an high-risk prostate cancer population: A first report](data:image/gif;base64,R0lGODlhAQABAIAAAP///wAAACH5BAEAAAAALAAAAAABAAEAAAICRAEAOw==)