Phosphate release contributes to the rate-limiting
step for unwinding by an RNA helicase
Qixin Wang
1,2, Jamie J. Arnold
1, Akira Uchida
1, Kevin D. Raney
3,* and
Craig E. Cameron
1,*
1
Department of Biochemistry and Molecular Biology, The Pennsylvania State University, University Park, PA 16802, USA,2College of Life Sciences, Graduate University of Chinese Academy of Sciences, No. 19A YuQuan Road, 100049, Beijing, China and3Department of Biochemistry and Molecular Biology, University of Arkansas for Medical Sciences, Little Rock, AR 72205, USA
Received August 3, 2009; Revised November 6, 2009; Accepted November 12, 2009
ABSTRACT
RNA helicases function in numerous aspects of RNA biology. These enzymes are RNA-stimulated ATPases that translocate on RNA and unwind or remodel structured RNA in an ATP-dependent fashion. How ATP and the ATPase cycle fuel the work performed by helicases is not completely clear. The hepatitis C virus RNA helicase, NS3, is an important model system for this class of enzymes. NS3 binding to a single-/double-strand RNA or DNA junction leads to ATP-independent melting of the duplex and formation of a complex capable of ATP-dependent unwinding by using a spring-loaded mechanism. We have established an RNA substrate for NS3 that can be unwound in a single sub-step. Our studies are consistent with a model in which a single ATP binding and/or hydro-lysis event sets the unwinding spring and phosphate dissociation contributes to release of the spring,
thereby driving the power stroke used for
unwinding.
INTRODUCTION
RNA helicases function in myriad aspects of RNA metab-olism in the cell, and new functions continue to emerge (1). Viruses also encode RNA helicases (2). The RNA helicase encoded by hepatitis C virus (HCV), non-structural protein 3 (NS3), is a DExH-box protein that belongs to helicase superfamily 2 (SF2) (2). Unlike most DExH-box proteins, NS3 is also a DNA helicase (2). Although HCV NS3 RNA helicase activity is essential for virus viability, the precise role of the RNA helicase activity in the multi-plication cycle is not known (2).
HCV NS3 has emerged as an important model system for studies of the kinetics and mechanism of SF2 RNA helicases (3–9). NS3 binds to its nucleic acid substrate in multiple forms: monomer, dimer, oligomer, depending on the length of the single-stranded overhang used for NS3 loading (10,11). After formation of the NS3-nucleic acid complex, a slow isomerization of this complex occurs that activates the complex for unwinding (12). It has recently been suggested that this isomerization may reflect an ATP-independent, local melting of the duplex region targeted for ATP-dependent unwinding (3). NS3 has been proposed to use both passive (5) and active (3) anisms for unwinding. It is possible that a passive mech-anism is used prior to formation of the activated complex and an active mechanism used thereafter.
Addition of ATP to a reaction containing activated complexes leads to multiple cycles of unwinding and pausing (4,9). The number of cycles of unwinding and pausing per binding event is dependent on the NS3 oligomeric state, with monomers being the least processive (4). The kinetic and physical step size for NS3 is 11–18 bp, again depending on the oligomeric state. This ‘super’ step of unwinding occurs in sub-steps of 3 bp (3,4), and each sub-step is thought to occur in three, 1-bp sub-sub-steps (6). Whether or not the ATPase cycle couples to a sub-step or a sub-sub-step needs to be clarified.
How the ATPase cycle couples to unwinding is not completely clear for any helicase but clearly represents an important frontier for helicase enzymology (13,14). The realization that NS3 employs an active mechanism for unwinding suggested that this system might also be used to address this question. We reasoned that if an unwinding substrate could be produced that required no greater than one, 3-bp sub-step for unwinding to occur, then correlations between the ATPase cycle and unwind-ing might be possible.
*To whom correspondence should be addressed. Tel: +1 814-863-8705; Fax: +1 814-865-7927; Email: [email protected]
Correspondence may also be addressed to Kevin D. Raney. Tel: +1 501-686-5244; Fax: +1 501-686-8169; Email: [email protected] doi:10.1093/nar/gkp1118
ßThe Author(s) 2009. Published by Oxford University Press.
We show that an RNA substrate containing a 20-nt single-stranded loading strand and a 9-bp duplex can be unwound in a single sub-step. Importantly, the rate constant for unwinding was equivalent to the rate constant for phosphate release during the ATPase cycle. This study provides the first, direct link between a step in the ATPase cycle and unwinding by an RNA helicase, and sets the stage for elucidation of the mechanochemical coupling mechanism employed by RNA helicases.
MATERIALS AND METHODS Materials
All RNA oligonucleotides were from Dharmacon Research, Inc.; All DNA oligonucleotides were from Integrated DNA Technologies, Inc.; [g-32P]-ATP (7000 Ci/mmol) was from MP Biomedical; [a-32P]-ATP (3000 Ci/mmol) was from Perkin Elmer; T4 polynucleotide kinase was from USB; ATP was from GE Healthcare; N-[2-
(1-Maleimidyl)ethyl]-7-(diethylamino)coumarin-3-carbox-amide (MDCC) was from Invitrogen; AMPPNP,
7-methylguanosine and purine nucleoside phosphorylase were from Sigma; all other reagents were of the highest grade available from Sigma, Fisher or VWR.
Purification and 50-32P-labeling of RNA oligonucleotides
RNA oligonucleotides were purified by denaturing polyacrylamide gel electrophoresis (PAGE) and end-labeled by using [g-32P]ATP and T4 polynucleotide kinase as described earlier (15) and are described in the ‘Materials and Methods’ section provided in Supplementary Data. Concentrations were determined by measuring the absorbance at 260 nm using a Nanodrop spectrophotometer and using the appropriate calculated extinction coefficient.
Annealing of unwinding substrates
Oligonucleotides were annealed at 5mM in 25 mM MOPS, pH 7.0, 50 mM NaCl by using a Progene Thermocycler (Techne). The ratio of loading strand to displaced strand was 1: 1.2. Annealing reactions were heated to 90C for 1 min and slowly cooled (5C/min) to 40C at which point MgCl2was added to a final concentration of 1 mM. After the addition of MgCl2, the reactions were slowly cooled to 10C.
Construction, expression and purification of
full-length HCV NS3 helicase andEscherichia
coliphosphate-binding protein
We constructed expression constructs for HCV NS3 and phosphate-binding protein (PBP) by using standard recombinant DNA protocols as described in the ‘Materials and Methods’ section provided in Supple-mentary Data. Briefly, we amplified DNA sequences using the HCV subgenomic replicon 1b con1 strain (16) (Genbank accession number is AJ238799) as template for HCV NS3 and plasmid isolated from ANCC75 cells con-taining the phoS gene with the A197C mutation (17) (Genbank accession number is AAA24378) as template
for PBP by using the polymerase chain reaction. Forward and reverse primers employed for amplification were selected based on the presence of unique restriction sites suitable for subcloning of the mutated DNA fragment into the expression plasmid.
We usedE. colifor expression and purification of HCV NS3 and PBP as described in the ‘Materials and Methods’ section provided in Supplementary Data. Briefly, we transformed cells with the appropriate plasmid and used these cells to produce an inoculum for large-scale growth. We induced gene expression during exponential growth by addition of isopropyl-b-D-thiogalactopyranoside or by using auto-induction media (18). We lysed induced cells in appropriate buffers, and purified the enzymes to apparent homogeneity by using standard column chroma-tography resins and protocols.
MDCC-labeling of PBP
Purified PBP was labeled with MDCC in the presence
of a phosphate sponge. The phosphate sponge
removes trace Pi from solution by covalently coupling 7-methylguanosine with Pi enzymatically using purine nucleoside phosphorylase. Reactions, typically 1 ml, con-tained 100mM A197C PBP, 500mM MDCC, 200mM 7-methylguanosine and 0.2 U/ml purine nucleoside phosphorylase in 20 mM Tris–HCl, pH 8.0. Reactions were incubated at room temperature for 4 h, continuously mixing using a rotating mixer. Reactions were briefly centrifuged for 5 min at 6000g in a microcentrifuge, then passed over a 10 ml G25 Sephadex column equilibrated first with 300mM 7-methylguanosine and 0.05 U/ml purine nucleoside phosphorylase in 10 mM MOPS pH 7.0, 10 mM MgCl2 and then 10 mM Tris–HCl, pH 8.0 and 100 mM NaCl. After loading, the column was subsequently washed with 20 ml of 10 mM Tris–HCl, pH 8.0 and 50 mM NaCl. The pass and wash fractions were collected and the absorbance at 280 and 430 nm were measured by using a Nanodrop. The MDCC labeled PBP concentration was determined after correcting for the absorbance at 280 nM due to MDCC. The molar extinction coefficient of PBP and MDCC at 280 nm is 61 880 M1 cm1 and 7675 M1 cm1, respectively. The molar extinction coefficient of MDCC at 430 nm is 46 800 M1 cm1. The sample was aliquoted and frozen at 80C until use.
Nucleic acid binding assay
Experiments were performed using a Beacon fluorescence polarization system (GE Healthcare). The Beacon system uses a high intensity 100 Watt quartz halogen lamp for 360–900 nm excitation. The filters used for fluorescence excitation and emission were 490 ± 10 and 525 ± 10 nm, respectively. Assays were performed by mixing 0.1 nM 30-fluorescein-labeled ds9-C20 with increasing concentra-tions of either WT or D290A HCV NS3 for 10 min in
binding buffer (25 mM MOPS, pH 7.0, 2 mM
polarization (mP). NS3 was diluted immediately prior to use in 25 mM MOPS, pH 7.0, 2 mMb-mercaptoethanol, 10 mM MgCl2, 5% glycerol and 200 mM NaCl. The volume of NS3 added to the binding reaction was equal to one–tenth to one–fifth the total volume of the reaction. All steps were performed in reduced light. To determine the apparent dissociation constant (Kd,app), polarization (mP) was plotted as a function of NS3 concentration and the data were fit to a hyperbola:
mP¼mPmax ½NS3
Kd,appþ ½NS3
þmP0, 1
where mP is the polarization measured, mPmax is the maximum polarization, mP0is the initial polarization in the absence of NS3 andKd,appis the apparent dissociation constant.
Nucleotide binding assay
Experiments were performed by using QuantamasterTM, model QM-1 and RatiomasterTM, model RC-M, fluores-cence systems with Felix software (Photon Technology International). Assays were performed by mixing 2mM NS3 with increasing concentrations of ATP for 1 min in
binding buffer (25 mM MOPS, pH 7.0, 2 mM
b-mercaptoethanol, 10 mM MgCl2 and 50 mM NaCl) prior to monitoring the change in relative fluorescence of NS3. Where indicated, 20mM ds9-C20 was present in the binding reaction. The excitation wavelength was 297 nm and the emission wavelength was 333 nm. The slit widths for excitation and emission were 2 and 6 nm, respectively. The inner-filter effect was corrected by using the following equation:
Fcorr¼Fobs
V0þVi
V0
antilog AbsexþAbsem 2
, 2
whereFcorr was the corrected fluorescence intensity, Fobs was the fluorescence intensity measured, V0 was initial sample volume, Vi was total volume of titrant added andAbsexand Absemwere absorbance values at the exci-tation and the emission wavelengths, respectively (19).
To determine the apparent dissociation constant (Kd,app), the corrected fluorescence intensity was plotted as a function of ATP concentration and the data were fit to a hyperbola:
Fcorr¼Fcorr,0
Fcorr ½ATP Kd,appþ ½ATP
3
whereFcorrwas the corrected fluorescence intensity,Fcorr,0 was the corrected fluorescence intensity in the absence of NS3 andKd,app is the apparent dissociation constant. HCV NS3 helicase assay
Reactions were performed at 25 or 37C. NS3 (2mM) was mixed with 2 nM [32P]-labeled unwinding substrate in 25 mM MOPS pH 7.0, 50 mM NaCl and 1 mM EDTA. Reactions were initiated by the addition of 10 mM ATP, 10 mM MgCl2 and 100 nM trapping strand in 25 mM MOPS pH 7.0, 50 mM NaCl. The trapping strand is a
9-mer RNA that is complementary to the displaced strand. Reactions were quenched at various times by addition EDTA to 100 mM and SDS to 0.33%. Specific concentrations of substrate or enzyme, along with any deviations from the above, are indicated in the appropri-ate figure legend. NS3 was diluted immediappropri-ately prior to use in 25 mM MOPS pH 7.0 and 20% glycerol. The volume of enzyme added to any reaction was always less than or equal to one–tenth the total volume. Products were resolved by native PAGE.
HCV NS3 ATPase assay
Reactions were performed at 37C. Reactions contained 25 mM MOPS pH 7.0, 50 mM NaCl, 10 mM MgCl2, 200 nM NS3, 10 mM ATP, 0.05mM [a32P]-ATP and either 0 or 20mM unwinding substrate. Reactions were initiated by the addition of NS3. Reactions were quenched at various times by addition of EDTA to 100 mM. Specific concentrations of substrate or enzyme, along with any deviations from the above, are indicated in the appropriate figure legend. NS3 was diluted immedi-ately prior to use in 25 mM MOPS, pH 7.0 and 20% glycerol. The volume of enzyme added to any reaction was always less than or equal to one–tenth the total volume. Products were resolved by TLC.
Rapid chemical-quench-flow experiments
Rapid mixing/quenching experiments were performed by using a Model RQF-3 chemical-quench-flow apparatus (KinTek Corp., Austin TX, USA). Experiments were per-formed at 37C by using a circulating water bath. For the pre-steady-state unwinding assays, 4mM NS3 was mixed with 2 nM unwinding substrate in 25 mM MOPS pH 7.0, 50 mM NaCl and 1 mM EDTA at 37C for 10 min to first assemble an activated NS3-unwinding substrate complex. The NS3-unwinding substrate complex was then rapidly mixed with 20 mM ATP, 20 mM MgCl2 and 200 nM trapping strand in 25 mM MOPS pH 7.0, 50 mM NaCl using the chemical-quench flow. After mixing, reactant concentrations were reduced by 50%. Reactions were rapidly quenched by addition of EDTA to 100 mM and SDS to 0.33%. Products were resolved by native PAGE. For the pre-steady-state ATPase assays, 4mM NS3 in 25 mM MOPS pH 7.0, 50 mM NaCl and 1 mM EDTA was rapidly mixed with 40mM unwinding substrate and 20mM [a32P]-ATP in 25 mM MOPS pH 7.0, 50 mM NaCl and 20 mM MgCl2. After mixing, reactant concentrations were reduced by 50%. Reactions were rapidly quenched by addition of EDTA to 100 mM. Products were resolved by TLC.
Product analysis: native PAGE
ImageQuant software (Molecular Dynamics) to determine the amount of strand separation. The fraction of RNA that had been unwound by the helicase was corrected for the efficiency of the trapping strand in preventing reannealing of products. This correction factor was deter-mined for each experiment by heating a sample of the RNA substrate at 95C for 1 min then cooled to 10C at a rate of 5C/min in the presence of the trapping strand. The quantity of unwinding substrate that was prevented from reannealing was typically 98%. The amount of RNA unwound was plotted as a function of time and fit to either a single [Equation (4)] or double [Equation (5)] exponential equation.
½RNAunwound ¼AeðkobsetÞþC, 4
where A is the maximum amount of unwound RNA product,kobsis the observed rate constant for unwinding, tis the time andCis an offset for the amount of unwound RNA product present at the beginning of the experiment (t=0).
½RNAunwound ¼A1eðkobs1tÞþA2eðkobs2tÞþC, 5 whereA1is the amount of unwound RNA product in the first phase,kobs1is the observed rate constant for unwind-ing of the first phase,A2is the amount of unwound RNA product in the second phase, kobs2 is the observed rate constant for unwinding of the second phase,tis the time and C is an offset for the amount of unwound RNA product present at the beginning of the experiment (t=0). Product analysis
TLC—1ml of the quenched reaction was spotted onto polyethyleneimine-cellulose TLC plates (EM Science). TLC plates were developed in 0.3 M potassium phosphate, pH 7.0, dried and exposed to a PhosphorImager screen. TLC plates were visualized by using a PhosphorImager and quantified by using the ImageQuant software (molec-ular dynamics) to determine the amount of ATP hydrolyzed to ADP. The amount of ADP was plotted as a function of time and fit to a line or a single exponential followed by a line.
ADP
½ ¼A1eðkobs2tÞþkobs2tþC, 6
whereA1is the amount of ADP product in the first phase, kobs1is the observed rate constant for ATP hydrolysis of the first phase,kobs2 is the observed rate for ADP hydro-lysis of the linear phase,tis the time andCis an offset for the amount of ADP product present at the beginning of the experiment (t=0).
Phosphate release assay by stopped-flow fluorescence
Pre-steady-state phosphate release stopped-flow fluores-cence experiments were performed using a Model SF-2001 stopped-flow apparatus (Kintek Corp.) equipped with a waterbath. All reactions were performed at 37C. A phosphate sponge that consisted of 7-methylguanosine and purine nucleoside phosphorylase was present in both syringes to ensure that free Pi was minimal prior to mixing. First, 4mM NS3 was mixed with 40mM unwinding
substrate, 50mM 7-methylguanosine and 0.02 U/ml purine nucleoside phosphorylase in 25 mM MOPS pH 7.0, 50 mM NaCl and 10 mM MgCl2at 37C for 10 min to assemble the NS3-unwinding substrate complex. The NS3-unwinding substrate complex was then rapidly mixed by using the stopped-flow with 20 mM ATP, 4mM MDCC-labeled PBP, 250mM 7-methylguanosine and 0.05 U/ml purine nucleoside phosphorylase in 25 mM MOPS pH 7.0, 50 mM NaCl and 30 mM MgCl2. After mixing, reactant concentrations were reduced by 50%. Fluorescence emission was monitored by using a 460 nm cut-on filter (Chroma technology corp., Rockingham, VT, USA). The excitation wavelength used was 435 nm. For each experi-ment, at least four fluorescence traces were averaged. The relative fluorescence was plotted as a function of time and fit to a single exponential equation:
F¼AeðkobsetÞþC, 7
where F is the relative fluorescence intensity, kobs is the observed rate constant for phosphate release,tis the time andCis an offset.
Data analysis
Data were fit by non-linear regression using the program KaleidaGraph (Synergy Software, Reading, PA, USA). All experiments shown are representative, single experi-ments that have been performed after at least three indi-vidual trials to define the concentration or time range shown. In all cases, values for parameters measured during individual trials were within the limits of the error reported for the final experiments.
RESULTS
Design of a minimal substrate (ds9-C20) to study NS3-catalyzed RNA unwinding
HCV NS3 is a 30!50 translocase that requires 10–20 nt of single-stranded nucleic acid for efficient loading (5,10,12,20). A 20-nt loading strand may be sufficient to accommodate binding of an NS3 dimer (21). However, the oligomeric status of NS3 does not alter the transactions occurring at the single-(ss)/double-strand (ds) junction, the site of unwinding, only NS3 processivity (4,20). Both the kinetic and physical step size for unwinding of ds nucleic acid by NS3 ranges from 11 bp for a monomer to 18 bp for a dimer, with the 11–18 bp step being comprised of multiple 3-bp sub-steps (4). After binding, NS3 may melt as many as 5 bp of the duplex region located at the ss/ds junction of a substrate for unwinding in an ATP-independent fashion (3,5,22). Continued unwinding would require ATP consumption.
20-nt 30-overhang comprised of 20 cytidylate residues (C20). The 20-nt overhang should permit a monomer or dimer to be accommodated, depending upon the stoichiometry of NS3 to ds9-C20 substrate. Melting of 3 bp of the 9-bp duplex followed by a 3-bp substep would leave 3 bp annealed that should spontaneously melt at 37C, leading to release of the 9-nt ‘displaced’ strand.
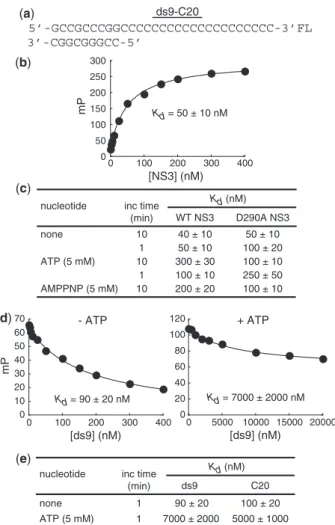
Binding of ds9-C20 to NS3 is tight and is modulated by ATP
The first question that we asked was how well does the ds9-C20 substrate bind to NS3. This experiment was per-formed by using fluorescence polarization. A ds9-C20 substrate was prepared that contained a fluorescein (FL) molecule on the 30 end of the loading strand (Figure 1a). We refer to the FL-labeled substrate as ds9-C20-FL. Placing the FL molecule at any position of the duplex region of the substrate altered binding affinity. We titrated NS3 (at least 0.2–5 Kd) into binding buffer con-taining ds9-C20-FL (0.1 nM). The change in fluorescence polarization (mP) was plotted as a function of NS3 con-centration, and the data were fit to the appropriate model, generally a hyperbola as described in ‘Materials and Methods’ section (Figure 1b). The time of incubation was varied (1 or 10 min) prior to recording the mP values because of reports of a slow assembly of a func-tional NS3-RNA complex (12). The value for the equilib-rium dissociation constant (Kd) of the NS3.ds9-C20
complex was in the 40–50 nM range and was not impacted substantially by the incubation time (Figure 1c). It has been shown that ATP weakens the interaction between NS3 and nucleic acid (5,7,23). As shown in Figure 1c, in the presence of 5 mM ATP, the Kd value for the NS3.ds9-C20 complex increased by as much as
7-fold relative to theKd value determined in the absence of ATP (Figure 1c). During this experiment, the duplex was not unwound (Supplementary Figure S1a); ATP was not completely consumed (Supplementary Figure S1c), and ADP had a modest effect on the Kd value for the NS3.ds9-C20 complex relative to ATP (Supplementary
Figure S1b and S1d). The inability to observe ds9-C20 unwinding under these conditions may reflect a small pro-portion of NS3 being located at the ss/ds junction.
It was possible that the observed increase in the Kd value for the NS3.ds9-C20 complex was due to ATP
hydrolysis. We performed three experiments to test this possibility. First, we used the non-hydrolyzable ATP analogue, AMPPNP. We observed a 5-fold increase in the Kd value for the NS3.ds9-C20 complex, suggesting that ATP binding is sufficient to reduce the affinity of NS3 for ds9-C20 (Figure 1c). Second, we used an NS3 derivative that lacks ATPase activity due to a substitution of alanine for aspartic acid at position 290 (D290A NS3). Asp-290 is located in conserved sequence motif II (DExH) and interacts with the divalent cation cofactor and perhaps the water nucleophile in the triphosphate-binding pocket/catalytic center (14). Again, ATP and AMPPNP increased the Kd value for the NS3-D290A.ds9-C20
complex (Figure 1c). However, the extent of
(a)
(b)
(c)
none
100 ± 10 AMPPNP (5 mM)
ATP (5 mM)
10 1 10
1 10
nucleotide Kd (nM)
WT NS3 D290A NS3 inc time
(min)
40 ± 10 50 ± 10
250 ± 50 300 ± 30
100 ± 10 200 ± 20
50 ± 10 100 ± 20 100 ± 10 0
50 100 150 200 250 300
0 100 200 300 400
[NS3] (nM) mP Kd = 50 ± 10 nM
5’-GCCGCCCGGCCCCCCCCCCCCCCCCCCCC-3’FL 3’-CGGCGGGCC-5’
ds9-C20
0 10 20 30 40 50 60 70
0 100 200 300 400
[ds9] (nM)
mP
- ATP
Kd = 90 ± 20 nM
+ ATP
0 20 40 60 80 100 120
0 5000 10000 15000 20000
[ds9] (nM)
Kd = 7000 ± 2000 nM (d)
none
ATP (5 mM) 1 1
nucleotide Kd (nM)
ds9 C20
inc time (min)
90 ± 20
7000 ± 2000
100 ± 20
5000 ± 1000 (e)
Figure 1. A minimal substrate to study unwinding by HCV NS3 helicase. (a) Unwinding substrate (ds9-C20) consists of a 29-nt RNA that is complementary to a 9-nt RNA. The 29-nt RNA is referred to as the loading strand because the 20-nt cytidylate tail is the site of NS3 binding. NS3 translocates in a 30!50 direction on the loading strand.
The 9-nt RNA is referred to as the displaced strand because it will be released during the unwinding process. The substrate used for binding measurements contains fluorescein covalently linked to the 30-end of the
loading strand. (b) ds9-C20 binds to NS3 with high affinity. Fluorescein-labeled ds9-C20 was titrated with HCV NS3. Binding was measured by monitoring the change in fluorescence polarization (mP). The data were fit to a hyperbola resulting in the Kd value of 50 ± 10 nM. (c) ds9-C20 binding to NS3 is antagonized by ATP and is independent of ATP hydrolysis. Fluorescein-labeled ds9-C20 was incubated with increasing concentrations of either WT or D290A HCV NS3 for 10 min followed by addition of buffer, ATP or AMPPNP (5 mM) and incubation for an additional 1 or 10 min prior to monitoring the change in fluorescence polarization (mP). The data were analyzed as described in panel b. (d) Competitive binding assay for ds9 in the absence and presence of ATP. Fluorescein-labeled C20 (1 nM) and competitor ds9 (0–2000mM) was incubated with NS3 (100 nM) for 10 min followed by addition of buffer or ATP (5 mM) and incubation for an additional 1 min prior to monitoring the change in fluorescence polarization (mP). Competitive binding for ds9 was measured by monitoring the change in fluorescence polarization (mP). The data were fit to a hyperbola to determine the IC50value for ds9. The amplitude for ds9 is 60 ± 10 mP in the absence of ATP and 50 ± 10 mP in the presence of ATP. The Kd,i value was determined by using the Cheng–Prusoff equation (Kd,i¼1þ ½ðdsIC509C20=KdÞ) (37). The
destabilization was 2-fold for NS3-D290A instead of 7-fold as observed for wild-type NS3. Finally, we per-formed these experiments in the presence of EDTA and observed destabilization of ds9-C20 binding to NS3 by ATP (Supplementary Figure S1b). We conclude that ATP binding to the ATPase catalytic site causes changes in NS3 that lead to the observed destabilization of the NS3.ds9-C20 complex.
NS3 equilibrates at the ss/ds junction of ds9-C20 in the presence of ATP
In order to get a sense for where NS3 interacts with the ds9-C20 substrate, we determined the Kd value for NS3 in complex with ds9 or C20. The C20-binding experiment was performed with a FL-labeled oligonucleotide as described earlier. However, the ds9-binding experiment had to be performed by using a competition format (‘Materials and Methods’ section and Figure 1d) because of position-dependent changes in theKd value measured for different versions of ds9-FL.
In the absence of ATP, the Kd values for complexes of NS3 with ds9 and C20 were within 2-fold of the value measured for ds9-C20 (Figure 1d). Therefore, the position of NS3 relative to the junction will be heterogeneous under conditions in which ds9-C20 is in excess of NS3. NS3 will completely coat ds9-C20 under conditions in which NS3 is in excess of ds9-C20.
In contrast, in the presence of ATP, theKdvalue for the NS3.ds9 and NS3.C20 complexes increased by 133- and
50-fold, respectively (Figure 1d). Under the same condi-tions, the NS3.ds9-C20 complex was only destabilized by
7-fold. Therefore, in the presence of ATP, NS3 may bind preferentially to the ss/ds junction. Identical results were observed in the presence of EDTA.
Binding of ds9-C20 to NS3 weakens ATP binding
In order to complete the analysis of the thermodynamics of substrate binding to NS3, we evaluated binding of ATP to NS3 by monitoring the quenching of the intrinsic fluo-rescence of NS3 (‘Materials and Methods’ section). ATP (0.2–5 Kd) was titrated into binding reactions containing NS3 (2mM) in the absence or presence (20mM) of the ds9-C20 unwinding substrate. Relative fluorescence inten-sity was plotted as a function of ATP concentration, and the data were fit to a simple binding model (an hyperbola). In the absence of RNA, the Kd value was 0.9 ± 0.1 mM (Figure 2). In the presence of RNA, theKdvalue increased to 7 ± 1 mM (Figure 2). TheKdvalues measured by using this direct-binding assay were substantially higher than those inferred from kinetic data (4,7).
Slow formation of an unwinding-competent NS3.ds9-C20
complex capable of single-step unwinding of the ds9-C20 substrate
Previous studies have shown that formation of unwinding-competent, NS3-RNA complexes requires incubation on the 15–60 min timescale (12). Although the physical basis for this slow activation is not known, it is possible that this activation reflects melting of basepairs at the ss/ds junction (3,5). Therefore, we
evaluated the time and temperature dependence of activa-tion of the NS3.ds9-C20 complex. The experimental
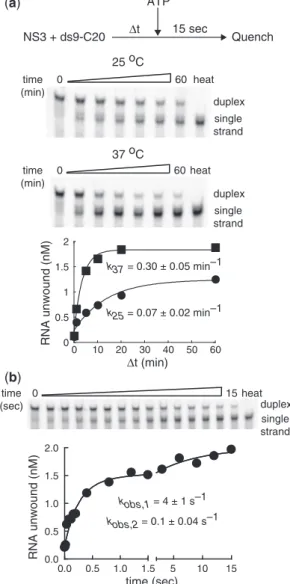
design is illustrated in Figure 3a. We mixed NS3 (2mM) with ds9-C20 (2 nM) for various amounts of time prior to the addition of ATP (10 mM). The incubation continued for 15 s followed by quenching with EDTA (100 mM), SDS (0.33%) and trap RNA (100 nM) to prevent reannealing of the displaced strand. Products were resolved from substrate by using native gel electrophoresis (Figure 3a). We chose an NS3 concentration of 2mM because this concentration should lead to incorporation of at least 90% of the ds9-C20 RNA into a complex with NS3 (Figure 1c) that is located at the ss/ds junction in the presence of ATP (Figure 1c and d). A 10-min incu-bation was sufficient to assemble active complexes on the ds9-C20 substrate, suggesting that the kinetics of forma-tion of an unwinding-competent, NS3-RNA complex is dependent on the RNA substrate employed.
We observed a temperature dependence on the rate constant for formation of activated NS3.ds9-C20
complex as well as the amount (amplitude) of activated NS3.ds9-C20 complex (Figure 3a). At 37C, the half-time
for formation of activated NS3.ds9-C20 complex was
2.3 min, with maximally 85% of the ds9-C20 RNA assembling into activated complexes (Figure 3a). At 25C, the half-time for formation of activated NS3.ds9-C20 complex was 9.9 min, with maximally 50%
of the ds9-C20 RNA assembling into activated complexes (Figure 3a). These data show that differences in assembly temperature can impact the extent of unwinding.
The temperature dependence for activation of the NS3.ds9-C20 complex is consistent with ATP-independent
melting of the duplex leading to activation (3,5). 1.0x10⁶
1.5x10⁶ 2.0x10⁶ 2.5x10⁶
0 1 2 3 4 5
[ATP] (mM)
relative fluorescence
Kd = 0.9 ± 0.1 mM -RNA
1.0x10⁶ 1.5x10⁶ 2.0x10⁶ 2.5x10⁶ 3.0x10⁶ 3.5x10⁶
0 5 10 15 20 25 30 35
[ATP] (mM)
Kd = 7 ± 1 mM +RNA
relative fluorescence
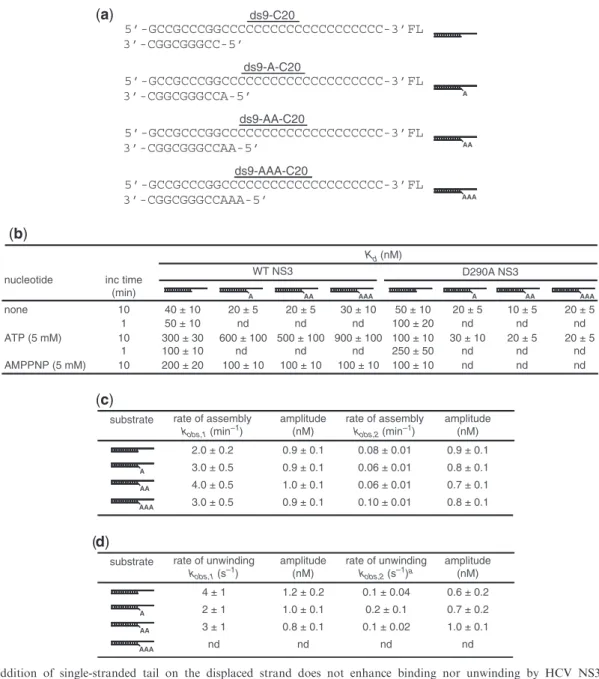
However, significant melting of the duplex is unlikely as duplexes 6–8 bp in length are not stable at 37C (Supplementary Figure S2). We constructed a series of modified ds9-C20 substrates in which one, two or three adenylate residues were added to the 50-end of the
displaced strand (Figure 4a). These ‘tailed’ substrates should mimic a pre-melted duplex and might lead to faster activation and/or a greater yield of activated complexes, both of which might now exhibit temperature independence. The affinity of NS3 for all of these substrates was on par with the ds9-C20 substrate, and the affinity was modulated by ATP (Figure 4b). However, neither the rate constant for activation nor the amount of activated complex was impacted by addition of the adenylate tail (Figure 4c). These data do not rule out melting of the duplex as the phenomenon dictating the temperature- and time-dependent activation of the NS3.ds9-C20 complex. They are consistent with the
‘receptacle’ for the displaced strand accommodating more than 6 nt and a 11–18 bp unwinding super-step (8).
Given that ds9-C20 was the simplest and most efficient of the substrates tested (Figure 4 and Supplementary Figure S3), we moved on to the evaluation of the kinetics of unwinding by the activated NS3.ds9-C20
complex. NS3 (2mM) was mixed with ds9-C20 (2 nM), incubated for 10 min at 37C, rapidly mixed with ATP (10 mM) by using a chemical-quench-flow apparatus, and quenched by addition of EDTA (100 mM), SDS (0.33%) and trap RNA (100 nM). Product was again resolved from substrate by using native PAGE (Figure 3b).
As expected, 90% of the substrate was converted to product over the course of the 15-s experiment (Figure 3b). Notably, the kinetics of unwinding were biphasic (Figure 3b). Seventy percent of the substrate that was competent for unwinding was turned over at a rate constant of 4 ± 1 s1; the remainder was turned over at a rate constant of 0.1 ± 0.04 s1(Figure 3b). The population that was unwound fastest did so without a demonstrable lag, consistent with unwinding occurring in a single sub-step. Multiple sub-steps cannot be ruled out unambiguously, especially if NS3 is capable of limiting the rate of dissociation of the displaced strand. This complex likely has at least one NS3 molecule bound to the ss/ds junction of the ds9-C20 substrate.
The composition and organization of the population that was unwound the slowest is not clear. This experi-ment was performed in the presence of 10 mM ATP. Our studies have suggested that theKd value of ATP is 7 mM for the NS3.ds9-C20 complex (Figure 1e). Therefore,
sub-saturating concentrations of ATP may lead to forma-tion of two kinetically distinct populations of NS3.ds9-C20 complex. To test this possibility, we
evaluated the ATP concentration dependence of the unwinding kinetics for the activated NS3.ds9-C20
complex. From 10–50 mM ATP, two populations were observed: one unwound ds9-C20 fast (2.4–6.4 s1
); the other unwound ds9-C20 slowly (0.1–0.3 s1) (Supplementary Figure S3). At 1 mM ATP, only the slow phase was observed (Supplementary Figure S3a). We conclude that under the conditions employed, a value of 10 mM ATP likely exceeds the Km value of ATP for ds9-C20 unwinding. Pre-melted substrates also exhibited biphasic kinetics of unwinding, with the fast phase occurring at a rate constant of 3–4 s1
(Figure 4d). 0
0.5 1 1.5 2
0 10 20 30 40 50 60 Δt (min)
RNA unwound (nM)
k37 = 0.30 ± 0.05 min–1
k25 = 0.07 ± 0.02 min–1 duplex
single strand time
(min)
0 60 heat
duplex
single strand time
(min)
0 60 heat
(a)
37 oC 25 oC
kobs,1 = 4 ± 1 s–1
kobs,2 = 0.1 ± 0.04 s–1 (b)
NS3 + ds9-C20 Δt ATP
Quench 15 sec
duplex single strand time
(sec)
0 15
0.0 0.5 1.0 1.5 0.0
0.5 1.0 1.5 2.0
5 10 15
time (sec)
RNA unwound (nM)
heat
Figure 3. Unwinding of ds9-C20 by NS3 is rapid. (a) Activation of the NS3.ds9-C20 complex for unwinding is slow and temperature depen-dent. NS3 (2mM) was incubated with ds9-C20 (2 nM) at either 25 or 37C for various amounts of time, unwinding was initiated by addition
of ATP (10 mM final), and the reaction was quenched 15 s later by addition of EDTA (100 mM final), SDS (0.33%) and trap RNA (100 nM). Products of the reactions were resolved from substrates by native PAGE and visualized by phosphorimaging; representative phosphorimages are shown. Phosphorimages were quantitated, and the concentration of RNA unwound plotted as a function of incubation time. The data were fit to a single exponential, yielding a rate constant for activation of NS3-RNA complexes of 0.07 ± 0.02 min1 at 25C
and 0.30 ± 0.05 min1
at 37C. The amplitudes were 1.0 ± 0.1 and
1.7 ± 0.1 nM at 25 and 37C, respectively. (b) Turnover of the activated
NS3.ds9-C20 complex. Experiments were performed essentially as described above. NS3 (2mM) was incubated with ds9-C20 (2 nM) at 37C for 10 min and prior to mixing the activated complex with
ATP. The concentration of RNA unwound was plotted as a function of time and fit to a double exponential, yielding rate constants of 4 ± 1 and 0.1 ± 0.01 s1
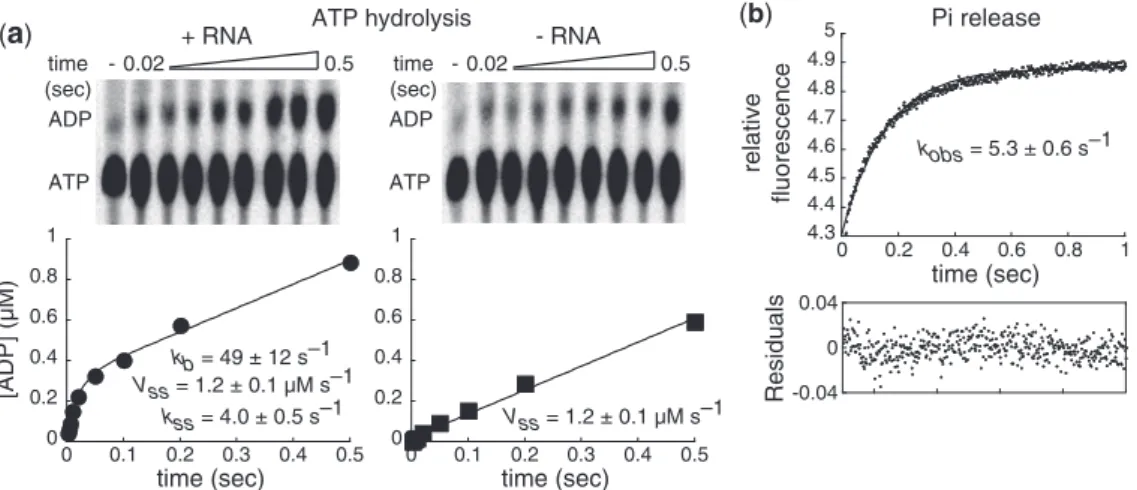
A ds9-C20-dependent burst of ATP hydrolysis in the pre-steady state
The observation of single-step unwinding of ds9-C20 by NS3 prompted the evaluation of the ATPase cycle. In this experiment, NS3 (2mM) was mixed with ds9-C20 (20mM),
incubated for 10 min at 37C, rapidly mixed with ATP (10mM) and quenched at various times by addition of EDTA (100 mM). The conditions of this experiment differ from those above. First, ds9-C20 is now in excess of NS3, which will favor formation of a NS3.ds9-C20
(a)
(b)
none
AMPPNP (5 mM) ATP (5 mM)
10 1 10
1 10
nucleotide inc time WT NS3 D290A NS3
(min)
40 ± 10 50 ± 10 300 ± 30 100 ± 10 200 ± 20
600 ± 100 20 ± 5
100 ± 10 nd
nd
20 ± 5
500 ± 100
100 ± 10 nd
nd
30 ± 10
900 ± 100
100 ± 10 nd
nd
50 ± 10 100 ± 20 100 ± 10 250 ± 50 100 ± 10
30 ± 10 20 ± 5
nd
nd nd
10 ± 5
20 ± 5 nd
nd nd
20 ± 5
20 ± 5 nd
nd nd
Kd (nM)
A AA AAA A AA AAA
5’-GCCGCCCGGCCCCCCCCCCCCCCCCCCCC-3’FL 3’-CGGCGGGCC-5’
ds9-C20
5’-GCCGCCCGGCCCCCCCCCCCCCCCCCCCC-3’FL 3’-CGGCGGGCCA-5’
5’-GCCGCCCGGCCCCCCCCCCCCCCCCCCCC-3’FL 3’-CGGCGGGCCAA-5’
5’-GCCGCCCGGCCCCCCCCCCCCCCCCCCCC-3’FL 3’-CGGCGGGCCAAA-5’
ds9-AA-C20
ds9-AAA-C20 ds9-A-C20
A
AA
AAA
(c)
substrate rate of assembly
kobs,1 (min–1)
2.0 ± 0.2
3.0 ± 0.5
4.0 ± 0.5
3.0 ± 0.5 A
AA
AAA
amplitude (nM)
0.9 ± 0.1
0.9 ± 0.1
1.0 ± 0.1
0.9 ± 0.1
rate of assembly
kobs,2 (min–1)
0.08 ± 0.01
0.06 ± 0.01
0.06 ± 0.01
0.10 ± 0.01
amplitude (nM)
0.9 ± 0.1
0.8 ± 0.1
0.7 ± 0.1
0.8 ± 0.1
d) substrate
A
AA
AAA
rate of unwinding
kobs,1 (s–1)
4 ± 1
2 ± 1
3 ± 1
nd
rate of unwinding
kobs,2 (s–1)a
0.1 ± 0.04
0.2 ± 0.1
0.1 ± 0.02
nd amplitude
(nM)
1.2 ± 0.2
1.0 ± 0.1
0.8 ± 0.1
nd
amplitude (nM)
0.6 ± 0.2
0.7 ± 0.2
1.0 ± 0.1
nd (
Figure 4. The addition of single-stranded tail on the displaced strand does not enhance binding nor unwinding by HCV NS3. (a) Additional substrates tested. The substrates (ds9-A-C20, ds9-AA-C20, ds9-AAA-C20) contain additional adenosine residues on the 50-end of the displaced
strand. The substrate used for binding measurements contains fluorescein covalently linked to the 30-end of the loading strand. (b) ds9-C20 substrates
containing a 50-adenosine tail bind to NS3 as well as the tailess substrate. Fluorescein-labeled unwinding substrates were incubated with increasing
concentrations of NS3 for 1 or 10 min followed by addition of buffer, ATP or AMPNPP (5 mM) and incubation for an additional 1 min prior to monitoring the change in fluorescence polarization (mP). The data were fit to a hyperbola. TheKd values are reported. (c) Kinetics of RNA activation of NS3-tailed-RNA complexes for unwinding is equivalent to tailess substrates. NS3 (2mM) was incubated with unwinding substrate (2 nM) at 37C for 10 min, unwinding was initiated by addition of ATP (10 mM) and the reaction was quenched 15 s later by addition of EDTA
(100 mM). Products were resolved from substrates by native PAGE and visualized by phosphorimaging. Phosphorimages were quantitated, and the concentration of RNA unwound plotted as a function of incubation time. The data were fit to a double exponential [Equation (5)], yielding rate constants for activation of NS3-RNA complexes. (d) The rate constant for unwinding of tailed RNAs is equivalent to tailess. NS3 (4mM) was incubated with unwinding substrate (4 nM) at 37C for 10 min then rapidly mixed with ATP (20 mM) using a chemical quench-flow apparatus. After
complex that contains an NS3 monomer. This change was required to ensure that only the ATPase activity of RNA-bound NS3 was monitored. Second, the concentra-tion of ATP was reduced substantially relative to the Kd for binding (Figure 1e) and Km for unwinding (Supplementary Figure S3). This change was required to ensure a signal-to-noise ratio suitable for quantitation. ATP hydrolysis was monitored by using thin-layer chro-matography (Figure 5a). This assay is incapable of distin-guishing NS3-bound ADP from dissociated ADP and provides no indication of the status of orthophosphate (Pi)—that is, bound or free.
We observed biphasic kinetics of ATP hydrolysis. There was a burst of ADP formation that occurred at a rate constant of 49 ± 12 s1 (Figure 5a) followed by a linear accumulation of ADP at a rate of 1.2 ± 0.1mM/s (Figure 5a). These data suggest that release of ADP and/or Pi is rate limiting in the steady state. Given a burst amplitude of 0.3mM, only 15% of the NS3.ds9-C20 complexes were competent for fast
hydro-lysis (Figure 5a), which could reflect the fraction of complexes to which ATP was bound at 10mM ATP. This possibility was ruled out by the observation that a 50% reduction in the concentration of ATP employed failed to reduce the amplitude by 50%, only the observed rate constant for hydrolysis (Supplementary Figure S4). We conclude that the amplitude reflects the concentration of complexes competent for ATP hydrolysis under these conditions. We used this amplitude to calcu-late a steady-state rate constant; a value of 4 s1 was obtained. This value is equivalent to that measured for the fast phase of unwinding by NS3 (Figure 3b). Interestingly, the burst of ATP hydrolysis was not
observed in the absence of RNA (Figure 5a). The steady-state rate was the same in the presence and absence of RNA (Figure 5a); however, this fact provides no mechanistic insight and could be merely coincidental.
These data provide a compelling correlation between the rate-limiting step of unwinding and a product-release step of the ATPase cycle. We performed additional exper-iments in the steady state to show that neither RNA con-centration (Figure 6a) nor ATP concon-centration (Figure 6b) could elevate the steady-state rate constant for ATP hydrolysis into the realm of that observed in the pre-steady state.
Phosphate release limits ATP turnover in the steady state
In order to determine the extent to which Pi release limited ATP hydrolysis in the steady state, we used the well-established assay for Pi release that is based on Pi binding to PBP from E. coli (17). Pi binding to a PBP modified with a coumarin-based fluorescent probe leads to a fluorescence change, the kinetics of which can be monitored in a stopped-flow apparatus (‘Materials and Methods’ section). The labeled PBP is referred to as MDCC-PBP.
We combined NS3 (2mM) with dc9-C20 (20mM) in a syringe that was maintained at 37C. In a second syringe, we combined ATP (10 mM) and MDCC-PBP (2mM). MDCC-PBP preparations generally contained 50% unlabeled protein (‘Materials and Methods’ section). We included 7-methylguanosine and purine nucleoside phosphorylase as a ‘sponge’ for Pi in both syringes to minimize background and maximize the observed fluores-cence change. The use of MDCC-PBP at a concentration
(a)
[ADP] (µM)
kb = 49 ± 12 s–1
kss = 4.0 ± 0.5 s–1
ATP hydrolysis
4.3 4.4 4.5 4.6 4.7 4.8 4.9 5
0 0.2 0.4 0.6 0.8 1 time (sec) Pi release
kobs = 5.3 ± 0.6 s–1
-0.04 0 0.04
relative
fluorescence
Residuals
0 0.2 0.4 0.6 0.8 1
0 0.1 0.2 0.3 0.4 0.5 time (sec) ADP
ATP time (sec)
0.02 0.5
-+ RNA
ADP
ATP time (sec)
0.02 0.5
-- RNA
0 0.2 0.4 0.6 0.8 1
0 0.1 0.2 0.3 0.4 0.5 time (sec)
Vss = 1.2 ± 0.1 µM s–1
Vss = 1.2 ± 0.1 µM s–1
(b)
Figure 5. Phosphate release is the rate-limiting step for ds9-C20 unwinding by NS3. (a) ds9-C20 activates NS3-catalyzed ATP hydrolysis. NS3 (4mM) was incubated in the presence (40mM) or absence of ds9-C20 at 37C for 10 min and then rapidly mixed with [a32
P]-ATP (20mM) using a chemical quench-flow apparatus. The reaction was quenched at various times by addition of EDTA (100 mM final). Product (ADP) was resolved from substrate (ATP) by TLC, visualized by phosphorimaging, and quantified. The data were fit to a single exponential followed by a steady-state resulting in a rate constant for the burst phase (kb) of 49 ± 12 s1
with an amplitude of 0.29 ± 0.03mM, and a rate for the linear phase (vss) of 1.2 ± 0.1mM s1. The steady-state rate constant (kss) was 4.0 ± 0.4 s1and was calculated by dividingv
ssby the amplitude. In the absence of RNA, the data were fit to a line, yielding a rate of 1.2 ± 0.1mM s1
sub-stoichiometric to NS3 was to ensure that we moni-tored only one round of Pi release, permitting the rate constant to be determined by a single exponential fit of the data. Upon mixing, an exponential increase in fluores-cence was observed that fit nicely to a single exponential rise (Figure 5b). The observed rate constant was 5.3 ± 0.6 s1, a value within error of both the steady-state rate constant for the ATPase cycle (Figure 5a) and the fast rate constant for ds9-C20 unwinding (Figure 3b). Reduction of the MDCC-PBP concentration to 1mM did not cause a significant change in the observed rate constant for Pi release. When MDCC-PBP was present in excess, a linear change in fluorescence was observed from which calculation of a rate constant proved too unreliable. We conclude that Pi release is the rate-limiting
step for the ATPase cycle of the NS3.ds9-C20 complex.
From these experiments, it is clear that ADP release cannot occur slower than Pi release. However, we cannot exclude the possibility that product release is random with both ADP and Pi release occurring at the same rate. Also, we cannot formally exclude the possibility that steps after ADP/Pi dissociation, such as binding of a second ATP molecule, do not contribute to the observed unwinding.
DISCUSSION
RNA helicases use chemical energy stored in the phosphoanhydride bond of ATP to perform mechanical work of RNA unwinding. How this happens is not clear. It is now known that despite an apparent large kinetic and physical step size for the NS3 helicase, unwinding requires sub-steps and perhaps sub-sub-steps (4,6). The smallest step is linked to hydrolysis of a single ATP (4,6). Whether this translates to 1-bp (4) or 3-bp (6) unwound still needs to be clarified.
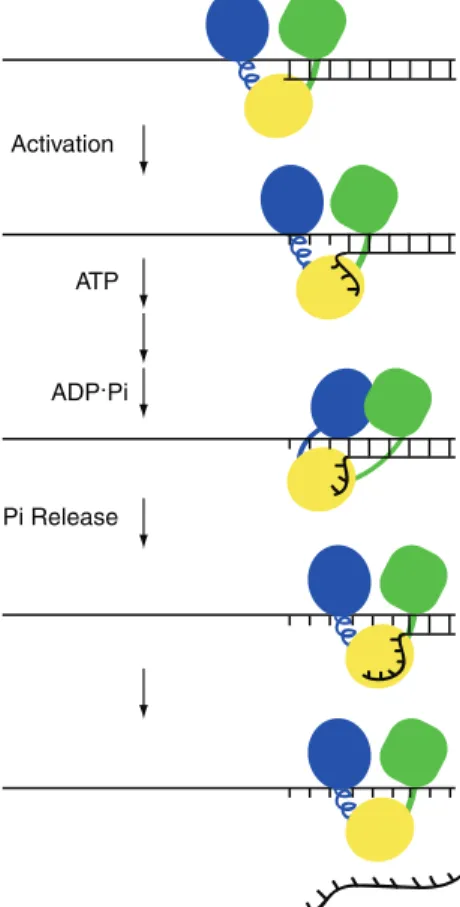
This study was initiated at a time when the prevailing thought was that the enzyme translocated in 3-bp sub-steps (6). We therefore assumed that at 37C, an unwinding substrate of 9-bp might require only a single sub-step for unwinding, especially given the reports of local melting of the duplex occurring after NS3 binding to the unwinding substrate (5). Unwinding of the ds9-C20 substrate employed here seems to function as expected, employing the mechanism shown in Figure 7.
NS3 binds to the unwinding substrate and slowly trans-forms into a complex competent for unwinding (Figure 7) (12). This isomerization may lead to local melting of the duplex as the rate constant for activation is temperature dependent (Figure 3a). Whether or not the melting is at the ss/ds junction (5) or within the duplex (3) is not known. However, an unwinding substrate with a pre-frayed end does not exhibit enhanced kinetics of unwinding (Figure 4c).
Next, ATP binds to the NS3.ds9-C20 complex. Our
study suggests that nucleic acid causes an 8-fold decrease in the affinity of NS3 for ATP (Figure 2). Reduced affinity for ATP in the presence of nucleic acid has been documented in the past for both full-length and truncated (NS3h) form of NS3 (7,23). However, an increase in affinity has also been reported for full-length NS3 (24). All of these studies inferred affinity from kinetic studies of the ATPase activity. This study employed a direct approach. While NS3-ATP and NS3.ds9-C20-ATP complexes show a change in intrinsic
fluorescence relative to NS3 and NS3.ds9-C20,
respec-tively, the same was not true for NS3h (25). Therefore, it is not absolutely clear that the site monitored by our studies represents the ATPase catalytic center. There has been some suggestion that NS3 has two ATP-binding sites, one of which could be remote from the catalytic site (25). The Kd value for ATP reported here is in the 1–7 mM range (Figure 2). Values obtained by others in the presence of RNA were: 25mM (24), 0.5 mM (7) and 3.4–4.6 mM (23).
0 1 2 3 4 5
0 5 10 15 20
[ATP] (mM) (b)
ADP
ATP
[RNA] (µM)
0 100
(a)
-rate of ATP
hydrolysis (s
–1
)
ADP
ATP
[ATP] (mM)
0 20
-rate of ATP
hydrolysis (s
–1
) [RNA] = 20 µM [ATP] = 10 mM
0 1 2 3 4 5
0 20 40 60 80 100 [RNA] (uM)
Figure 6. Steady-state rate constant for ATP hydrolysis is dependent on RNA concentration. (a) Titration of the RNA unwinding substrate. NS3 (200 nM) was incubated with [a32P]-ATP (10 mM) and various concentrations of ds9-C20 at 37C for 10 min and then quenched by
addition of EDTA to 100 mM. Product (ADP) was resolved from substrate (ATP) by TLC and visualized by phosphorimaging. The phosphorimage was quantitated, and the concentration of ADP was determined. Shown is the plot of the rate of ATP hydrolysis as a function of RNA concentration. (b) Steady-state rate constant for ATP hydrolysis is independent of ATP concentration at fixed RNA concentration. NS3 (200 nM) was incubated with ds9-C20 (20mM) and various concentrations of [a32P]-ATP at 37C for 10 min and
Binding of ATP to NS3 dramatically decreases the affinity of NS3 for RNA (Figure 1). Binding to ss/ds junction is affected less than binding to ds or ss RNA (Figure 1). This observation raises the important question: how does NS3 bind to RNA in the cell where concentrations of ATP likely exceed that of viral (and cellular) RNA? Binding of NS3 to RNA, especially viral RNA, may be facilitated by interactions with other viral proteins, such as NS5A or NS5B, that bind to viral RNA specifically and independently of ATP (10,26,27). Clearly, binding of NS3 to cellular RNA is not advantageous to the cell as the unwinding activity could lead to RNA remodeling and the ATPase activity could lead to ATP depletion. Our observations of the antagonistic effect of ATP binding on RNA binding and vice versa may explain
the observation that expression of NS3 is not toxic to cells (16,28–30).
Very limited information is available on the kinetics of ATP binding and dissociation. One study of NS3h sug-gested that the second-order rate constant for ATP binding to NS3h-RNA is 0.4mM1s1, three orders of magnitude slower than the second-order rate constant for RNA binding to NS3h (7). A study of NS3 suggested that the second-order rate constant for ATP binding to a paused NS3-RNA complex is 9.9 mM1 s1 (23). Given the uncertainty and extremes of the values for the rate constants for association and dissociation of ATP, as well as equilibrium dissociation constant for ATP, the ATP concentration employed in any experiment could significantly influence experimental outcome. For example, if the second-order rate constant is 9.9 mM1 s1, then at 1 mM, any process occurring faster than 2 s1
will be attenuated by binding and may not be observed.
Addition of ATP to the NS3.ds9-C20 complex led to
unwinding that was dependent on ATP concentration. At 1 mM ATP, incomplete unwinding was predicted; the observed rate constant was 0.1 s1(Figure S3). However, at 10 mM ATP, essentially all of the RNA was unwound. The kinetics of unwinding were biphasic. The rate constant for the first phase (70%) was 4 s1; the rate constant for the second phase (30%) was 0.1 s1 (Figure 3b). The rate constant of 4 s1 correlates to an unwinding rate that is consistent with our previous studies (20). However, displacement rate constants this fast have never been observed in ensemble experiments, only single-molecule experiments (4,6).
The reasons for the two rate constants observed for unwinding of the ds9-C20 substrate are not clear. It is possible that the organization of the NS3.ds9-C20
complex relative to the junction is different or the extent of activation is different (e.g. extent of duplex melting). Pyle has suggested that the use of a complementary trap for the displaced strand could artificially increase the burst amplitude (and perhaps rate) (8). This effect of trap was not observed in our system (Supplementary Figure S5a), consistent with the observed dependence of the amplitude of unwinding on ATP concentration (Supplementary Figure S3).
The existence of NS3-RNA complex capable of fast unwinding provides new opportunities for ensemble experiments to contribute to our understanding of helicase mechanism. The kinetics of the fast phase does not exhibit a lag, suggesting that a single step is sufficient for unwinding and that if sub- or sub-sub-steps are involved, then the rate constant(s) must be greater than 40 s1
for this substrate; rate constants that are sub-stantially faster than predicted by single-molecule experi-ments (4,6).
The possibility that one step was sufficient for unwind-ing encouraged evaluation of the ATPase cycle. Under the conditions employed, the steady-state rate constant for the ATPase cycle of the NS3.ds9-C20 complex was
also 4 s1
(Figures 3b and 6, and Supplementary Figure S4). The pre-steady-state rate constant for ATP hydrolysis by the NS3.ds9-C20 complex was 49 s1
Activation
ATP
ADP.Pi
Pi Release
using 10mM ATP (Figure 5a). These data suggest that ATP hydrolysis is faster than release of ADP or Pi. The ability to observe a burst at 10mM ATP would argue that the second order rate constant is >4mM1s1. It is important to note that very little unwinding is observed under conditions employed for pre-steady-state kinetic analysis of the ATPase cycle. This observation is not explained by the presence of inactive enzyme in our preparations (Supplementary Figure S5b). Caution is clearly warranted in the inter-pretation of the ATPase cycle relative to the unwinding cycle. However, these data suggested that ATP hydrolysis is unlikely to be the rate-limiting step of the ATPase cycle in the presence of nucleic acid.
Release of phosphate was measured by using PBP and the rate constant was5 s1 (Figure 5b). Taken at face value, these data suggest that any reiterative process coupled to the ATPase cycle would be limited by phos-phate release. Phosphos-phate release was recently found to limit the ssDNA-stimulated TTPase cycle for the ring-shaped T7 helicase (13). We have reached the same conclusion for the ssRNA-stimulated ATPase cycle of NS3 (Wanget al., in preparation). The data also suggest that our unwinding substrate is unwound in one cycle of ATP hydrolysis. It is unlikely that unwinding 1 bp would be sufficient, so these data are most consistent with a 3-bp sub-step per ATP hydrolyzed, although binding, hydroly-sis and phosphate release may act independently to translocate the enzyme through 1-bp sub-sub-steps. Under the conditions used, melting of 3 bp would be suf-ficient to prevent hybridization at 37C (Supplementary Figure S2b). DEAD-box proteins can melt multiple basepairs by using a single ATP without the requirement for hydrolysis (31–33). Hydrolysis in this case permits enzyme turnover (32).
The stoichiometry of ATP bound per bp unwound is, at best, inferred by all experiments performed on NS3 unwinding, including this study. However, phosphate release as a rate-limiting step would predict a pause between every round of ATP hydrolysis as has been observed in single molecule force experiments and ensemble experiments (4,9). Indeed, in these studies, release of the paused NS3-RNA complex depended on a first order rate constant of2–5 s1(4,9), which is clearly on the same order of magnitude as the rate constant for phosphate release determined here. Single molecule FRET experiments also suggest that 3-bp steps are limited by a rate constant of1 s1(6).
We propose that phosphate release contributes to the release of the ‘spring’ that moves NS3 by one sub-step. Phosphate release is the signal for conformational changes required for function in a variety of systems, from cytoskeletal motor proteins (34) to translation factors (35). The substrate described here is well suited to explore this possibility more deeply for the NS3 helicase by using ensemble experiments. In addition, the approach described here for NS3 should illuminate mechanisms for other DExH-box RNA helicases and may also permit direct comparison of this class of helicases to the DEAD-box class of enzymes (31–33,36).
SUPPLEMENTARY DATA
Supplementary Data are available at NAR Online.
ACKNOWLEDGEMENTS
We thank Piero Bianco and members of our laboratories comments on the manuscript.
FUNDING
National Institutes of Health (AI060563 to K.D.R. and C.E.C.). Funding for open access charge: NIAID/ National Institutes of Health (grant AI060563).
Conflict of interest statement. None declared.
REFERENCES
1. Bleichert,F. and Baserga,S.J. (2007) The long unwinding road of RNA helicases.Mol. Cell,27, 339–352.
2. Knipe,D.M., Howley,P.M., Griffin,D.E., Lamb,R.A.,
Martin,M.A., Roizman,B. and Straus,S.E. (2007)Field’s Virology. Lippincott Williams and Wilkins, Philadelphia, PA.
3. Cheng,W., Dumont,S., Tinoco,I. Jr and Bustamante,C. (2007) NS3 helicase actively separates RNA strands and senses sequence barriers ahead of the opening fork.Proc. Natl Acad. Sci. USA,
104, 13954–13959.
4. Dumont,S., Cheng,W., Serebrov,V., Beran,R.K., Tinoco,I. Jr, Pyle,A.M. and Bustamante,C. (2006) RNA translocation and unwinding mechanism of HCV NS3 helicase and its coordination by ATP.Nature,439, 105–108.
5. Levin,M.K., Gurjar,M. and Patel,S.S. (2005) A Brownian motor mechanism of translocation and strand separation by hepatitis C virus helicase.Nat. Struct. Mol. Biol.,12, 429–435.
6. Myong,S., Bruno,M.M., Pyle,A.M. and Ha,T. (2007)
Spring-loaded mechanism of DNA unwinding by hepatitis C virus NS3 helicase.Science,317, 513–516.
7. Preugschat,F., Averett,D.R., Clarke,B.E. and Porter,D.J. (1996) A steady-state and pre-steady-state kinetic analysis of the NTPase activity associated with the hepatitis C virus NS3 helicase domain.J. Biol. Chem.,271, 24449–24457.
8. Serebrov,V., Beran,R.K. and Pyle,A.M. (2009) Establishing a mechanistic basis for the large kinetic steps of the NS3 helicase.
J. Biol. Chem.,284, 2512–2521.
9. Serebrov,V. and Pyle,A.M. (2004) Periodic cycles of RNA unwinding and pausing by hepatitis C virus NS3 helicase.Nature,
430, 476–480.
10. Jennings,T.A., Chen,Y., Sikora,D., Harrison,M.K., Sikora,B., Huang,L., Jankowsky,E., Fairman,M.E., Cameron,C.E. and Raney,K.D. (2008) RNA unwinding activity of the hepatitis C virus NS3 helicase is modulated by the NS5B polymerase.
Biochemistry,47, 1126–1135.
11. Sikora,B., Chen,Y., Lichti,C.F., Harrison,M.K., Jennings,T.A., Tang,Y., Tackett,A.J., Jordan,J.B., Sakon,J., Cameron,C.E.et al. (2008) Hepatitis C virus NS3 helicase forms oligomeric structures that exhibit optimal DNA unwinding activity in vitro.J. Biol. Chem.,283, 11516–11525.
12. Pang,P.S., Jankowsky,E., Planet,P.J. and Pyle,A.M. (2002) The hepatitis C viral NS3 protein is a processive DNA helicase with cofactor enhanced RNA unwinding.EMBO J.,21, 1168–1176. 13. Donmez,I. and Patel,S.S. (2008) Coupling of DNA unwinding to
nucleotide hydrolysis in a ring-shaped helicase.EMBO J.,27, 1718–1726.
14. Pyle,A.M. (2008) Translocation and unwinding mechanisms of RNA and DNA helicases.Annu. Rev. Biophys.,37, 317–336. 15. Arnold,J.J. and Cameron,C.E. (2000) Poliovirus RNA-dependent
primer-template substrate (sym/sub).J. Biol. Chem.,275, 5329–5336.
16. Lohmann,V., Korner,F., Koch,J., Herian,U., Theilmann,L. and Bartenschlager,R. (1999) Replication of subgenomic hepatitis C virus RNAs in a hepatoma cell line.Science,285, 110–113. 17. Brune,M., Hunter,J.L., Corrie,J.E. and Webb,M.R. (1994) Direct,
real-time measurement of rapid inorganic phosphate release using a novel fluorescent probe and its application to actomyosin subfragment 1 ATPase.Biochemistry,33, 8262–8271.
18. Studier,F.W. (2005) Protein production by auto-induction in high density shaking cultures.Protein Expr. Purif.,41, 207–234. 19. Lakowicz,J.R. (1999)Principles of Fluorescence Spectroscopy.
Kluwer Academic, Plenum Publishers.
20. Tackett,A.J., Chen,Y., Cameron,C.E. and Raney,K.D. (2005) Multiple full-length NS3 molecules are required for optimal unwinding of oligonucleotide DNA in vitro.J. Biol. Chem.,280, 10797–10806.
21. Mackintosh,S.G., Lu,J.Z., Jordan,J.B., Harrison,M.K., Sikora,B., Sharma,S.D., Cameron,C.E., Raney,K.D. and Sakon,J. (2006) Structural and biological identification of residues on the surface of NS3 helicase required for optimal replication of the hepatitis C virus.J. Biol. Chem.,281, 3528–3535.
22. Donmez,I., Rajagopal,V., Jeong,Y.J. and Patel,S.S. (2007) Nucleic acid unwinding by hepatitis C virus and bacteriophage t7 helicases is sensitive to base pair stability.J. Biol. Chem.,282, 21116–21123.
23. Frick,D.N., Banik,S. and Rypma,R.S. (2007) Role of divalent metal cations in ATP hydrolysis catalyzed by the hepatitis C virus NS3 helicase: magnesium provides a bridge for ATP to fuel unwinding.J. Mol. Biol.,365, 1017–1032.
24. Locatelli,G.A., Spadari,S. and Maga,G. (2002) Hepatitis C virus NS3 ATPase/helicase: an ATP switch regulates the cooperativity among the different substrate binding sites.Biochemistry,41, 10332–10342.
25. Porter,D.J. (1998) Inhibition of the hepatitis C virus
helicase-associated ATPase activity by the combination of ADP, NaF, MgCl2, and poly(rU). Two ADP binding sites on the enzyme-nucleic acid complex.J. Biol. Chem.,273, 7390–7396. 26. Huang,L., Hwang,J., Sharma,S.D., Hargittai,M.R., Chen,Y.,
Arnold,J.J., Raney,K.D. and Cameron,C.E. (2005) Hepatitis C
virus nonstructural protein 5A (NS5A) is an RNA-binding protein.J. Biol. Chem.,280, 36417–36428.
27. Rajagopal,V. and Patel,S.S. (2008) Single strand binding proteins increase the processivity of DNA unwinding by the hepatitis C virus helicase.J. Mol. Biol.,376, 69–79.
28. Ikeda,M., Yi,M., Li,K. and Lemon,S.M. (2002) Selectable subgenomic and genome-length dicistronic RNAs derived from an infectious molecular clone of the HCV-N strain of hepatitis C virus replicate efficiently in cultured Huh7 cells.J. Virol.,76, 2997–3006.
29. Pietschmann,T., Lohmann,V., Rutter,G., Kurpanek,K. and Bartenschlager,R. (2001) Characterization of cell lines carrying self-replicating hepatitis C virus RNAs.J. Virol.,75, 1252–1264. 30. Yi,M., Bodola,F. and Lemon,S.M. (2002) Subgenomic hepatitis C
virus replicons inducing expression of a secreted enzymatic reporter protein.Virology,304, 197–210.
31. Chen,Y., Potratz,J.P., Tijerina,P., Del Campo,M.,
Lambowitz,A.M. and Russell,R. (2008) DEAD-box proteins can completely separate an RNA duplex using a single ATP.
Proc. Natl Acad. Sci. USA,105, 20203–20208.
32. Liu,F., Putnam,A. and Jankowsky,E. (2008) ATP hydrolysis is required for DEAD-box protein recycling but not for duplex unwinding.Proc. Natl Acad. Sci. USA,105, 20209–20214. 33. Yang,Q., Del Campo,M., Lambowitz,A.M. and Jankowsky,E.
(2007) DEAD-box proteins unwind duplexes by local strand separation.Mol. Cell,28, 253–263.
34. Gilbert,S.P., Webb,M.R., Brune,M. and Johnson,K.A. (1995) Pathway of processive ATP hydrolysis by kinesin.Nature,373, 671–676.
35. Algire,M.A., Maag,D. and Lorsch,J.R. (2005) Pi release from eIF2, not GTP hydrolysis, is the step controlled by start-site selection during eukaryotic translation initiation.Mol. Cell,20, 251–262.
36. Henn,A., Cao,W., Hackney,D.D. and De La Cruz,E.M. (2008) The ATPase cycle mechanism of the DEAD-box rRNA helicase, DbpA.J. Mol. Biol.,377, 193–205.
37. Cheng,Y. and Prusoff,W.H. (1973) Relationship between the inhibition constant (K1) and the concentration of inhibitor which causes 50 per cent inhibition (I50) of an enzymatic reaction.