The handle
http://hdl.handle.net/1887/28845
holds various files of this Leiden University
dissertation.
Author: Karska, Agata
Title: Feedback from deeply embedded low- and high-mass protostars. Surveying hot
molecular gas with Herschel
Feedback from deeply embedded
low- and high-mass protostars
Feedback from deeply embedded
low- and high-mass protostars
Surveying hot molecular gas with Herschel
PROEFSCHRIFT
ter verkrijging van
de graad van Doctor aan de Universiteit Leiden, op gezag van de Rector Magnificus prof. mr. C. J. J. M. Stolker,
volgens besluit van het College voor Promoties te verdedigen op woensdag 24 september 2014
klokke 11.15 uur
door
Agata Karska
Promotor: Prof. dr. E. F. van Dishoeck Leiden University,
Max-Planck-Institut für extraterrestrische Physik
Co-Promotor: Dr. G. J. Herczeg Kavli Institute, Beijing
Overige leden: Prof. dr. A. G. G. M. Tielens Leiden University Prof. dr. H. J. A. Röttgering Leiden University
Prof. dr. P. Caselli Max-Planck-Institut für extraterrestrische Physik
Prof. dr. N. J. Evans II University of Texas
Dr. B. Nisini Istituto Nazionale di Astrofisica (INAF), Rome
Feedback from deeply-embedded low- and high-mass protostars. Surveying hot molecular gas with Herschel.
Copyright©2014 Agata Karska
Thesis Universiteit Leiden - Illustrated – With summary in Dutch and Polish – With references
ISBN 978-94-6259-279-7
Printed by Ipskamp Drukkersipskampdrukkers.nl
Cover by Arte Buena/Monika Aleksandrowiczartebuena.eu
“Ignorancja nasza jest oceanem ogólno´swiatowym, za´s wiedza pewna – pojedynczymi wysepkami na tym oceanie”
Contents
1 Introduction 1
1.1 Interstellar medium and sites of star formation . . . 3
1.2 Evolution before the main sequence . . . 4
1.2.1 From dense cores to stars and planets . . . 4
1.2.2 Observational classification of young stellar objects . . . 5
1.3 Heating and cooling in deeply-embedded protostars . . . 7
1.3.1 Processes leading to gas heating . . . 7
1.3.2 Main cooling channels . . . 12
1.4 Herschel/PACS . . . 15
1.4.1 PACS spectrometer . . . 16
1.4.2 Comparisons to ISO/LWS . . . 18
1.4.3 WISH, DIGIT, and WILL programs . . . 18
1.5 This thesis . . . 19
2 Water in star forming regions with Herschel (WISH) III. Far-infrared cooling lines in low-mass young stellar objects 25 2.1 Introduction . . . 27
2.2 Observations . . . 29
2.2.1 Sample selection . . . 29
2.2.2 Observing strategy . . . 29
2.2.3 Reduction methods . . . 33
2.2.4 Spectral energy distributions . . . 34
2.3 Results . . . 34
2.3.1 Emission spectra . . . 34
2.3.2 Spatial extent of line emission . . . 36
2.3.3 Velocity shifts in [Oi] and OH lines . . . 40
2.4 Analysis . . . 40
2.4.1 Rotational diagrams . . . 40
2.4.2 Far-infrared line cooling . . . 44
2.4.3 Flux correlations . . . 47
2.5 Origin of far-IR line emission . . . 51
2.5.1 Spatial extent of line emission and correlations . . . 53
2.5.2 Excitation . . . 54
2.5.3 Comparison with shock models . . . 57
2.5.4 Evolution from Class 0 to Class I . . . 58
2.B Extended source correction method . . . 67
2.C Spectral energy distributions . . . 68
2.D Spatial extent of line emission . . . 71
2.E Comparing PACS and ISO far-IR spectra . . . 71
2.F Rotational diagrams . . . 71
2.G Correlations . . . 72
2.H Rotational temperature uncertainties . . . 72
2.I Cooling budget calculations . . . 72
3 Far-infrared molecular lines from low- to high-mass star forming regions ob-served with Herschel 85 3.1 Introduction . . . 87
3.2 Observations and data reduction . . . 89
3.3 Results . . . 91
3.4 Analysis . . . 93
3.4.1 Far-IR line cooling . . . 93
3.4.2 Molecular excitation . . . 99
3.5 Discussion: from low to high mass . . . 107
3.5.1 Origin of CO emission . . . 107
3.5.2 Molecular excitation . . . 110
3.5.3 Correlations . . . 113
3.5.4 Far-IR line cooling . . . 113
3.6 Conclusions . . . 116
Appendices 119 3.A Details of PACS observations . . . 119
3.B Continuum measurements . . . 121
3.C Tables with fluxes and additional figures . . . 123
3.D OH in low and intermediate mass sources . . . 125
4 Shockingly low water abundances in Herschel/PACS observations of low-mass protostars in Perseus 133 4.1 Introduction . . . 135
4.2 Observations . . . 137
4.3 Results . . . 139
4.3.1 Spatial extent of line emission . . . 139
4.3.2 Line detections . . . 142
4.3.3 Observed line ratios . . . 144
4.4 Analysis . . . 147
4.4.1 Model line emission . . . 147
4.4.2 Models versus observations – line ratios of the same species . . . 152
4.5 Discussion . . . 158
4.5.1 Shock parameters and physical conditions . . . 158
4.5.2 Abundances and need for UV radiation . . . 161
4.6 Conclusions . . . 164
Appendices 167 4.A Supplementary material . . . 167
4.B Correlations with source parameters . . . 175
5 Physics of deeply-embedded low-mass protostars: evolution of shocks, ultraviolet radiation, and mass flux rates 177 5.1 Introduction . . . 179
5.2 Observations . . . 181
5.2.1 Sample selection . . . 181
5.2.2 Observations and data reduction . . . 186
5.3 Results . . . 187
5.3.1 Detection statistics . . . 187
5.3.2 Cross-species line flux correlations . . . 188
5.4 Analysis . . . 190
5.4.1 CO excitation . . . 190
5.4.2 Molecular and atomic cooling . . . 194
5.4.3 Mass flux rates in jets and outflows . . . 196
5.4.4 Comparisons to models of shocks and photodissociation regions . 198 5.5 Discussion . . . 201
5.5.1 Origin of CO emission: a two-shock scenario . . . 201
5.5.2 Origin of [O I] emission: disk, jet, or UV-heated cavity walls? . . 202
5.5.3 Mass flux rates: evidence for jet evolution? . . . 204
5.6 Summary and conclusions . . . 205
Appendices 207 5.A Correlations of fluxes and flux ratios . . . 207
5.B Correlations with sources parameters . . . 208
5.C Rotational diagrams for the WILL sources . . . 209
Nederlandse samenvatting 215
Streszczenie w j ˛ezyku polskim 221
Bibliography 227
Publications 235
Curriculum vitae 239
1
The origin of our Solar System can be studied by observations of currently forming protostars in our Galaxy. Tracing the evolution of protostars that will eventually resemble our Sun is fundamental to understand our own origins. Low-mass stars (M∼0.08–1.5 M⊙) dominate the star formation in galaxies both in total mass and number (Kroupa 2002, Chabrier 2003). The less numerous high-mass stars (M &8 M⊙) strongly influence the formation of low-mass stars via strong radiation, winds, and injection of heavy elements and are therefore equally important to study (Zinnecker & Yorke 2007, Krumholz et al. 2014).
One of the most interesting aspects of star formation is the scale of material conden-sation needed to form a star: from about∼10 particles per cm3in the interstellar medium,
∼104cm−3 in molecular clouds,
∼106cm−3in dense cores and filaments, to
∼1024cm−3 in stellar cores (Mottram et al. 2013). The gravitational collapse alone is however too ef-ficient by a factor of∼20 in forming stars compared to the actual observed star formation rates (Leroy et al. 2008, Evans et al. 2009) and must be slowed down by some combina-tion of turbulence, radiacombina-tion, outflows, and magnetic fields (Evans 1999, Krumholz et al. 2014).
The inclusion of ‘feedback’ in simulations of star formation has a profound effect on the accretion, multiplicity, and mass of protostars, with implications for the shape of the initial mass function and formation of star clusters (Offner et al. 2014, Bate et al. 2014, Krumholz 2014). Feedback processes in low- and high-mass star forming regions are associated with high temperatures (&100K) and are thus not traced by the emission from cold dust. Instead, the high-temperature gas is being cooled in far-infrared molecular transitions (Goldsmith & Langer 1978). Quantifying this line emission is therefore crucial to identify additional physical processes in the surroundings of young stars and ultimately estimate their impact on the molecular clouds (Bate et al. 2014, Sales et al. 2014) and galaxy formation (Vogelsberger et al. 2014).
Validation of those simulations requires that the basic physical phenomenon are quan-titiatively understood: What are the physical conditions of the gas (temperature, density)
in low- and high-mass star forming regions? What are the dominant physical processes responsible for the gas heating (shocks, ultraviolet radiation)? How does the evolution proceed to the point where the envelope is fully dispersed and the stars become visible in the optical light? How does the process differ for stars of different mass?
Temperatures and densities of the physical regimes involved in the star formation process are best probed by far-infrared lines of in particular CO and H2O whose excita-tion depends on the local physical condiexcita-tions. The combinaexcita-tion of excitaexcita-tion studies and spectroscopy at high enough angular resolution presents the ideal tools to quantify which physical mechanisms are responsible for the gas heating.
1.1 Interstellar medium and sites of star formation
Table 1.1 – Physical characteristics of interstellar and circumstellar clouds
Name Density Temperature Extinction Examples (cm−3) (K) (mag)
Diffuse cloud 102 30-100 1 ζOph
Translucent cloud 103 15-50 1-5 HD 154368
Dense PDR 104
−105 50-500 <10 Orion Bar
Molecular cloud 102 10-20 >10 Perseus cloud
Dense core &105 8-15 10-100 L1544
Protostellar envelope
low-mass 104−106 8-100 10-100 L 1527
high-mass 104-107 20-100 50-500 AFGL 2591
Notes. The table presents typical physical parameters and is based on Table 2 from van Dishoeck et al. (2013), but with envelope parameters split into low- and high-mass protostars based on van der Tak et al. (2000, 2013), Jørgensen et al. (2002), Kristensen et al. (2012). The examples for diffuse and translucent clouds are the objects along their line-of-sight.
1.1
Interstellar medium and sites of star formation
Galaxies are mostly empty volumes with only a small fraction of space filled by stars and their planetary systems (e.g.∼3×10⁻¹⁰of space in Milky Way, Tielens 2010). Everything in between stars is referred to as interstellar medium (ISM). The main visual manifesta-tions of the otherwise hidden ISM are nebulosities seen around some young stars (e.g. reflection nebulae in the Pleiades) and some evolved stars (e.g. planetary nebulae and su-pernova remnants). In general, the diffuse and cold ISM is best revealed by absorption lines. The youngest stars are formed in the densest condensations of the ISM, which are opaque to visual light and seemingly devoid of stars.
Physical conditions in various clouds in the cold phase of the ISM are summarized in Table 1.1. The regions range from low-density diffuse and translucent clouds to dense pho-todissociation regions (PDRs, Tielens & Hollenbach 1985), illuminated by far-ultraviolet photons from nearby OB stars (FUV; 6−13.6 eV). Molecular clouds are regions with densities comparable to some PDRs but higher visual extinction (AV) and thus more ef-ficient UV shielding. The high density, low temperature regions of molecular clouds are dense cores, the sites of star formation. When the collapse begins, most of the material will accumulate in the envelope, the mass reservoir for the forming star(s).
stars, is only about 3-6% in the nearby molecular clouds (Padoan et al. 2014).
Simulations of molecular clouds reproduce the shape of initial mass function and low star formation efficiencies when feedback from protostars is included (Krumholz et al. 2014). For example, feedback from outflows driven by low-mass protostars adds turbu-lence to the cloud, while UV heating suppresses the fragmentation and slows down the infall of material onto the protostar (Offner et al. 2014, Bate et al. 2014, Krumholz 2014). On the other hand, recent results from extinction mapping and from the ‘Herschel Gould Belt Survey’ show large similarities between the stellar and pre-stellar core mass func-tions (within a factor of 3), suggesting that no additional physical processes are required, i.e. the role of feedback is not dominant (Alves et al. 2007, André et al. 2010, 2014). A better understanding of physics and chemistry in the immediate surroundings of proto-stars is therefore needed to resolve these discrepant results and link the star formation on local and global scales.
1.2
Evolution before the main sequence
1.2.1
From dense cores to stars and planets
Figure 1.1 illustrates the key phases of low-mass star formation. The star formation begins once enough cold material condenses in the dense core, leading to its collapse under self-gravity (i.e. the criteria for Jeans instability are satisfied, Jeans 1928). Larson (1969) first described the main stages of this collapse, in particular the Initial isothermal phase when, due to pressure gradients, the small region with high density quickly develops in the core center; the Formation of the opaque core, where adiabatic collapse leads to the formation of the first hydrostatic core (radius of∼5 AU and mass of∼5 Jupiter masses) and the
Formation of the second (stellar) core, triggered by dissociation of H2.
The formation of the stellar core marks the beginning of the Class 0 phase. During this phase, referred to by Larson as the main accretion phase, material from the dense envelope is accreted to the star-disk system, quickly increasing the mass of the central protostar. The infall/accretion of material on the rotating protostar in the presence of magnetic fields leads to the launching of bipolar jets in the direction perpendicular to the disk, see recent review by Frank et al. (2014). The collimated jets carve out cavities in the surrounding envelope, exposing the material to the stellar winds and UV photons. As a result, wider-angle bipolar outflows are formed, with shocks and entrainment occurring along the cavity walls. Such a low-mass protostar with its envelope and outflows is altogether referred to as a young stellar object (YSO).
1.2 Evolution before the main sequence
Prestellar Core
Class 0 Class I
Class III Planetary
System
30 000 AU 10 000 AU 300 AU
100 AU 50 AU
Figure 1.1 – Evolution of a collapsing dense core to a Sun-like star with a planetary system. The physical scales are indicated for each evolutionary stage. Adapted from Persson (2013).
particles, leading to the planetesimal and planet formation (Class III).
The evolution of protostars is therefore driven by the relative amount of mass in the envelope (Menv), central protostar (M⋆), and the disk (Mdisk). Physical classification based on the masses distinguishes four main Stages ((0-III), Robitaille et al. 2006, 2007) that ideally should correspond to more phenomenological Classes used in this thesis and in Figure 1.1. In the Stage 0 sources the envelope mass is much larger than that of the central protostar, Menv ≫ M⋆. In Stage I, the envelope mass becomes less than the mass of the protostar, M⋆>Menv. In Stage II, the disk mass is larger than that of the envelope, Mdisk >
Menv. Unfortunately, determining masses directly from observations is difficult (Crapsi et al. 2008) and therefore alternative methods of classification have been developed.
1.2.2
Observational classification of young stellar objects
quan-1 10 100 1000 1 2 10 100 1000
1 2 10 100 1000 1 2 10 100 1000
Black Body
Black
Body BlackBody
IR-Excess
Black Body
Disk?
Class 0 Class I
Class III Class II log λ F( λ ) log λ F( λ ) log λ F( λ ) log λ F( λ )
λ [μm] λ [μm]
λ [μm] λ [μm]
Disk
Figure 1.2 – Spectral energy distributions of low-mass young stellar objects. Class 0 sources are characterized by a single black-body spectrum from the cold envelope peaking at∼100µm (no emission in near-IR). Class I sources have lower extinction and thus a protostellar black body spec-trum slowly appears in the near-IR with a large IR excess (‘rising SED’) at longer wavelengths due to the remaining envelope and growing disk. Class II sources have flat or falling SEDs consisting of a pre-main sequence (T Tauri) stellar black-body and disk emission at mid- to far-IR. Class III sources show a stellar spectrum (more luminous than the main-sequence stars) with a possible weak contribution from the remaining disk. Figure by M. Persson.
tify the SEDs and construct the age sequences of protostars (for detailed discussion, see Evans et al. 2009).
Their main shortcoming is the uncertainty in the outflow/disk geometry, which can severely alter the shape of the SED. For example, when the disk is viewed face-on, mid-IR emission is easily detected by looking down the outflow cone, mimicking the more evolved sources. On the other hand, the edge-on disks hide the protostellar contribu-tion, and the SED is thus dominated by the cold envelope making the source appear less evolved.
1.3 Heating and cooling in deeply-embedded protostars
Table 1.2 – Classification of Class 0/I protostars
Method Class 0 Class I Reference
αa – 0.3 Lada & Wilking (1984), Greene et al. (1994) Tbol <70 70<Tbol<650 Myers & Ladd (1993), Chen et al. (1995)
Lsubmm/Lbol >200 <200 André et al. (1993),Young & Evans (2005)
L0.6
bol/Menv <2b 2b Bontemps et al. (1996)
LFIRL/Lbolc ∼10−2 ∼10−3 Giannini et al. (2001), Nisini et al. (2002b)
Notes. (a)Spectral index,α = dlog(λS (λ))/dlogλ, calculated using SED between 2 and 20µm
(λis the wavelength and S (λ) is the flux density at that wavelength). Class 0 sources with SEDs resembling a blackbody spectrum at T ∼15−30 K could not be classified in this scheme due to non-detections in mid-IR wavelengths.(b)For a protostar with bolometric luminosity L
bol =1 L⊙.
(c)Far-infrared line cooling, L
FIRL, is the sum of LOi+LCO+LH2O+LOH.
K (Myers & Ladd 1993). According to models of collapsing cores by Young & Evans (2005), the ratio of source luminosity longwards of 350µm and its bolometric luminosity is a good indicator of the ratio of mass in the star and the envelope (see also, André et al. 1993); the Lbol/Lsubmm ∼200 marks the transition from Class 0 to I. A tight correlation between envelope mass and bolometric luminosity in Class 0/I protostars led Bontemps et al. (1996) to describe the evolutionary stage using the L0.6
bol/Menvratio.
Far-IR lines are not sensitive to extinction and are often optically thin (e.g. highly-excited CO lines); as such, they provide an alternative to continuum slopes for deter-mining the evolutionary stage. Giannini et al. (2001) introduced a parameter LFIRL, the total line luminosity of species emitting in the far-IR, which decreases for more evolved sources. The underlying assumption was that the dominant excitation mechanism of far-IR emission (most likely outflow shocks) decreases in strength with evolution. If that is indeed the case, LFIRLcould serve as the most accurate evolutionary tracer of protostellar evolution.
1.3
Heating and cooling in deeply-embedded protostars
1.3.1
Processes leading to gas heating
Figure 1.3 – Cartoon of a low-mass young stellar object with various physical components and their nomenclature indicated. IWS stands for internal working surfaces. The spatial scales correspond to low-mass protostars and do not resolve the∼100 AU disk surrounding the protostar. Figure by R. Visser, adapted from van Dishoeck et al. (2011).
1.3.1.1 Envelope heating by protostellar luminosity
The main source of protostellar luminosity during the Class 0/I phase is the accretion
luminosity produced from the gravitational energy of the infalling gas from the dense
collapsing envelope, through the disk, and onto the star in extremely hot (>105K) accre-tion shocks. This luminosity heats mostly the inner parts of the envelope, since the large amount of dust quickly absorbs most of the protostellar radiation and re-radiates it in the form of far-IR continuum. The gas is then heated through gas-dust collisions. However, a fraction of the envelope cooling is also predicted to occur via atoms and molecules (Cec-carelli et al. 1996, Doty & Neufeld 1997, for early models of line emission from low- and high-mass envelopes, respectively).
Far-IR H2O emission was initially interpreted as arising purely from the collapsing envelope in Class 0/I sources (Ceccarelli et al. 1999) based on the single beam obser-vations (∼ 80′′) with the Long-Wavelength Spectrometer on board the Infrared Space
Observatory (ISO) (Kessler et al. 1996, Clegg et al. 1996). However, small maps with the
1.3 Heating and cooling in deeply-embedded protostars
Figure 1.4 – Rates of molecular cooling as a function of flow time of neutrals in C−(left) and J−type (right) shocks with3=20 km s−1 and pre-shock density of the ambient medium n = 105
cm−3. The temperature structure through the shock is shown on the right vertical axis. Adapted
from Flower & Pineau des Forêts (2010).
emission observed towards low-mass protostars with Herschel/PACS.
1.3.1.2 Shocks in outflow cavities and jets
Large-scale shocks are produced by the bipolar jets and protostellar winds impacting the envelope along the cavity walls. Theoretically, shocks are divided into two main types, the ‘continuous’ (C-type) and ‘jump’ (J-type) shocks, based on a combination of magnetic field strength, shock velocity, density, and level of ionization (Draine 1980, Draine et al. 1983, Hollenbach et al. 1989, Hollenbach 1997).
In C−type shocks, which occur in regions with strong magnetic fields and low ion-ization fractions, the weak coupling between the ions and neutrals results in a continuous change in the gas parameters (for an example of temperature profile, see Figure 1.4). Peak temperatures of a few 103 K allow the molecules to survive the passage of the shock, which is therefore referred to as non-dissociative.
In J−type shocks, physical conditions change in a discontinuous way, leading to higher peak temperatures than in C shocks of the same speed and for a given density (Figure 1.4). Depending on the shock velocity, J shocks are either non-dissociative (ve-locities below about∼30 km s−1, peak temperatures of about a few 104K) or dissociative (peak temperatures even exceeding 105 K), but the molecules efficiently reform in the dense post-shock gas (Figure 1.4).
Cooling of post-shock gas by H2is dominant in the outflow shocks, but negligible for lower−T gas due to a lack of low-lying rotational states and the large level spacing in
Figure 1.5 – Cartoon illustrating the inner regions of protostellar envelope where UV radiation from the protostar can dissociate the shocked gas and produce high−J CO emission (Jup & 24).
Adopted from Kristensen et al. (2013).
and CO are thus a better diagnostic of the shock type, shock velocity, and the pre-shock density of the medium (Hollenbach et al. 1989, Kaufman & Neufeld 1996, Flower & Pineau des Forêts 2010, 2012).
The characteristics of the first complete far-IR spectra of low-mass Class 0/I protostars obtained with ISO/LWS indicated an origin in the two distinct shocks (Giannini et al. 2001, Nisini et al. 2002b). The molecular emission was attributed to the slow, C−type shock in the cavity walls and the bright [Oi] emission arising from the J−type shock in the jet and/or bow-shock. A fraction of the [Oi] emission was also attributed to the UV heating from the protostar. The [Oi] contribution to the total cooling was higher for the more evolved sources.
This general picture finds support in the recent observations with Herschel, even though the details of the shock characteristics are still strongly debated. The [Oi] emis-sion is generally explained by J−type shocks (van Kempen et al. 2010b, Benedettini et al. 2012, Dionatos et al. 2013, Lee et al. 2013, Santangelo et al. 2013), but a convincing de-tection of the high velocity component is seen only towards low-mass source HH46 (van Kempen et al. 2010b). The molecular emission is attributed to slow (3∼15−40 km s−1), non-dissociative C−or J−type shocks, depending on the assumptions on the (spatially unresolved) size of the emitting region and the exact species (CO, H2O, OH, H2) that are treated together. An alternative explanation for the very high−J CO emission is
dissocia-tive shocks due to strong UV irradiation proposed by Kristensen et al. (2013), see Figure 1.5.
1.3.1.3 Ultraviolet heating and gas entrainment in the outflow cavity walls
The first observations of13CO J=6
1.3 Heating and cooling in deeply-embedded protostars
0 10 20 30 40
J u 10-19 10-18 10-17 10-16 10-15
Flux [W m
-2] Passive C-shocks UV Total CO
0 10 20 30 40
J u 10-19 10-18 10-17 10-16 10-15
Flux [W m
-2]
10 100 500 1000 2000 3000 4000 E
u / kB [K]
Figure 1.6 – CO fluxes observed with Herschel/PACS and APEX telescope (Ju<10) with model
predictions from a passively heated envelope (blue), a UV-heated cavity (green), and small-scale shocks in the cavity walls (red). The black line is the sum of the three. A cartoon of the different components is shown in the inset. Adopted from van Kempen et al. (2010b).
envelopes (Spaans et al. 1995, Hogerheijde et al. 1997). Spaans et al. (1995) explained this puzzling excess emission with additional heating of cavity walls by the ultraviolet photons from the∼10,000 K boundary layer where the accretion stream hits the star, scat-tered in the low-density outflow cavities. van Kempen et al. (2009a) adopted this model to describe the extended CO J =6−5 emission in the HH46, but with additional UV pho-tons created in the dissociative J−type shocks originating in the internal working surfaces in the jet and/or in the bow-shock at the tip of the jet (Neufeld & Dalgarno 1989).
The UV heating was subsequently invoked to explain the bulk of CO Jup ∼10−20 emission detected with Herschel/PACS (van Kempen et al. 2010b, Visser et al. 2012). In models of HH 46 (Figure 1.6), 45% of the total CO emission is excited by UV heating, 48% is excited in small scale C−type shocks, and 7% is excited in the passively heated envelope (Visser et al. 2012). Modeling of two additional sources in Visser et al. (2012) showed that the contribution of the UV heating to the total line cooling increases as the protostar evolves, from∼20% in the young Class 0 protostar up to∼80% in Class I/II protostar.
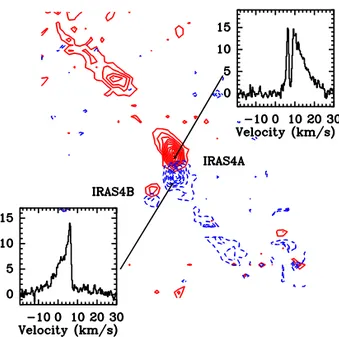
Figure 1.7 – 12CO 6-5 line profiles at the blue and red outflow positions of NGC 1333 IRAS 4A.
The integrated emission in the blue (-20 to 2.7 km s−1) and red (10.5 to 30 km s−1) velocity ranges
with respect to the source velocity is shown as contours. Figure by U. A. Yıldız, based on Yıldız et al. (2012).
the envelope. The excess emission from the observations was proposed to arise in the UV-heated component (following van Kempen et al. 2009a,b), since the narrow shape of13CO line profiles and the low abundances of13CO with respect to the CO made the outflow origin unlikely. The emission in the broad component in the12CO line was interpreted as arising in the entrained outflow gas with a kinetic temperature of∼100 K. The amount of gas mass in the UV-heated and the outflow components was found to be comparable.
1.3.2
Main cooling channels
Any single dust grain located in Class 0/I envelopes absorbs ultraviolet photons from the central protostar, heats up, and then cools by emitting radiation at far-infrared wave-lengths. This cooling channel is the dominant source of far-IR continuum radiation. The resulting far-IR continuum is thus an excellent tracer of envelope properties (size, density, temperature) that can be derived from simple modified blackbody fitting (e.g. Goicoechea et al. 2012) or more complicated radiative transfer models (e.g. Young & Evans 2005, Kristensen et al. 2012). On the other hand, the dust emission does not trace the warm gas of young stellar objects that is heated directly by shocks or the photoelectric effect in other physical components and can only be studied using lines.
vari-1.3 Heating and cooling in deeply-embedded protostars
PARA
5 4 3 2 1 0
0 100 200 300 400 500 Energy [K]
KC quantum number
HIFI (GHz)
PACS (µm)
BOTH 0 JKaKc
00 111 202 211 220 3 13 3 22 4 04
413 331
4 22 5 15 1113 987 752 139 90 125 ORTHO
0 1 2 3 4 5
101 1 10 2 12 2
21 303
3 12 3 21 4 14
330 423
5 05 557 1153 1097 108 180 174 113 79 136 1670 179
Figure 1.8 – Energy levels of ortho- and para-H2O with some important transitions observed in
the WISH program with Herschel/PACS (inµm) and Herschel/HIFI (in GHz) indicated (adopted from van Dishoeck et al. 2011). In fact, as many as∼65 H2O lines were detected with PACS in
NGC 1333 IRAS 4B (Herczeg et al. 2012).
ous species was scarce, the models based on the energy level structure, Einstein coefficient for spontaneous emission (A), and the collision rate coefficients were mostly correct. For densities&104cm−3and T
∼10 K, a large number of species including H2O, hydrides (e.g. OH), molecular ions (emitting in the sub-millimeter regime), and diatomic molecules (e.g. CO) dominated the total line cooling. Neufeld & Kaufman (1993) extended these predictions to warmer gas (T &100) of similar densities, focusing on H2, H2O, and CO, and suggested that H2O may be even the dominant coolant in such gas if its predicted high abundances are correct. The other reasons for the dominant role of H2O, CO, and a possible importance of OH, in gas cooling are discussed below.
1.3.2.1 H2O
The routes of H2O formation include ion-molecule reactions at T ∼10 K, very efficient high temperature neutral-neutral reactions in shocked gas (T &230 K), and formation on the grains (ice abundances as high as 10−4) followed by evaporation into the gas phase at
T ∼100 K (van Dishoeck et al. 2011, 2013). In dense and relatively warm environments of young protostars, the abundances of H2O are expected to be high.
The large dipole moment (µD=1.85 D) of H2O and the high frequencies (ν) of the tran-sitions result in relatively large spontaneous radiative rates compared to other molecules, proportional toµ2
Dν
3(Einstein A coefficients). Therefore, H
2O is de-excited by line emis-sion (radiation) and not by colliemis-sions in protostellar envelopes, where densities are a few orders of magnitude lower than the critical density needed for thermalization. That im-plies that the level population typically cannot be described by a Boltzmann distribution at the gas kinetic temperature; the rotational temperature calculated based on H2O lines is therefore set by a combination of the temperature and density.
Giannini et al. (2001) first quantified the role of H2O in the total gas cooling in Class 0 protostars using the complete far-infrared spectra obtained with ISO/LWS. H2O, CO, and [Oi] were found to contribute each∼30% of the total gas cooling, with the remaining emission originating in OH. Nisini et al. (2002b) extended this study to Class I sources and demonstrated a decrease in molecular cooling as a protostar evolves.
1.3.2.2 CO
CO is the second most abundant molecule in the ISM after H2 (CO/H2 = 10−4) with level energies scaling as∝J(J+1) (Figure 1.9). Due to the relatively high mass of the molecule the levels are closely spaced, with the few lowest−J transitions lying at sub-/mm wavelengths and J & 10 in the far-IR. In contrast to H2O, CO has a very small dipole moment (µD=0.1 D) and its low−J transitions are easily collisionally excited even at low densities, providing a better diagnostic of gas kinetic temperature.
CO lines with upper levels as high as Jup=49 and 36 CO lines in total have been de-tected with Herschel/PACS towards low-mass young stellar objects (Herczeg et al. 2012, Goicoechea et al. 2012, Green et al. 2013, Manoj et al. 2013). Such a large number of tran-sitions contribute a significant fraction of the total line cooling, but can also prove useful in determining the physical conditions of gas (its temperature and density) in young proto-stars. In fact, many protostars observed with PACS show CO emission at two (rotational) temperatures,∼350 K and&700 K, suggesting that the origin is in two distinct physical components (van Kempen et al. 2010b, Visser et al. 2012). Alternatively, the origin is in a single low-density, hot component (Neufeld 2012, Manoj et al. 2013). In either case, the physical origin(s) is not yet fully understood.
1.3.2.3 OH
OH is a free radical i.e., it has one unpaired electron, and thus its energy levels are divided into two ladders corresponding to opposite orientations of the unpaired electron spin with respect toΛ, the projection of angular momentum on the molecular axis (Figure 1.9). The levels are further split into two configurations, depending on whether the symmetry axis of the unpaired electron orbital motion is coincident or orthogonal to the internuclear axis (Λ-doubling). The interaction between the spins of the unpaired electron and the hydrogen nucleus results in magnetic hyperfine splitting (Tennyson 2005).
1.4 Herschel/PACS
Figure 1.9 – Energy levels of CO (right) and OH (left) observed with Herschel/PACS. Blue arrows indicate transitions detected towards low-mass protostars in the full-spectrum mode, while red arrows indicate the lines targeted and detected towards most sources in the WISH program. The OH diagram is adopted from Wampfler et al. (2013).
T &230 K). The backward reaction leading to the H2O destruction and OH formation requires hydrogen in the atomic form and therefore depends on the local UV field or presence of dissociative shocks (Wampfler et al. 2013). These conditions can occur in
J−type shocks along the jet or in a bow shock or in UV-irradiated cavity shocks in low-mass young stellar objects and thus explain the relatively large OH cooling,∼3% in Class 0 and∼20% in Class I sources (this thesis, Karska et al. 2013).
1.4
Herschel
/
PACS
Herschel was a 3.5 m space telescope operating from mid-2009 to mid-2013 at the L2
point located 1.5 109m ‘behind’ the Earth as viewed from the Sun (Pilbratt et al. 2010a). The telescope was equipped with three complementary instruments designed for observa-tions at the far-infrared and submillimeter wavelengths:
a single pixel heterodyne spectrometer observing at 480-1910 GHz (157-625µm) with very high spectral resolving power, R= λ/∆λ & 106(d3
∼0.1 km s−1) and diffraction limited beam of∼11-45”.
• PACS – the Photodetector Array Camera and Spectrometer (Poglitsch et al. 2010) – consists of two subinstruments: an imaging photometer and an integral-field spec-trometer, both sensitive to emission at 50−210µm with blue and red bands observed simultaneously. The photometer consisted of two bolometer arrays with 16×32 and 32×64 pixels covering a field of view 1.75’×3.5’ in the 60-85 µm/ 85-125µm and 125-210µm bands. The spectrometer consisted of a 5×5 array of spaxels, each corresponding to 9.4”×9.4” on the sky, and a total field of view of 47”×47”. The spectral resolving power is R∼1000−5500 (d3∼60−320 km s−1) depending on the grating order.
• SPIRE – the Spectral and Photometric Imaging Receiver (Griffin et al. 2010) – an imaging photometer and an imaging Fourier transform spectrometer observing at 194-672µm with spectral resolution R∼40−1000 at 250µm.
A more detailed description of the PACS spectrometer and its comparison to the Long Wavelength Spectrometer on ISO are presented in the following sections.
1.4.1
PACS spectrometer
The key scientific goal of the PACS spectrometer was to provide medium resolution ob-servations (R∼1500) of weak spectral lines on top of a much stronger far-infrared contin-uum, particularly of extragalactic sources (Poglitsch et al. 2010). In order to achieve the required sensitivity, but also the sufficient baseline coverage and high tolerance to point-ing errors without compromispoint-ing spatial resolution, the integral-field unit (IFU) design was selected.
In the PACS IFU spectrometer, the two dimensional image from the 5×5 array is trans-formed by the image slicer into a one dimensional entrance slit for the grating spectrome-ter, as illustrated in Figure 1.10. The spectrometer consists of two Ge:Ga photoconductors arrays (for blue and red bands) with 16 spectral elements and 25 spatial pixels (spaxels), that determine the spectral and spatial resolution of the instrument.
The grating is operated in the 1st, 2nd, and 3rd orders to cover the full wavelength range, with special order sorting filters suppressing contributions by other orders. The respective wavelengths are 102-210µm (1st order), 71-105µm (2nd), and 51-73µm (3rd), but the order overlap regions and spectrum>190µm is not instantly usable (see Appendix A in Herczeg et al. 2012).
1.4 Herschel/PACS
Figure 1.10 – Integral-field spectroscopy with PACS. The 5×5 array of spaxels is
re-arranged by the image slicer along the entrance slit of the grating spectrograph to observe simultaneously all 25 spectra. Adopted from the PACS Observer’s Manual (http://herschel.esac.esa.int/Docs/PACS/html/pacs_om.html).
is about 1400 km s−1at 63µm and 3000 at 108µm, with typically 1-2 pixels per full width half maximum (FWHM), respectively.
The telescope point spread function (PSF) is asymmetric, with the size increasing with wavelength and not diffraction limited below∼130µm. As a consequence of the fixed size of the spaxels, the fraction of the PSF viewed by the spaxels differs depending on the wavelength. At 63µm, the central spaxel views 70% of a perfect point-source emission, while at 186µm (CO 14-13) only 42 % is captured. It is thus important to account for the flux outside the central spaxel, in particular when comparing line fluxes at different wavelengths.
The two main observing schemes on PACS were the line spectroscopy and the range spectroscopy modes. The line spectroscopy mode allows observations of small spectral regions (∆λ ∼0.5-2 µm) around selected lines and is particularly well suited for deep integrations. The range spectroscopy mode provides the full spectrum from∼50 to 210 µm but the spectral sampling within a resolution element is about 3-4 times coarser than in the line spectroscopy mode.
emission unrelated to the source. In cases where the contamination was still high at those distances, the signal is modulated by moving the line over about half of the FWHM and the differential line profile is measured.
1.4.2
Comparisons to ISO
/
LWS
The ISO/LWS was the only instrument before PACS that offered the access to the com-plete far-IR window, with a spectral range of 45-197µm (Kessler et al. 1996, Clegg et al. 1996). The telescope was operational in 1995-1997.
ISO had a relatively small diameter of 0.6 m and thus the LWS beam was∼ 80′′, nearly an order of magnitude larger than in case of Herschel/PACS. As a consequence, the spatial information of the line and continuum emission was lacking. The emission in a single beam from protostars was often contaminated by nearby sources, their outflows, and the PDR emission from the cloud.
A factor of∼6 increase in the telescope diameter and the IFU design of the PACS instrument provides an improved spatial resolution. As a consequence, the spatial extent of line emission coupled with the more accurate excitation analysis allows us to trace the origin of far-IR line and continuum emission. In particular, the [Oi] and [Cii] emission patterns demonstrate whether the emission is dominated by the large scale cloud PDR or a protostar.
The spectral resolving power of LWS was∼200, about a factor of 10 lower than PACS. The Fabry-Perot mode offered a higher spectral resolution, but the sensitivity was so low that only a few brightest sources could be observed. The higher spectral resolution and sensitivity of PACS with respect to LWS was therefore crucial to detect weak molecular lines, especially on top of the bright continuum. The CO lines up to Jup=49 are detected in NGC1333 IRAS4B (20 more lines than with ISO!) and reveal two components on CO diagrams (Herczeg et al. 2012, Goicoechea et al. 2012, Manoj et al. 2013, Green et al. 2013). The detections of H2O lines in Class I sources improve our understanding of the evolution of molecular cooling from Class 0/I protostars and allow us to model the physical conditions at which H2O is produced (Herczeg et al. 2012).
1.4.3
WISH, DIGIT, and WILL programs
1.5 This thesis
The ‘Dust, Ice, and Gas in Time’ (DIGIT) open time key program uses the full PACS 50-210µm spectra of about 30 Class 0/I protostars to quantify the dust and gas evolution in the far-IR (Green et al. 2013). All the targeted sources have good quality mid-IR and sub-mm observations, which together with PACS spectra allow the determination of the full SED and the search for and analysis of solid-state features. The full inventory of far-IR gas lines provides a unique measurement of total far-infrared line cooling and is a useful guide for analysis of WISH/PACS data, where mostly selected lines were targeted. The ‘William Herschel Line Legacy’ (WILL) survey obtained PACS and HIFI spectra toward an unbiased flux-limited sample of low-mass protostars newly discovered in the recent Spitzer and Herschel Gould Belt imaging surveys (e.g. Evans et al. 2009, André et al. 2010). Its main aim is to study the physics and chemistry of H2O and related species in star-forming regions in a statistically significant way by doubling the sample of low-mass protostars observed in the WISH and DIGIT programs.
1.5
This thesis
The central theme of this thesis is the feedback from protostars onto their surroundings during the first 0.5 million years of protostellar life (Dunham et al. 2014). The feedback is elucidated by means of astrochemistry – the molecules and atoms are used as tracers of physical conditions of the emitting gas and the associated physical processes. Far-infrared spectroscopy from the Herschel Space Observatory (2009-2013) unravels the spatial scales and energetics of the protostellar feedback at unprecedented detail. Large
Herschel surveys of protostars at various evolutionary stages and masses reveal global
properties of young stellar objects and their evolution during the deeply-embedded stage that cannot be studied at visible wavelengths. The most important questions specifically addressed in this thesis are the following.
• What is the origin of far-infrared emission in the surroundings of young stellar ob-jects? Can we quantify the feedback from protostars on envelope spatial scales using molecular lines of CO, H2O, and OH, and atomic [Oi]?
• What is the role of shocks and ultraviolet radiation in low-mass protostars and on which scales?
• What is the cooling budget of hot gas in deeply-embedded protostars? Which feed-back processes determine the total line cooling?
• How do physical processes responsible for the gas heating change with evolution? How robust is the total gas cooling as an evolutionary tracer?
• What is the impact of protostellar mass on the properties of the far-infrared emission? Are the dominant excitation mechanisms of CO the same in low- and high-mass star forming regions?
These questions are addressed in the following chapters. The names of the projects on
Chapter 2 – Far-IR cooling lines in low-mass young stellar objects [WISH]
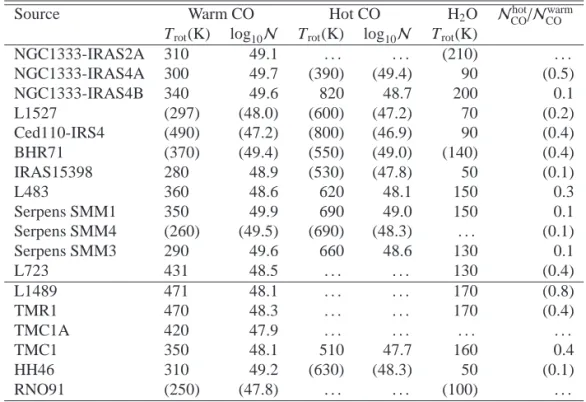
A spectral survey of 18 low-mass protostars reveals rich molecular and atomic far-infrared emission. CO lines from J=14-13 to J=49−48 and even highly-excited H2O lines (for example, the H2O 818–707 line with the upper level energy above 1000 K) are detected. Boltzmann diagrams of CO show two temperature components, at∼350 K and∼700 K, whereas H2O diagrams show a single component at∼150 K and a significant scatter due to subthermal excitation. A broad range of corresponding gas physical conditions is found using non-LTE radiative transfer calculations. Similar patterns of spatially-extended H2O and CO emission and their strong flux correlations found in the survey indicate high-densities (nH & 106 cm−3) and moderately-high temperatures (Tkin & 350 K) of the exciting gas. Comparisons to shock models yield consistent results suggesting that H2O
and CO originate most likely in non-dissociative shocks. In contrast, at least a fraction
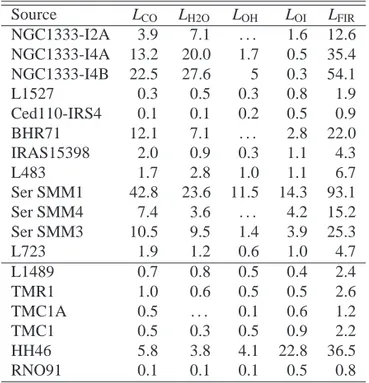
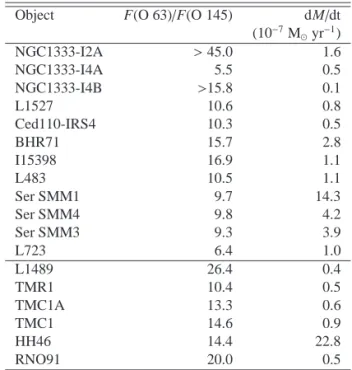
of OH and [Oi] emission originates in a different physical component, since no spatial or strong flux correlations are found between those species and CO or H2O. Dissociative shocks at the point of direct impact of the wind on the dense envelope are the most likely excitation mechanism, since only a small fraction of [Oi] emission is seen in the high-velocity wings tracing a hidden atomic jet. The total far-infrared gas cooling budget is dominated by H2O and CO (up to 50%) with an increasing contribution of [Oi] for more evolved sources (up to 30% of total cooling). The absolute value of the total gas cooling and its ratio with the source bolometric luminosity decrease with evolution from Class 0 to Class II sources and therefore are useful evolutionary tracers.
Chapter 3 – Far-IR molecular lines from low- to high-mass star forming regions [WISH]
A survey of 10 high-mass star forming regions extends the study of low-mass protostars from Chapter 2 to more massive objects. Rich far-infrared molecular spectra are detected at the central position of PACS maps. Many H2O lines are detected in absorption against the bright continuum emission, in particular at shorter wavelengths, and do not contribute to the gas cooling. Instead, the total cooling is dominated by CO (typically∼75%) and [Oi] (∼20%) with a minor contribution of H2O and OH (below∼1%). Even though CO transitions up to Jup ∼ 29 are detected, only one temperature component at∼ 300 K is seen on the CO rotational diagrams. In contrast with low-mass protostars, radiative trans-fer modeling shows that most of CO emission originates from the quiescent envelope (up to 70-100 %), except the highest−J lines that require an additional physical
1.5 This thesis
Chapter 4 – Shockingly low water abundances in Herschel/PACS observations of low-mass protostars in Perseus [WILL]
A large and uniform sample of young protostars (22 objects) located exclusively in the Perseus molecular cloud is observed in selected transitions of H2O, CO, and OH. Line ra-tios of the same and different species are used as diagnostics of shocks resulting from the envelope-outflow interactions. Changes in absolute line fluxes and line ratios as a func-tion of shock velocity and pre-shock density are discussed and compared with steady-state non-dissociative and dissociative shocks from the literature. Observed line ratios of the same species are well-reproduced by existing models of non-dissociative C−shocks with velocities& 20 km s−1 and pre-shock densities of∼105cm−3. In contrast, model line ratios of H2O/CO, H2O/OH, and CO/OH are overestimated with respect to the observations by one to two orders of magnitude. The most likely reasons for these dis-crepancies are too large H2O abundances and too small OH abundances produced in the shock models. Inclusion of illumination of shocks by ultraviolet radiation from the proto-stellar environment should allow to reconcile the models with observations.
Chapter 5 – Physics of deeply-embedded low-mass protostars: evolution of shocks,
ul-traviolet radiation, and mass loss rates [WISH, DIGIT, WILL]
A combined survey of 90 low-mass protostars sheds more light on the physical com-ponents and their evolution giving rise to the far-infrared emission observed with Herschel
/PACS. Rich molecular spectra are detected towards 70 out of 90 sources, including∼30 sources with the detection of highly-excited H2O and CO emission. Median CO rotational temperatures are∼320 K and∼690 K, in line with previous studies. The total cooling in CO decreases as the protostar evolves, but the [Oi] emission is surprisingly similar in the Class 0 and I stages. Comparison of [Oi] line emission to the shock models implies a necessary contribution from dissociative J−shocks and/or UV irradiation of outflow cavities. The [Cii] emission, on the other hand, must originate in photodissociation re-gions, characterized by densities of 104
The main conclusions from this thesis are summarized below.
1. Far-infrared molecular line emission is ubiquitous in star forming regions (Chapters 2-5). 80% of low-mass protostars show detections of CO, H2O, and OH lines. 40% of those sources show also highly-excited lines of CO and H2O (Chapter 5).
2. Spatial extent of molecular line emission is typically of order ∼ 1000 AU, with a few sources with extended emission up to∼10,000 AU in the CO outflow di-rection. The [Oi] emission is often extended on the same spatial scales along the outflow direction.
3. Rotational diagrams of CO show uniformly two components in low-mass proto-stars, corresponding to temperatures of∼320 K and∼690 K (Chapters 2, 5). The
∼300 K component is detected in protostars with a broad range of luminosities, from∼1 to 106L⊙(Chapter 3). Despite the similarities in the CO ladders, the con-tribution from the envelope to the far-IR CO emission increases 10 times from low-to high-mass prolow-tostars (Chapter 3).
4. Evolutionary stage affects the ratio of molecular and atomic cooling more than the mass of a protostar. In contrast, LFIRL/Lbol decreases only by a factor of 4 from Class 0 to Class I and more than 20 times from low- to high-mass star forming regions (Chapters 2, 3).
5. Shocks are the main source of hot (T &300 K) and dense (n ∼106 cm−3) gas in low-mass protostars (Chapters 2, 4, 5). Non-dissociative C−shocks produce most of the observed molecular emission, but dissociative shocks are needed to explain the [Oi] and OH lines as well as the highly-excited CO and H2O lines (Chapters 4, 5).
6. UV irradiation of shocks needs to be implemented in the next-generation of shock models (Chapters 4, 5). The UV fields are of order 10-100 times the average inter-stellar radiation field (Chapter 5).
Feedback processes from low- and high-mass star forming regions are therefore suc-cessfully identified in the far-IR spectra from Herschel/PACS emission. Characteristics of shocks and UV radiation presented here provide additional means to test the origin of protostellar outflows and the launching mechanisms of jets, as well as the scales on which feedback processes occur. Determination of relative jet and UV contributions to the [Oi] emission as the protostar evolves is becoming possible with the German REceiver for Astronomy at Terahertz Frequencies (GREAT) instrument on board the Stratospheric Ob-servatory for Infrared Astronomy (SOFIA) which offers [Oi] spectroscopy with spectral resolution.1 km s−1.
A complementary view of the feedback processes in the young stellar objects is being provided by sub-millimeter observations with the Atacama Large Millimeter/submillimeter Array (ALMA). Spatially resolved down to∼100 AU scales emission from13CO J
1.5 This thesis
transitions will fully explore the importance of ultraviolet heating, while, for example, SiO observations will continue to constrain the shock characteristics originating in the outflow-envelope interactions.
High spatial resolution (0.4-0.8”) spectral maps from the Mid-Infrared Instrument (MIRI) on the James Webb Space Telescope (to be launched in late 2018) will eventually allow us to study hot gas around protostars using the unique mid-IR diagnostics (5-28 µm) on spatial scales similar to ALMA.
2
Water in star forming regions with
Herschel (WISH) III. Far-infrared
cooling lines in low-mass young
stellar objects
A. Karska, G. J. Herczeg, E. F. van Dishoeck, S. F. Wampfler, L. E. Kristensen, J. R. Goicoechea, R. Visser, B. Nisini, I. San José-García, S. Bruderer, P. ´Sniady, S. Doty, D. Fedele, U. A. Yıldız, A. O. Benz, E. Bergin, P. Caselli, F. Herpin, M. R. Hogerheijde, D. Johnstone, J. K. Jørgensen, R. Liseau, M. Tafalla, F. van der Tak, and F. Wyrowski
Abstract
Context. Understanding the physical phenomena involved in the earlierst stages of protostellar evo-lution requires knowledge of the heating and cooling processes that occur in the surroundings of a young stellar object. Spatially resolved information from its constituent gas and dust provides the necessary constraints to distinguish between different theories of accretion energy dissipation into the envelope.
Aims. Our aims are to quantify the far-infrared line emission from low-mass protostars and the contribution of different atomic and molecular species to the gas cooling budget, to determine the spatial extent of the emission, and to investigate the underlying excitation conditions. Analysis of the line cooling will help us characterize the evolution of the relevant physical processes as the protostar ages.
Methods. Far-infrared Herschel-PACS spectra of 18 low-mass protostars of various luminosities and evolutionary stages are studied in the context of the WISH key program. For most targets, the spectra include many wavelength intervals selected to cover specific CO, H2O, OH, and atomic
lines. For four targets the spectra span the entire 55-200µm region. The PACS field-of-view covers
∼47′′with the resolution of 9.4′′.
Results. Most of the protostars in our sample show strong atomic and molecular far-infrared emis-sion. Water is detected in 17 out of 18 objects (except TMC1A), including 5 Class I sources. The high-excitation H2O 818–70763.3µm line (Eu/kB=1071 K) is detected in 7 sources. CO transitions
from J=14−13 up to J=49−48 are found and show two distinct temperature components on Boltzmann diagrams with rotational temperatures of∼350 K and∼700 K. H2O has typical
excita-tion temperatures of∼150 K. Emission from both Class 0 and I sources is usually spatially extended along the outflow direction but with a pattern that depends on the species and the transition. In the extended sources, emission is stronger offsource and extended on 10,000 AU scales; in the compact sample, more than half of the flux originates within 1000 AU of the protostar. The H2O line fluxes
correlate strongly with those of the high−J CO lines, both for the full array and for the central position, as well as with the bolometric luminosity and envelope mass. They correlate less strongly with OH fluxes and not with [Oi] fluxes. In contrast, [Oi] and OH often peak together at the central position.
Conclusions. The PACS data probe at least two physical components. The H2O and CO emission
very likely arises in non-dissociative (irradiated) shocks along the outflow walls with a range of pre-shock densities. Some OH is also associated with this component, most likely resulting from H2O
2.1 Introduction
2.1
Introduction
Stars form in collapsing dense molecular cores deep inside interstellar clouds (see reviews by di Francesco et al. 2007, Bergin & Tafalla 2007, Lada 1999). Star formation is associ-ated with many physical phenomena that occur simultaneously: infall from the envelope, action of jets and winds resulting in shocks, outflows sweeping up surrounding material, and UV heating of outflow cavity walls (Shu et al. 1987, Spaans et al. 1995, Bachiller & Tafalla 1999). In the earliest phases of star formation (Class 0 and I objects; André et al. 1993, 2000), the interaction between the jet, wind, and the dense envelope is particularly strong and produces spectacular outflows (Arce et al. 2007).
Atomic and molecular tracers are needed to probe the physical conditions and to eval-uate and disentangle the energetic processes that occur in the Class 0/I young stellar ob-jects. Low−J (J 6, Eu/kB 116 K) rotational transitions of carbon monoxide (CO) are among the most widely used tracers (Bontemps et al. 1996), but are only sensitive to the cold gas, T 100 K, from both the envelope and the entrained outflow material. Neverthe-less, spectrally resolved profiles of CO and13CO 6–5 allowed van Kempen et al. (2009a) and Yıldız et al. (2012) to attribute the narrow emission lines to the heating of the cav-ity walls by UV photons (see also Spaans et al. 1995). High-denscav-ity tracers such as SiO (nH2 105cm−3) have been used to study fast J-type shocks produced at bow shocks where the jet plunges into the cloud (Bachiller et al. 2001). At the same time, theoretical studies of line cooling from dense cores predict that most of the released energy is produced in between these two extreme physical regimes and emitted mainly in atomic [Oi], high−J CO and H2O rotational transitions in the far-infrared spectral region in addition to H2 mid-infrared emission (Goldsmith & Langer 1978, Takahashi et al. 1983, Neufeld & Kaufman 1993, Ceccarelli et al. 1996, Doty & Neufeld 1997). Therefore, to study the energetics of young stellar objects (YSOs) and, in particular, the relative importance of different ener-getic processes as a function of the evolutionary state of a YSO, line observations in the
∼50−200µm spectral region are necessary.
The Long-Wavelength Spectrometer onboard the Infrared Space Observatory has for the first time offered spectral access to the complete far-IR window (Kessler et al. 1996, Clegg et al. 1996). Many CO rotational transitions from J = 14−13 to J = 29−28 (for NGC1333-IRAS4) and several H2O lines up to Eu/kB ∼ 500 K have been detected in Class 0 sources (Giannini et al. 2001, Maret et al. 2002). On the other hand, H2O remained undetected in Class I sources, the exception being the outflow position of HH46. CO emission was generally found to be weaker than H2O, whereas the fine structure lines of [Oi] and [Cii] dominates the ISO spectra (Nisini et al. 2002b). The gas cooling budget calculations show similar contributions from lines of CO, H2O, [Oi], and OH in Class 0 sources to a smaller extent. Moreover, an evolutionary trend toward a gradual decrease in molecular luminosity and total line luminosity was established as the objects evolve from the Class 0 to Class I phases. This trend was interpreted as the result of weaker shocks and less shielded UV radiation in the later phase of protostellar evolution (Nisini et al. 2002b).
board the Herschel Space Observatory (Pilbratt et al. 2010a)1with 25 9′′.4×9′′.4 spatial pixels provides an 8×improvement in spatial resolution as compared to ISO/LWS. The PACS field of view of∼47′′is smaller than the 80′′ISO beam, but in many cases it still covers the full extent of the emission from nearby YSOs. For a typical distance of 200 pc to our objects (Table 4.1), regions of∼9400 AU are observed and resolved down to
∼1880 AU. The higher sensitivity and better spectral resolution provides an important improvement in the quality of the spectra. PACS is thus well suited for studies of atomic and molecular emission in the Class 0/I objects, as demonstrated by PACS results on in-dividual Class 0/I sources and their outflows (van Kempen et al. 2010b,a, Nisini et al. 2010a, Herczeg et al. 2012, Benedettini et al. 2012, Goicoechea et al. 2012). These re-sults have already indicated relative differences in the gas cooling budget from different sources and differences in spatial distributions of emission between different molecules. Visser et al. (2012) have modeled these early data with a combination of shocks and UV heating along the cavity wall. The strong [Oi] and OH emission also suggests there are dissociative shocks in the close vicinity of the protostar (van Kempen et al. 2010b).
In our paper, we address the following questions. How does a YSO affect its sur-rounding cloud and on what spatial scales? What are the dominant gas cooling chan-nels for deeply embedded YSOs? What do they tell us about the physical components and conditions that cause excitation of the observed lines? How do all of these pro-cesses change during the evolution from the Class 0 to the Class I stage? To this end, we present Herschel-PACS spectroscopy of 18 Class 0/I YSOs targeting a number of CO, H2O, OH, and [Oi] lines obtained as part of the ‘Water in star forming regions with Herschel’ (WISH) key program (van Dishoeck et al. 2011). WISH observes about 80 pro-tostars at different evolutionary stages (from prestellar cores to circumstellar disks) and masses (low-, intermediate-, and high-mass) with both the Heterodyne Instrument for the Far-Infrared (HIFI; de Graauw et al. 2010) and PACS. Our paper only focuses on low-mass YSOs and is closely associated to other WISH papers. Specifically, Kristensen et al. (2012) studies the spectrally resolved 557 GHz H2O line observed towards all our objects with HIFI. Wampfler et al. (2013) analyzes the same sample of sources but focuses on the excitation of OH in the Class 0/I sources, whereas full PACS spectral scans of two sources are published by Herczeg et al. (2012; NGC1333-IRAS4B) and Goicoechea et al. (2012; Ser SMM1). A synthesis paper discussing the HIFI, PACS, and SPIRE data being obtained in WISH and other programs is planned at the final stage of the program.
The paper is organized as follows. Section 2 introduces the source sample and explains the observations and reduction methods; §3 presents results that are derived directly from the observations; §4 focuses on the analysis of the data; §5 provides the discussion of the results in the context of the available models, and §6 summarizes the conclusions.
1Herschel is an ESA space observatory with science instruments provided by European-led Principal
2.2 Observations
2.2
Observations
2.2.1
Sample selection
We used PACS to observe 18 out of 29 Class 0/I objects selected in the low-mass part of the WISH key program. The WISH source list consists of nearby (D<∼450 pc), well-known young stellar objects for which ample ground-based single dish and interferometer observations are available (for details concerning the WISH program see van Dishoeck et al. 2011). The remaining 11 sources, that were not targeted with PACS within WISH were observed in the ‘Dust, Gas and Ice in Time’ key program (DIGIT, PI: N. Evans; Green et al. 2013, Dionatos et al. subm., Jørgensen et al., in prep., Lee et al., in prep.).
Table 4.1 presents our sample of objects together with their basic properties. Bolomet-ric luminosities and temperatures were derived using our new PACS data supplemented with observations found in the literature (see §2.4 for spectral energy distribution discus-sion). Envelope masses are from Kristensen et al. (2012), which includes a discussion of the impact of new PACS measurements on the derived physical parameters.
2.2.2
Observing strategy
The far-IR spectra were obtained with PACS, an integral field unit with a 5×5 array of spatial pixels (hereafter spaxels). Each spaxel covers 9′′.4×9′′.4, providing a total field of view of∼47′′×47′′. The full wavelength coverage consisted of three grating orders (1st: 102-210µm; 2nd: 71-105µm; or 3rd: 51-73µm), two of which were always ob-served simultanously (one in the blue,λ <105µm, and one in the red,λ >102µm, parts of the spectrum). The velocity resolution ranges from∼75 to 300 km s−1, depending on the grating order and the wavelength. The highest spectral resolution is obtained at the shortest wavelengths, below 65µm. Two nod positions were used for chopping 3′on each side of the source. Typical pointing accuracy is better than 2′′.
Two observing schemes were used in our program: line spectroscopy mode to cover short spectral regions and range spectroscopy mode to cover the full far-IR SED. Line spectroscopy mode uses small grating steps to provide deep integrations and to fully sam-ple the spectral resolution over short (0.5-2µm) wavelength intervals. This mode was used to observe selected lines for 16 of 18 objects from our sample (Ser SMM1 and NGC1333-IRAS2A are the exceptions). We targeted 12 H2O lines (Eu/kB∼100−1320 K), 12 CO lines (Eu/kB∼580−3700 K), and 4 OH doublets (Eu/kB∼120−291 K), as well as the [Oi] and [Cii] lines (full list of available lines is included in Table 2.A.1). BHR71 and Ser SMM4 were only observed in a limited number of scans within the WISH program; range spectroscopy observations of those sources are analyzed in DIGIT (Jørgensen et al. in prep. and Dionatos et al. subm., respectively).
Table 2.1 – Catalog information and source properties.
Nr Object D Lbol Tbol Menva
(pc) (L⊙) (K) (M⊙)
1 NGC1333-IRAS2A 235 35.7 50 5.1
2 NGC1333-IRAS4A 235 9.1 33 5.6
3 NGC1333-IRAS4B 235 4.4 28 3.0
4 L1527 140 1.9 44 0.9
5 Ced110-IRS4 125 0.8 56 0.2
6 BHR71 200 14.8 44 2.7
7 IRAS15398b 130 1.6 52 0.5
8 L483 200 10.2 49 4.4
9 Ser SMM1 230 30.4 39 16.1
10 Ser SMM4 230 1.9 26 2.1
11 Ser SMM3 230 5.1 38 3.2
12 L723 300 3.6 39 1.3
13 L1489 140 3.8 200 0.2
14 TMR1 140 3.8 133 0.2
15 TMC1A 140 2.7 118 0.2
16 TMC1 140 0.9 101 0.2
17 HH46 450 27.9 104 4.4
18 RNO91 125 2.6 340 0.5
Notes. Sources above the horizontal line are Class 0, sources below are Class I. Source coordinates and references are listed in van Dishoeck et al. (2011). Positional angles of CO 6-5 outflows will be presented in Yıldız et al. (in prep.).
(a)Envelope mass at 10 K from Kristensen et al. (2012). (b)The difference between the pointing
2
.2
O
b
se
rv
at
io
Figure 2.1 – Line survey of Class 0 sources at the on-source position. Spectra are extracted from the central spaxel only for the well-pointed
F
ig
u
re
2
.2
–
S
am
e
as
F
ig
u
re
2
.1
b
u
t
fo
r
C
la
ss
I
so
u
rc
es


![Figure 2.6 – Velocity shifts and high-velocity line wings in the [O i] line at 63.2 µm for NGC1333- NGC1333-IRAS4A, L1527, Ser SMM1, SMM4, TMC1A, and HH46](https://thumb-us.123doks.com/thumbv2/123dok_us/8215235.2178025/54.892.187.604.144.483/figure-velocity-shifts-velocity-wings-iras-smm-tmc.webp)