PREDICTORS OF WATER QUALITY IN RURAL HEALTHCARE FACILITIES IN 14 LOW- AND MIDDLE-INCOME COUNTRIES
Amy Zhang Guo
A thesis submitted to the faculty at the University of North Carolina at Chapel Hill in partial fulfillment of the requirements for the degree of Master of Science in the Department of Environmental Sciences and Engineering in the Gillings School of Global Public Health.
Chapel Hill 2018 Approved by: Jamie Bartram Jill Stewart Jackie MacDonald-Gibson
ii
© 2018 Amy Zhang Guo ALL RIGHTS RESERVED
iii ABSTRACT
Amy Zhang Guo: Predictors of Water Quality in Rural Healthcare Facilities in 14 Low- and Middle-Income Countries
(Under the direction of Jamie Bartram)
Many healthcare facilities (HCFs) in rural areas of low- and middle-income countries (LMICs) lack safe, sufficient water supplies. We sought to understand which factors affect water quality in rural HCF in LMICs. In Ethiopia, Kenya, Rwanda, Uganda, Tanzania, Malawi,
Mozambique, Zambia, Zimbabwe, Ghana, Mali, Niger, India, and Honduras, doctors and nurses were interviewed at 2,035 HCFs about their water source, staff training, and management practices. Water samples were also tested for E. coli contamination. We generated descriptive analyses and logistic regressions. Use of an improved water source (OR≈1.4), treatment of water (OR=1.26), management by a person with medical training (OR≈3.7), and presence of a protocol for operations and management (OR=1.29) were associated with safer water. These results suggest that in addition to addressing water source, storage, and treatment, stakeholders can also target organizational factors in order to improve water quality in HCFs.
iv
ACKNOWLEDGEMENTS
This research would not have been possible without the support of many people. I would like to thank my advisors and committee members, Jamie Bartram, Jill Stewart, and Jackie MacDonald-Gibson for their patient guidance and helpful comments on this work. I would also like to thank all my colleagues at the Water Institute for making this research possible, especially Ryan Cronk, who helped me troubleshoot problems during analysis and gave helpful feedback on my writing. I would also like to thank Cathy Zimmer, at the Howard W. Odum Institute, for her advice and guidance during the statistical data analysis.
This project was funded by World Vision (Federal Way, WA) and would not have been possible without the hard work of World Vision staff in each country, as well as the consulting firms and enumerators who carried out the field work. Many thanks to all involved, including the doctors and nurses who contributed their precious time to this study.
Finally, I am extremely grateful to my friends and family for their continuous love, encouragement, and support. The tasty food, the sweet texts, and the cute dog photos brought me lots of joy. Thank you from the bottom of my heart.
v
TABLE OF CONTENTS
LIST OF TABLES ... vii
LIST OF FIGURES ... viii
CHAPTER 1: INTRODUCTION ... 1
CHAPTER 2: LITERATURE REVIEW ... 4
CHAPTER 3: METHODS ... 7
3.1 Study population and design ... 7
3.2 Survey instrument ... 8
3.3 Training and piloting ... 9
3.4 Data collection ... 10
3.5 Water quality sampling and testing ... 10
3.6 Quality assurance and control ... 11
3.7 Data entry, processing, and analysis ... 11
3.8 Ethical approval ... 14 CHAPTER 4: RESULTS ... 15 4.1 Descriptive analyses ... 16 4.2 Logistic regressions ... 21 CHAPTER 5: DISCUSSION ... 24 5.1 Descriptive analysis ... 24
vi
5.2 Influence of water source ... 25
5.3 Influence of treatment ... 25
5.4 Influence of storage ... 26
5.5 Influence of management and training ... 26
5.6 Comparisons to existing literature ... 27
5.7 Limitations ... 28
5.8 Takeaways... 29
CHAPTER 6: CONCLUSIONS ... 30
APPENDIX: FULL HEALTHCARE FACILITY QUESTIONNAIRE ... 32
vii
LIST OF TABLES
Table 1. Variables selected for testing in logistic regressions. ... 12 Table 2. Sample sizes in each country. ... 15 Table 3. Characteristics of surveyed healthcare facilities and medical
training of facility managers in each country. ... 17 Table 4. Proportion of healthcare facilities with an improved main water
source and safe storage and treatment practices. ... 18 Table 5. Proportion of healthcare facilities where IPC and WaSH-related
training or management programs were reported. ... 20 Table 6. Proportion of healthcare facilities where water was in conformity
with drinking-water quality guidelines (as defined by WHO) at the
time of survey, by country ... 21 Table 7. Factors associated with conformity with drinking-water quality
guidelines (as defined by WHO in univariable logistic models,
by country. ... 21 Table 8. Factors associated with statistically significant changes in
water quality risk level (as defined by WHO), across all 14 aggregated
viii
LIST OF FIGURES
CHAPTER 1: INTRODUCTION
Safe and sufficient water services are vital for protecting and maintaining health. Consumption of contaminated water or having insufficient water for personal hygiene is linked to diseases such as cholera, typhoid fever, helminth infections, and trachoma (Prüss-Ustün et al., 2014). In 2015, the need for basic water services was recognized in Goal 6 of the United
Nations’ Sustainable Development Goals (SDGs), where target 6.1 calls for universal access to “safe and affordable drinking-water for all” and target 6.3 calls for improvements in water quality by 2030 (UN, 2017). However, achieving and maintaining adequate water service can be difficult in low- and middle-income countries (LMICs), even more so in rural areas of LMICs (R. E. S. Bain, Wright, Christenson, & Bartram, 2014).
The WHO/UNICEF Joint Monitoring Programme has also specified that “universal access” to drinking-water includes settings such as schools, workplaces, and healthcare facilities (HCFs) (UN Special Rapporteur on the Human Right to Safe Drinking Water and Sanitation, 2012). Adequate quantities of safe water are particularly important within HCFs in order to maintain a clean environment and prevent the spread of healthcare-associated infections such as urinary tract, surgical-site, lower respiratory tract, and bloodstream infections (Adams et al., 2008; Mathai, Allegranzi, Kilpatrick, & Pittet, 2010). In HCFs, water is used for not only drinking by patients and staff, but also for hand hygiene, bathing patients, washing linens, sterilizing medical equipment, and cleaning surfaces in the facility (Adams et al., 2008). When an HCF’s water supply is of insufficient quantity or unsafe quality, its ability to provide safe
2
medical services is compromised. In a study of healthcare workers in ten rural Indonesian clinics, observed hand hygiene compliance was only 20%, in part due to water scarcity: one worker commented, “We don’t even have water to drink or cook; how could you expect us to bathe regularly, let alone wash our hands?” (Marjadi & McLaws, 2010). An inadequate water supply can also lead to negative perceptions of the HCF by patients (Bhattacharyya, Issac, Rajbangshi, Srivastava, & Avan, 2015; Karkee, Lee, & Pokharel, 2014; Steinmann et al., 2015), as well as decreased morale and motivation of healthcare workers at the facility (Alhassan et al., 2013; Melberg, Diallo, Tylleskär, & Moland, 2016).
An assessment of monitoring data on water supplies in HCFs from 78 LMICs estimated that 50% of HCFs do not have a piped water source on-premises (Cronk & Bartram, 2018). Data on microbial water quality in LMIC HCFs are sparse: most published studies are limited to 20 or 30 water samples in ten or fewer facilities. However, one cross-sectional study found that 15.3% of water samples from HCFs in rural Uganda (n=144) and 29.6% of water samples from rural Mozambique (n=172) were contaminated with E. coli (Guo, Bowling, Bartram, & Kayser, 2017). No known studies model the relationships between water quality in rural HCF in LMIC and other factors such as HCF management characteristics, characteristics of water source, water storage and treatment practices. Such studies would be useful in identifying interventions and management solutions to improve the situation. The relationships between environmental outcomes (such as water quality) and explanatory factors are complex, non-linear, and require analytical approaches that can capture these complexities. We conducted surveys and water quality sampling at HCFs which provided outpatient care only within 14 LMICs (Ethiopia, Kenya, Rwanda, Uganda, Tanzania, Ghana, Mali, Niger, Malawi, Mozambique, Zambia,
3
Zimbabwe, India, Honduras). Through descriptive statistics and logistic regressions, we sought to understand the following:
1. What is the current status of water service and water quality within rural HCFs in LMIC? 2. What factors (general HCF characteristics, training, water source characteristics, etc.)
have the greatest impact on water quality within rural HCFs in LMIC?
4
CHAPTER 2: LITERATURE REVIEW
Factors that impact water quality have been studied for other settings. A review of key predictors of water quality has been compiled here.
Location and time. Water quality is related to geographical location. This is most obvious with geogenic chemical contaminants of water, such as arsenic and fluoride (WHO, 2017), but location is also an important factor in understanding microbiological water quality. Water sources within several meters or downhill from sources of contamination such as latrines, animals, and fertilizers are at greater risk of contamination. Microbial contamination of water also naturally fluctuates over time due to factors such as rainfall, temperature, exposure to sunlight, etc. which affect the growth and survival of microbes in water. Drinking water sources are more likely to be fecally contaminated during the wet season than in the dry season (Kostyla, Bain, Cronk, & Bartram, 2015).
Source characteristics. The WHO/UNICEF Joint Monitoring Program categorizes water sources as “improved” or “unimproved” based on their construction (JMP, 2017). Improved sources of water – piped water into a dwelling, piped water into the yard, public taps, boreholes, protected dug wells, protected springs, rainwater collection, and bottled water – are less likely to be fecally contaminated than unimproved sources. However, improved status is not a guarantee of safety; water from improved sources can be contaminated with fecal bacteria, and protected dug wells are frequently contaminated (R. Bain et al., 2014). Intermittent water supplies are also
5
more likely to be fecally contaminated, with 31.7% of samples from an intermittent tap supply testing positive for E. coli as opposed to 0.7% of samples from a continuous tap supply in one study (Kumpel & Nelson, 2013). Damaged parts at the water source can also introduce
contamination: this might correspond to items on the WHO sanitary inspection for water points, such as a cracked drainage channel, loose handpump, or broken platform. As with source type, a “low risk” score on the sanitary inspection corresponds with greater likelihood of safe water, but does not guarantee safety (Luby et al., 2008; Oliver, 2015).
Storage and treatment. While distance to source is usually discussed because of its implications for water quantity, shorter distances to water source have been linked to better water quality in Ethiopia (K. Shields et al., 2015). Without treatment, water tends to become more contaminated from source to point-of-use; this deterioration tends to be worse in households where water containers are not covered, and the water inside can be directly touched by hands (Wright, Gundry, & Conroy, 2004). Fecal contamination can be mitigated by treatment using methods such as chlorination and filtration, but each method for treating water will have differential effectiveness against different types of microorganisms (for example protozoa and viruses) (WHO, 2017).
Sanitation and waste management. Sanitation facilities in disrepair (for example, leaking, flooding, or cracked) can contaminate both surface water and groundwater, though the extent of contamination is dependent on soil type and water table level in the area (Escamilla, Knappett, Yunus, Streatfield, & Emch, 2013; Graham, 2014). Groundwater is more likely to be contaminated by latrines in rocky soils and areas with shallow water tables. Sanitation facilities are also more likely to contaminate water when uphill or a short distance from water source: while a lateral separation of 15 m is “traditionally” recommended, a systematic review found that
6
bacteria from pit latrines can travel over 20 m in some soils, and that viruses can travel up to 50 m from the latrine, contaminating groundwater (Graham, 2014).
Management and finance. The presence of a water or WaSH committee responsible for management of a water point is associated with increased functionality (Fechter, 2017). Specific management actions by management committees, such as collection of a tariff, are also
associated with increased source functionality (Fisher et al., 2015).
In this study, we set out to describe the status of these factors – location, source
characteristics, water storage and treatment, sanitation, and management and finance – as well as determine the influence of these factors on microbial water quality in healthcare facilities within rural areas of low- and middle-income countries. This was done using the data from a large multi-country study, which is described in more detail in Chapter 3 (Methods) below.
7
CHAPTER 3: METHODS 3.1 Study population and design
This study examined healthcare facilities (HCFs) in rural areas of 14 countries: Ethiopia, Kenya, Rwanda, Uganda, Tanzania, Ghana, Mali, Niger, Zambia, Malawi, Mozambique,
Zimbabwe, India, and Honduras. This study was part of a larger evaluation of WaSH in World Vision (an international NGO) programming areas and comparison areas. This larger evaluation also examined WaSH in households, communities, and schools. The HCF sample frame was nested within the household survey design, which was a cluster-randomized design to reduce study costs and simplify travel logistics for data collectors. In the household design, rural enumeration areas were identified across each country and classified as areas where World Vision has active WaSH programs or areas where World Vision does not work; within each stratum, 56 primary sampling units were identified where households would be mapped and surveyed.
After the geographic areas for household surveys were selected, a full list of healthcare facilities was compiled (usually from a master health facility list from each country) within the administrative districts in which the household clusters were identified. Facilities where inpatient care was provided (such as hospitals) were excluded from this list, as the water needs for HCF providing inpatient care and HCF providing outpatient care are likely to be different. Simple random samples were taken from this list, so that in each country, 100 HCFs were selected for surveys in World Vision programming areas and 100 HCFs were selected from comparison areas
8
where World Vision did not have programming. In some countries where there were not enough HCFs in the selected districts to meet this goal sample size, HCFs were included from nearby areas (for example, in Ghana, HCFs within a 10-km buffer of the selected districts were included in the sample frame). The locations of surveyed healthcare facilities are displayed in Figure 1.
Figure 1. GPS location of healthcare facilities visited in each country. This map shows the
distribution of surveyed HCF in 13 countries. Results from this study are generalizable to the indicated subnational districts within each country. GPS data were not collected in India by requirement of local IRB.
3.2 Survey instrument
The survey instrument for this study was adapted from a baseline evaluation of WaSH for World Vision (Kayser et al. 2015), and included questions on healthcare facility characteristics; water (source type, distance to source, availability, water storage, treatment), sanitation (type,
9
functionality, condition, and use); hygiene (hand hygiene, sharps and infectious waste segregation and treatment and disposal); and administration and training (policies, budget, trainings on WaSH and infection prevention and control). These surveys were translated into local languages for each country and verified by research consultants or World Vision staff in each country.
Some of the questions from the survey were asked to the interviewee, while others were observed and recorded by the enumerator. Survey responses were recorded using the mobile survey tool mWater (New York, NY, USA).
3.3 Training and piloting
Research consulting firms were hired to conduct the surveys in each country. While the hiring process for enumerators was slightly different in each country, most firms sought
enumerators with the equivalent of a high-school education, with preference given to women and to candidates with past surveying experience, knowledge of WaSH, and/or expertise using mobile phones.
Staff from the Water Institute at the University of North Carolina at Chapel Hill conducted five regional training workshops (East Africa, Southern Africa, West Africa, Honduras, and India) in-person in order to familiarize consultants and enumerators with the survey, surveying techniques, use of the mWater mobile platform, protocol for taking water samples, and quality checks for data. One additional training workshop was conducted via Skype for the consultant team in Honduras. Consultants in each country also held a ‘refresher’ training workshop for their enumerators just before data collection commenced.
After each regional training workshop, Water Institute staff remained with World Vision staff, consultants, and enumerators for a three-day piloting period. During this, enumerators
10
visited several villages and practiced all procedures for entering communities and completing surveys, such as mapping of healthcare facilities and water points in each area, process for taking and reading water quality results, practice filling out and submitting surveys using the mWater platform, and discussion of the verification and quality assurance and quality control processes that should be performed on enumerators’ surveys.
3.4 Data collection
Data were collected over two to three months in each country, with the earliest country finishing data collection in July 2017 and the last country finishing data collection in December 2017. During the data collection period, teams of enumerators went to each selected facility and attempted to interview the head doctor. If the head doctor was unavailable, they attempted to interview the head nurse. If the head nurse was unavailable, a nurse who had worked at the health center for more than two years was interviewed. The respondent was allowed to decline to respond to any question, and to stop the survey at any time (see Section 3.8, Ethical approval). 3.5 Water quality sampling and testing
In all visited HCFs, interviewees were asked if they could serve water in the manner someone would usually take it for drinking. A 100-mL sample of that water was taken for a Compartment Bag Test (CBT) (Aquagenx, Chapel Hill, NC, USA), a low-cost field test for fecal contamination using Escherichia coli as indicator organism. Guidelines for taking a water sample without contamination were followed (Madsen and Guo 2014). Blank samples were collected at 10% of HCFs and duplicate water samples were collected at another 10% of HCFs as a check on the quality of data collected on water contamination.
To test for E. coli, water samples were processed immediately after each survey: these were incubated in a CBT for 48 hours at ambient temperature between 25 and 30 degrees
11
Celsius, 24 hours at ambient temperature above 30 degrees Celsius. In cases where the ambient temperature was not between 25 and 30 degrees Celsius, water samples were stored in a cooler with ice until the end of the day in the field, then were placed in a 35 to 37 degree incubator for 24 hours. These samples were then categorized by risk level based on E. coli per 100 mL sample, either “safe” (<1 MPN E. coli per 100 mL) or “unsafe” (1 or more MPN per 100 mL).
3.6 Quality assurance and control
Quality checks were in place for multiple stages of data collection. These were built-in checks from the mWater platform to prevent skipped questions (so that enumerators could not continue with the survey without answering questions or indicating that the respondent did not want to answer a question) and a list of checks for supervisors to complete each week while reviewing new data (common-sense checks on number of surveys completed, duration of surveys, number of water samples collected, location of GPS points in country, verification of certain responses based on photos).
During data collection, consultants and their enumerator teams had access to manuals for enumerators and supervisors; enumerators were also able to ask for support or clarification from their supervisors or other enumerators via text message or WhatsApp. The research team at UNC also provided support via Skype, email, and WhatsApp.
At the conclusion of the data collection period for each country, data were reviewed and consultants were called via Skype to clarify any remaining items (for example, explanation for why sample sizes were lower than expected).
3.7 Data entry, processing, and analysis
Datasets were exported from mWater into Stata/SE 14.2 (College Station, TX, USA) for cleaning and analysis. Analysis was done in Stata using tab, proportion, tabstat, pwcorr, logistic,
12
and melogit commands. This included individual logistic regression models within each country, as well as a mixed effects logistic regression model using the aggregated data from all 14
countries.
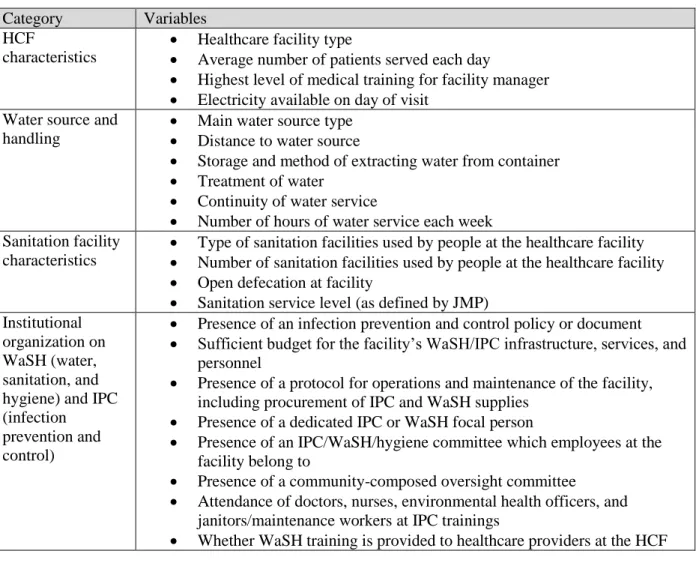
Variables from the survey were selected a priori for testing based on evidence of factors that influence water quality or plausible relationship (Table 1).
Table 1. Variables selected for testing in logistic regressions. Category Variables
HCF
characteristics
Healthcare facility type
Average number of patients served each day
Highest level of medical training for facility manager Electricity available on day of visit
Water source and handling
Main water source type Distance to water source
Storage and method of extracting water from container Treatment of water
Continuity of water service
Number of hours of water service each week Sanitation facility
characteristics
Type of sanitation facilities used by people at the healthcare facility Number of sanitation facilities used by people at the healthcare facility Open defecation at facility
Sanitation service level (as defined by JMP) Institutional
organization on WaSH (water, sanitation, and hygiene) and IPC (infection
prevention and control)
Presence of an infection prevention and control policy or document Sufficient budget for the facility’s WaSH/IPC infrastructure, services, and
personnel
Presence of a protocol for operations and maintenance of the facility, including procurement of IPC and WaSH supplies
Presence of a dedicated IPC or WaSH focal person
Presence of an IPC/WaSH/hygiene committee which employees at the facility belong to
Presence of a community-composed oversight committee
Attendance of doctors, nurses, environmental health officers, and janitors/maintenance workers at IPC trainings
Whether WaSH training is provided to healthcare providers at the HCF
Categorical responses were cleaned so that responses of “don’t know,” “decline to state,” “not applicable,” etc. were counted as missing data. Some responses were categorized (for example, main water source into improved and unimproved based on guidance from the JMP (JMP, 2016); method for extracting water from a storage container sorted into safe if by pouring,
13
dispensed from a tap or spigot, or scooped with a ladle, or unsafe scooping with hands or a cup). New variables were also coded based on composites of other responses – for example, water service levels were calculated based on main water source, availability of water at time of survey, and distance to water source, where HCFs with an improved water source on-premises with water available during the survey used a basic water service, HCFs with an improved source of water off-premises or not available during the survey used a limited water service, and HCFs with an unimproved or no source of water had no water service (JMP, 2016). Water quality was recoded as a binary outcome based on the MPN of E. coli reported (<1 MPN per 100 mL = “safe,” 1 or more MPN per 100 mL = “unsafe”). For continuous variables, out-of-range values were also removed (for example, one response in Niger stated that the HCF served an average of 96,239,883 patients each day).
Univariable logistic regressions were performed to identify predictors of water quality within each country. All variables selected for testing were run as univariate logistic models; we identified variables that had a statistically significant Wald chi-squared value (associated p < 0.05) and report these.
For the multivariable mixed-effects logistic model, we clustered results based on country and again ran univariate mixed-effects logistic models in order to identify variables with
statistically significant relationships with the outcome variable (safe water). All variables
identified as significantly associated with the outcome were included in the multivariable model. These variables were also tested for collinearity using Pearson’s correlation coefficient and the variance inflation factor.
14
3.8 Ethical approval
This study was approved by the UNC-Chapel Hill Institutional Review Board (IRB #17-0663). Free and informed consent was obtained from all participants in their own language before beginning the survey.
Ethical approval was also obtained by agencies within each of the countries. These were the National Regional Government of Oromia Planning and Economic Development
Commission in Ethiopia, the Ministry of Water and Irrigation in Kenya, the Ministry of Infrastructure in Rwanda, the Makarere University School of Biomedical Sciences ethics committee in Uganda, the National Institute for Medical Research in Tanzania, the Ministry of Water Resources in Ghana, the University of Bamako Medical School in Mali, the Ministry of Water Resources in Niger, the Director of Irrigation and Water Development in Malawi, the National Institute of Statistics in Mozambique, the Ministry of Local Government and Housing in Zambia, the Medical Research Council in Zimbabwe, the SRM University School of Public Health in India, and the Secretary of Energy and Natural Resources in Honduras.
15
CHAPTER 4: RESULTS
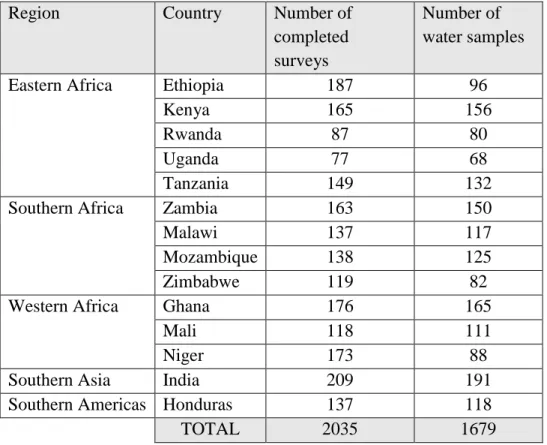
A total of 2,035 healthcare facilities (HCFs) were successfully contacted for surveys, with a sample size target of 2,800 (200 surveys per country). Water samples were taken at all HCFs where water was available on the day of the survey, or 1,679 of the HCFs (Table 2).
Table 2. Sample sizes in each country.
Region Country Number of
completed surveys
Number of water samples
Eastern Africa Ethiopia 187 96
Kenya 165 156
Rwanda 87 80
Uganda 77 68
Tanzania 149 132
Southern Africa Zambia 163 150
Malawi 137 117
Mozambique 138 125
Zimbabwe 119 82
Western Africa Ghana 176 165
Mali 118 111
Niger 173 88
Southern Asia India 209 191
Southern Americas Honduras 137 118
16
4.1 Descriptive analyses
Across all 14 countries, the most commonly surveyed type of HCF was the health center. However, health posts were the most common type of HCF surveyed in Ethiopia and Tanzania; the community/block health center was most common in Rwanda and Mali; the primary health center was most common in Zimbabwe; and the sub-center was most common in India. The most frequently indicated “Other” healthcare facilities were dispensaries (Kenya, Tanzania),
Community Health-Based Planning and Services or CHPS compounds (Ghana), Case de Santé or ‘health huts’ (Niger), and Centros de Salud Rural or ‘rural health centers’ (Honduras).
Across all countries, HCFs were most commonly managed by nurses. The most
frequently indicated “Other” levels of medical training for HCF managers were clinical/medical assistants (Malawi), medical technicians (Mozambique, Mali), physician assistants (Ghana), health officers (Mozambique, Niger), auxiliary nurse midwives or ANMs (India), accredited social health activist or ASHA workers (India), and nursing assistants (Honduras) (Table 3).
17
Table 3. Characteristics of surveyed healthcare facilities and medical training of facility managers in each country.
Eastern Africa Southern Africa West Africa Southern Asia Southern Americas Ethiopia (%) Kenya (%) Rwanda (%) Uganda (%) Tanzania (%) Zambia (%) Malawi (%) Mozambique (%) Zimbabwe (%) Ghana (%) Mali (%) Niger (%) India (%) Honduras (%) Type of HCF Health post Health center Private clinic Sub center Primary health center Community/block health center Other 66 30 1 1 1 <1 0 5 48 3 17 2 6 19 12 0 0 0 1 86 0 1 94 5 0 0 0 0 57 17 1 0 7 9 9 15 75 2 <1 1 7 0 2 87 6 <1 2 <1 1 1 96 0 2 0 0 0 <1 18 5 2 71 3 0 1 34 6 2 6 16 27 0 35 0 0 4 55 6 16 26 23 5 2 15 15 3 18 0 48 27 3 <1 <1 81 <1 <1 2 <1 14
Level of medical training for HCF manager
Doctor Nurse
Community health worker/health extension worker Midwife Other None 1 55 28 0 10 5 10 71 0 0 18 <1 0 98 0 0 2 0 16 53 0 5 26 0 50 36 0 0 14 <1 2 77 6 4 10 0 10 19 0 0 71 <1 10 61 0 0 29 <1 2 93 0 3 2 0 7 61 2 13 17 0 52 24 0 0 25 0 2 59 28 0 11 0 24 50 <1 0 21 5 40 54 0 0 0 6 Median number of patients
served each day
10 50 75 50 30 45 150 80 45 20 16.5 17 11 20
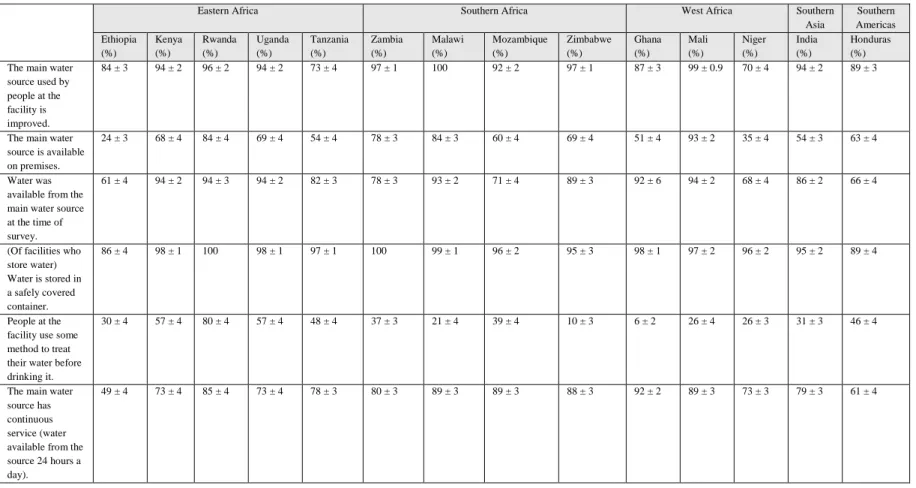
At the 2,035 HCFs surveyed, 86% of interviewees reported that the main water source used by people at the facility was an improved water source, such as a piped connection or a borehole with handpump. At 87% of HCFs, water was available from the main water source at the time of the survey. At 36% of HCFs, interviewees reported that their HCF’s main water source was off-premises. However, in Ethiopia and Niger, the water source was more likely to be off-premises than on-premises. Overall, 52% of the surveyed HCFs used a basic water service, 34% used a limited water service, and 14% had no service as defined by the WHO/UNICEF Joint Monitoring Programme (Table 4).
18
For healthcare facilities where water was stored in a container (n = 1,292), 96% reported that they used a container covered with a lid. Treatment of water was uncommon in some countries (with water treated in 10% of HCFs in Zimbabwe), but was more widespread in others (with water treated in 80% of in HCFs in Rwanda) (Table 4).
Table 4. Proportion of healthcare facilities with an improved main water source and safe storage and treatment practices. (Point
estimates are shown ± standard error.)
Eastern Africa Southern Africa West Africa Southern Asia Southern Americas Ethiopia (%) Kenya (%) Rwanda (%) Uganda (%) Tanzania (%) Zambia (%) Malawi (%) Mozambique (%) Zimbabwe (%) Ghana (%) Mali (%) Niger (%) India (%) Honduras (%) The main water
source used by people at the facility is improved.
84 ± 3 94 ± 2 96 ± 2 94 ± 2 73 ± 4 97 ± 1 100 92 ± 2 97 ± 1 87 ± 3 99 ± 0.9 70 ± 4 94 ± 2 89 ± 3
The main water source is available on premises.
24 ± 3 68 ± 4 84 ± 4 69 ± 4 54 ± 4 78 ± 3 84 ± 3 60 ± 4 69 ± 4 51 ± 4 93 ± 2 35 ± 4 54 ± 3 63 ± 4
Water was available from the main water source at the time of survey.
61 ± 4 94 ± 2 94 ± 3 94 ± 2 82 ± 3 78 ± 3 93 ± 2 71 ± 4 89 ± 3 92 ± 6 94 ± 2 68 ± 4 86 ± 2 66 ± 4
(Of facilities who store water) Water is stored in a safely covered container. 86 ± 4 98 ± 1 100 98 ± 1 97 ± 1 100 99 ± 1 96 ± 2 95 ± 3 98 ± 1 97 ± 2 96 ± 2 95 ± 2 89 ± 4 People at the facility use some method to treat their water before drinking it.
30 ± 4 57 ± 4 80 ± 4 57 ± 4 48 ± 4 37 ± 3 21 ± 4 39 ± 4 10 ± 3 6 ± 2 26 ± 4 26 ± 3 31 ± 3 46 ± 4
The main water source has continuous service (water available from the source 24 hours a day).
49 ± 4 73 ± 4 85 ± 4 73 ± 4 78 ± 3 80 ± 3 89 ± 3 89 ± 3 88 ± 3 92 ± 2 89 ± 3 73 ± 3 79 ± 3 61 ± 4
1
19
Characteristics of management and training programs within HCFs on water, sanitation, and hygiene (WaSH) and infection prevention and control (IPC) varied by country (Table 5).
The existence of an IPC policy in HCFs ranged from 27% in Niger to 96% in Zimbabwe. Similar ranges existed for existence of operation and management protocols, designation of an IPC/WaSH focal person, and existence of WaSH and oversight committees. Community-composed oversight committees (groups of community members who can relay community health concerns and general feedback on quality of care to staff at the HCF) were more common than HCF WaSH committees.
At least half of the facilities in each country had held at least one IPC training in the past year (with the exceptions of healthcare facilities in Malawi and Niger); these had usually been attended by nurses rather than doctors or other workers in the facility.
About a fifth of facilities in most countries had a sufficient budget for IPC/WaSH supplies.
20
Table 5. Proportion of healthcare facilities where IPC and WaSH-related training or management programs were reported. (Point
estimates are shown ± standard error.)
Eastern Africa Southern Africa West Africa Southern Asia Southern Americas Ethiopia (%) Kenya (%) Rwanda (%) Uganda (%) Tanzania (%) Zambia (%) Malawi (%) Mozambique (%) Zimbabwe (%) Ghana (%) Mali (%) Niger (%) India (%) Honduras (%)
Infection prevention and control (IPC) policy exists for the facility.
58 ± 4 73 ± 3 90 ± 3 73 ± 3 92 ± 2 80 ± 3 56 ± 4 53 ± 4 96 ± 2 71 ± 3 52 ± 5 27 ± 3 62 ± 3 86 ± 3
Protocol for operation and management of the facility, including procurement of IPC/WaSH supplies, exists and is followed.
16 ± 3 60 ± 4 85 ± 4 60 ± 4 68 ± 4 56 ± 4 28 ± 4 31 ± 4 73 ± 4 63 ± 4 22 ± 4 11 ± 2 56 ± 3 50 ± 4
IPC/WaSH focal person has been designated for the facility.
31 ± 4 67 ± 4 85 ± 4 67 ± 4 56 ± 4 60 ± 4 70 ± 4 55 ± 4 80 ± 4 50 ± 4 37 ± 4 15 ± 3 47 ± 3 58 ± 4
WaSH committee exists at the facility, and has met in the past 6 months.
22 ± 3 44 ± 4 79 ± 5 44 ± 4 51 ± 4 39 ± 4 41 ± 4 50 ± 4 45 ± 4 29 ± 3 26 ± 4 12 ± 2 50 ± 3 43 ± 4
Community-composed oversight committee exists at the facility, and has met in the past 6 months.
17 ± 3 59 ± 4 88 ± 4 59 ± 4 55 ± 4 69 ±3 66 ± 4 65 ± 4 71 ± 4 53 ± 4 47 ± 5 23 ± 3 46 ± 3 56 ± 4
At least one training on IPC has been held in the past year.
88 ± 3 54 ± 4 57 ± 6 54 ± 4 88 ± 3 54 ± 4 36 ± 5 44 ± 5 65 ± 5 63 ± 4 63 ± 5 28 ± 4 94 ± 2 79 ± 4
WaSH training is provided for healthcare providers in the facility.
32 ± 4 52 ± 4 42 ± 6 52 ± 4 62 ± 4 43 ± 4 34 ± 4 44 ± 4 61 ± 1 50 ± 4 36 ± 4 23 ± 3 63 ± 3 67 ± 4
A sufficient budget has been allocated for IPC/WaSH supplies.
6 ± 2 19 ± 3 5 ± 2 18 ± 3 23 ± 3 10 ± 2 39 ± 2 15 ± 1 19 ± 4 7 ± 2 5 ± 2 1 ± 0.1 41 ± 3 18 ± 3
In 64% of all HCFs where water samples were collected, the sample was in conformity with World Health Organization (WHO) drinking-water quality guidelines based on Escherichia coli testing (<1 MPN E. coli per 100 mL water) (Table 6).
21
Table 6. Proportion of healthcare facilities where water was in conformity with drinking-water quality guidelines (as defined by WHO) at the time of survey, by country. (Point estimates are shown ± standard error. MPN = “most probable number”.)
Eastern Africa Southern Africa West Africa Southern Asia Southern Americas Ethiopia (%) Kenya (%) Rwanda (%) Uganda (%) Tanzania (%) Zambia (%) Malawi (%) Mozambique (%) Zimbabwe (%) Ghana (%) Mali (%) Niger (%) India (%) Honduras (%) In conformity (<1 MPN E. coli/100 mL) 73 ± 5 62 ± 4 85 ± 4 62 ± 4 54 ± 4 79 ± 3 81 ± 4 69 ± 4 71 ± 5 52 ± 4 64 ± 5 51 ± 5 42 ± 4 47 ± 5 4.2 Logistic regressions
Univariable logistic regression within each individual country demonstrated that the following factors had a statistically significant association (p < 0.05) with water quality risk level (Table 7):
Table 7. Factors associated with conformity with drinking-water quality guidelines (as defined by WHO in univariable logistic models, by country.
Country Significantly associated factor (p < 0.05) Odds Ratio Relationship Pseudo R2
Kenya Treatment of water 2.02 Factor is protective 0.0213 Rwanda Storage of water 10.83 Factor is protective 0.1125 Treatment of water 4.14 Factor is protective 0.0609 Tanzania Storage of water 4.10 Factor is protective 0.0342 Ghana WaSH training provided for healthcare professionals 2.54 Factor is protective 0.0383 Treatment of water 0.08 Factor is detrimental 0.0443 Niger Average number of patients served by the facility 1.02 Factor is protective 0.0443 Mozambique Use of an improved water source 4.60 Factor is protective 0.0497 India Treatment of water 1.82 Factor is protective 0.0142
Existence of an official infection control policy, procedure, or document for the healthcare facility
0.45 Factor is detrimental 0.0257 Honduras Storage of water 3.04 Factor is protective 0.0537 Treatment of water 2.51 Factor is protective 0.0370
22
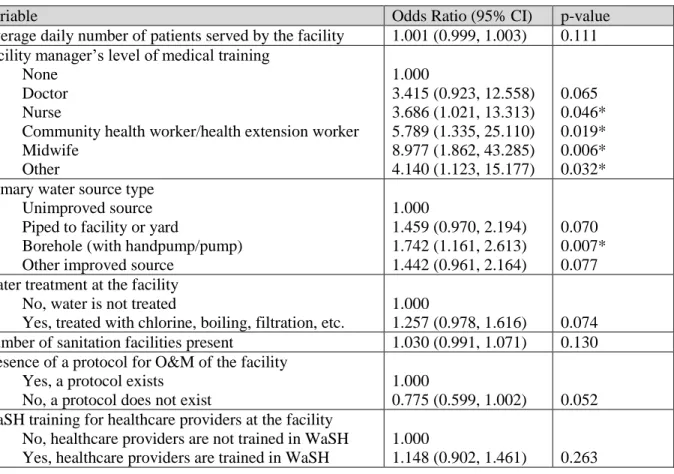
In the multivariable mixed-effects logistic regression with the full 14-country dataset (clustered by country) the interclass correlation (ICC) was 0.088 (95% CI: 0.039, 0.184), meaning that about 9% of the variance in water quality is attributable to differences across countries instead of HCF-level characteristics. This regression demonstrated that HCFs managed by a person with some level of medical training are at least three times as likely to have safe water than those managed by a person with no medical training. There are no statistically significant differences between the different types of medical training, but the odds ratios for HCFs managed by community health workers/health extension workers (OR = 5.79) and midwives (OR = 8.98) are particularly high. Use of an improved water source is also associated with higher water quality in HCFs. Treatment of water and presence of a protocol for operations and management of the HCF appeared to be associated with safer water quality, although this relationship was only borderline significant at the 95% confidence level in the multivariable model (p = 0.074, p = 0.052) (Table 8).
23
Table 8. Factors associated with statistically significant changes in water quality risk level (as defined by WHO), across all 14 aggregated countries in a multivariable logistic model. Overall
model p = 0.0030, based on n = 1,479, and 𝜒̅2 for LR vs. logistic model < 0.0001. Note:
Asterisks (*) indicate statistically significant associations at the 95% confidence level, p < 0.05.
Variable Odds Ratio (95% CI) p-value
Average daily number of patients served by the facility 1.001 (0.999, 1.003) 0.111 Facility manager’s level of medical training
None Doctor Nurse
Community health worker/health extension worker Midwife Other 1.000 3.415 (0.923, 12.558) 3.686 (1.021, 13.313) 5.789 (1.335, 25.110) 8.977 (1.862, 43.285) 4.140 (1.123, 15.177) 0.065 0.046* 0.019* 0.006* 0.032* Primary water source type
Unimproved source Piped to facility or yard
Borehole (with handpump/pump) Other improved source
1.000 1.459 (0.970, 2.194) 1.742 (1.161, 2.613) 1.442 (0.961, 2.164) 0.070 0.007* 0.077 Water treatment at the facility
No, water is not treated
Yes, treated with chlorine, boiling, filtration, etc.
1.000
1.257 (0.978, 1.616) 0.074 Number of sanitation facilities present 1.030 (0.991, 1.071) 0.130 Presence of a protocol for O&M of the facility
Yes, a protocol exists No, a protocol does not exist
1.000
0.775 (0.599, 1.002) 0.052 WaSH training for healthcare providers at the facility
No, healthcare providers are not trained in WaSH Yes, healthcare providers are trained in WaSH
1.000
24
CHAPTER 5: DISCUSSION 5.1 Descriptive analysis
Overall, the majority of healthcare facilities (HCFs) surveyed were using an improved source of water and had water available at the time of the survey; however, only 3 in 5 HCFs had a main water source on-premises. Because the water source was commonly off-premises in countries such as Ethiopia and Niger, 56% of the surveyed HCFs used a basic water service, 34% used a limited water service, and 10% had no service. Of the 1,292 HCFs who reported that water was stored in a container, 96% used a container with a lid, but only 62% reported that water was extracted from the container using a safe method such as dispensing from a spigot, pouring, or scooping with a long-handled ladle. (This varied by country, from 28% safe extraction in Niger to 99% safe extraction in Rwanda).
Management and training within HCFs varied widely based on country, with no obvious inter-country trends. The majority of HCFs are working with insufficient funding: only 1% of HCFs in Niger to 41% in India reported that they had a budget for the facility which included sufficient funding for WaSH infrastructure, services, and personnel.
Of the 1,679 HCFs where water samples were collected, only 64% of HCFs had water in conformity with World Health Organization drinking-water standards (<1 MPN E. coli per 100 mL water).
25 5.2 Influence of water source
We found that use of an improved water source was associated with safer water quality in the aggregated 14-country dataset. The odds of having uncontaminated water for a HCF with an improved main water source are approximately 1.4 times those of an HCF using an unimproved source, with boreholes performing particularly well. This is a logical extension of current knowledge on water quality: improved water sources are by definition constructed in a way less likely to have fecal contamination, and piped supplies and boreholes tend to outperform other improved sources (R. Bain et al., 2014; K. F. Shields, Bain, Cronk, Wright, & Bartram, 2015). Note that if the improved source of water is piped directly into the facility or onto the premises, and if it is used directly from the source instead of being collected and later extracted from a container, there are fewer opportunities for contamination of the water.
5.3 Influence of treatment
Treatment of water was associated with safer water quality in four countries: Kenya (OR = 2.02), Rwanda (OR = 4.14), India (OR = 1.82), and Honduras (OR = 2.51). This relationship was also present, though weaker, in the 14-country aggregate analysis (OR = 1.26, p = 0.074). Again, this is consistent with current knowledge on water quality: treatment by boiling, adding chlorine, filtering, etc. kills or removes bacteria and other microbes.
In one country (Ghana), treatment of water was associated with worse water quality, but this is likely due to collinearity with primary water source type. In Ghana, HCFs with an
improved primary water source were more likely to have safe water than HCFs with an unimproved source of water (OR = 2.43, p = 0.071). However, 24% of HCFs with an unimproved primary water source treated their water, as opposed to 4% of HCFs with an improved primary water source; this difference was statistically significant (p < 0.001). This
26
suggests that, of the 6% of Ghanaian HCFs where water is treated, the treatment methods are not sufficient for disinfecting the water.
5.4 Influence of storage
Univariable regressions demonstrated an association between storage of water and safe water quality in certain countries. In Rwanda, Tanzania, and Honduras, HCFs where water was stored in a container were more likely to have safe water than HCFs where water was not stored. However, this is likely due to collinearity with treatment rather than the effect of storage itself: HCFs where water was stored in a container had the opportunity to treat their water before use, whereas those who used water directly from the source were more likely to be exposed to fecal contamination. Respondents at HCFs where water was stored in a container were more likely to treat their water than respondents at HCFs where water was not stored (p < 0.001 in Rwanda and Tanzania, p = 0.015 in Honduras).
5.5 Influence of management and training
We found that water quality in HCFs is influenced by organizational management and training. In Ghana, WaSH training for healthcare professionals was associated with safer water quality (OR = 2.54). In India, the existence of an infection prevention and control policy at the HCF was associated with worse water quality (OR = 0.45). In the 14-country aggregate analysis, we also found that HCFs managed by a person with some medical training (doctor, nurse, health extension worker, etc.) were three to four times as likely to have safe water than HCFs managed by a person with no medical training, and that HCFs with a protocol for operation and
management of the facility (including procurement of WaSH supplies) were 1.29 times as likely to have safe water (p = 0.052).
27 5.6 Comparisons to existing literature
There are few studies of water quality in rural healthcare facilities in low- and middle-income countries: the author is aware of five studies which describe water quality in these settings. One study of drinking-water contamination after a tropical cyclone measured fecal coliforms at numerous sites across Fiji, including four hospitals; samples at one rural hospital had 2 fecal coliforms per 100 mL water (Mosley, Sharp, & Singh, 2004). One study described the implementation of an ozone generator used to treat well water in a rural hospital in
Colombia; the authors recorded influent water with 10 to 50,000 colony-forming units (CFU) of fecal coliform bacteria per 100 mL, and effluent with 0 to 178 CFU fecal coliform per 100 mL (Echeverry Ibarra, Cadavid Ramírez, Alonso, Aponte Mayor, & Gálvis Castaño, 2008). Another study in Rwanda found that in 17 rural HCFs, 10 out of 24 (42%) of water samples directly from taps met WHO guidelines for E. coli while 15 of 16 (94%) of treated drinking-water samples met WHO guidelines (Huttinger et al., 2017). Finally, a study by the same authors tracked the
performance of ultrafiltration and chlorination treatment systems newly installed in 10 rural HCFs over a 22-month period. The authors found that before intervention, E. coli was detected in 17% of water samples. During periods where treatment was completely operational, 98% of samples met WHO guidelines for E. coli (Huttinger et al., 2015). However, estimates of
“typical” levels of water contamination in rural HCFs cannot be estimated from these studies: all were collected from groups of 17 or fewer HCFs which were not randomly selected, two of the above studies were evaluations of treatment technologies (ozone, ultrafiltration) which are not commonly used in HCF in rural areas of LMIC, and one documented atypical conditions after a natural disaster.
28
One other study exists which documents water quality in rural HCF within Uganda and Mozambique (Guo et al., 2017). The study, conducted in 2014, found that 30% of water samples in Mozambique were contaminated with E. coli, similar to the 31% in this study. In 2014, 15.3% of water samples in Uganda were contaminated with E. coli, as compared to 38% in this study. This discrepancy may be due to slight differences in the subnational regions covered in Uganda in both studies, as well as differing sample sizes (n = 144 in 2014 study, vs. n = 68 in this study). However, Guo et al. only presented descriptive statistics on water quality and did not evaluate predictors of water quality.
5.7 Limitations
The results of this study may be affected by several limitations. Firstly, the cross-sectional design of the study means that we were not able to establish causality (although we were able to demonstrate a correlation between these factors and changes in water quality), and we were also unable to gauge effects such as seasonality. These data were also subject to social desirability bias and non-response bias, although we tried to limit bias and variability by using a standardized format to ask the questions and training all enumerators on impartial interview technique. Furthermore, since water samples were only taken at HCFs where water was available at the time of the survey, the water quality results may underrepresent HCFs with intermittent or unreliable water service, which are more likely to have contaminated water.
In this study, water quality was measured with a single water sample tested for E. coli at each HCF. This is a moderate indicator of actual water safety, but does not encompass all aspects of safety, including chemical contaminants and microbial contaminants other than bacteria, as well as safety over time. While we have presented statistically significant (or borderline statistically significant) relationships, we should note that the pseudo-R2 value for all of the
29
univariate regressions were low, with the largest R2 value only 0.1125. This indicates that most of the variability in water quality is still unexplained by the variables we tested. Some of this variability might result from noise in the data, as measurements of E. coli can vary widely by day and time of day even when taken from the same source. Additionally, variability might be
explained by other factors such as country (which accounted for 9% of variability based on our regression model), seasonality, water point characteristics, proximity to cities, or natural variation in water quality over time.
5.8 Takeaways
This study is the largest known study of WaSH in rural HCFs in LMIC. It provides descriptive information on the status of water service levels for over 2,000 HCFs in 14 countries. To our knowledge, this is also the first study which identifies predictors of water quality in these settings. It confirms that some factors that influence water quality in the household setting (use of an improved water source and water treatment) are also applicable in HCFs, and identifies new areas in organization and management of HCFs (hiring of facility managers with medical background, preparation of an operations and maintenance plan for the facility) that can be targeted in order to improve water quality in HCFs.
30
CHAPTER 6: CONCLUSIONS
A safe water supply is necessary for healthcare facilities (HCFs) in order to provide clean water, and to maintain a hygienic environment that both patients and staff can trust.
Understanding the predictors of water quality in HCFs may help stakeholders such as government officials, local and international non-governmental organizations (NGOs), HCF administrators, and researchers when planning programs and identifying opportunities for improving water quality in HCFs.
We found that use of an improved water source was associated with improved water quality in HCFs. HCFs who boiled, chlorinated, filtered, or otherwise treated their water were also more likely to have “safe” water. Based on this information, NGOs, government officials, and other program implementers should continue increasing access to improved sources of water. Though the majority of HCFs have access to an improved source of water, 14% of HCFs remain without improved water; these may be HCFs that are particularly remote or otherwise hard to reach, and they may require new strategies and/or increased intensity of effort to be provided with an improved water source. The same groups should also continue to promote water treatment in HCFs, especially in areas where source water quality is poor.
We also demonstrated that existence of a protocol for operations and management of the HCF and management of HCFs by a person with medical training are associated with safer water quality. HCF administrators might consider incorporating these elements into their HCFs by hiring people with WaSH and medical knowledge to manage HCF operations, as well as creating
31
official policies for regularly procuring WaSH for the facility. For government officials who are are compiling any rules or ‘best practices’ in WaSH or management of HCFs, these two elements could be incorporated.
Finally, researchers investigating water quality in HCFs might consider changing aspects of our existing study design – for instance, increasing the number of samples taken from each HCF, measuring for other types of contaminants such as viruses and protozoa, or using a
longitudinal design rather than a cross-sectional design – in order to reduce variability and noise in the data.
While some factors which influence water quality (country) are not modifiable, some of the other predictors of water quality identified in this study can be changed in order to increase the likelihood that a HCF uses water in conformity with WHO guidelines for E. coli. Overall, we found that water source and water treatment, which have been identified in other settings such as households, are also relevant in HCFs. Additional organizational factors such as institutional policy and manager training can also be targeted to improve water quality.
CC BY-SA 2017, The Water Institute at UNC
32
APPENDIX: FULL HEALTHCARE FACILITY QUESTIONNAIRE
World Vision 14-Country Evaluation: Healthcare Facility
Survey Master Copy
0.01 Metadata
If the head doctor is available, interview this person. If he/she is not available, interview the head nurse. If this person is not available, a nurse at the health center who has worked there for more than 2 years can be interviewed.
0.01 [For Enumerator] Country
☐ Ethiopia ☐ Kenya ☐ Rwanda ☐ Uganda ☐ Tanzania ☐ Ghana ☐ Mali ☐ Niger ☐ Zambia ☐ Malawi ☐ Mozambique ☐ Zimbabwe ☐ India ☐ Honduras
0.02 [For Enumerator] 1st administrative district
☐ Not Applicable
CC BY-SA 2017, The Water Institute at UNC
33 ☐ Not Applicable
0.04 [For Enumerator] 3rd administrative district Hint: Do not capitalize
☐ Not Applicable
[For Enumerator] 4th Administrative District Hint: Capitalize first letter only
☐ Not Applicable
0.05 [For Enumerator] Community/village Hint: Do not capitalize
0.06 [For Enumerator] Health facility name
0.08 [For Enumerator] Visit to Health Center
☐ 1st Visit ☐ 2nd Visit ☐ 3rd Vist ☐ 4th Visit
0.09 [For Enumerator] Day of the week
☐ Monday ☐ Tuesday ☐ Wednesday ☐ Thursday ☐ Friday ☐ Saturday ☐ Sunday
CC BY-SA 2017, The Water Institute at UNC
34 0.11 [For Enumerator] Enumerator name
0.12 [For Enumerator] Is an eligible respondent available to do the interview?
☐ Yes ☐ No
If 0.12 [For Enumerator] Is an eligible respondent available to do the interview? is Yes:
0.13 [For Enumerator] Is the head doctor, head nurse, or eligible nurse available for the survey?
☐ Yes, head doctor ☐ Yes, head nurse
☐ Yes, nurse who has worked at facility for >2 years ☐ No
☐ Other (please specify)
If 0.12 [For Enumerator] Is an eligible respondent available to do the interview? is No: 0.14 [For Enumerator] Why is no eligible person available for the survey?
☐ No one at health center
☐ Unoccupied/Vacant/Demolished Health Center ☐ Selected address is not a health center
☐ No eligible respondent at facility ☐ Other (please specify)
If 0.13 [For Enumerator] Is the head doctor, head nurse, or eligible nurse available for the survey? is No: 0.15 [For Enumerator] Notes for best time to return
0.16 [For Enumerator] GPS of HCF
CC BY-SA 2017, The Water Institute at UNC
35
☐ Yes ☐ No
If 0.17 [For Enumerator] Has informed consent been obtained? is Yes: HEALTH FACILITY DATA
1.02. [For Respondent] Type of facility (circle one)
☐ Health Post ☐ Health Center ☐ Private Clinic ☐ Sub Centre
☐ Primary Health Center
☐ Community Health Center/ Block Health Center ☐ Other (please specify)
1.03. What is the average number of patients served each day by this facility?
☐ Don't Know ☐ Not Applicable
1.04. How many examination rooms or points of care does this facility have?
☐ Don't Know ☐ Not Applicable
1.05. Does this facility conduct maternity services including deliveries?
☐ Yes ☐ No
☐ Decline to state
☐ Don't Know
CC BY-SA 2017, The Water Institute at UNC
36 ☐ Don't Know
☐ Not Applicable
1.06. b. What is this health facility manager's level of medical training?
☐ Doctor ☐ Nurse ☐ None
☐ Other (please specify) ☐ Decline to state
☐ Don't Know
1.07: How many pregnant patients did the facility receive last week?
☐ Don't Know ☐ Not Applicable
1.09: How many children under the age of five did the facility receive last week?
☐ Don't Know ☐ Not Applicable
If 1.05. Does this facility conduct maternity services including deliveries? is Yes:
5.01. How many women (on average) are served by the maternity personnel each day?
☐ Don't Know ☐ Not Applicable
If 5.01. How many women (on average) are served by the maternity personnel each day? (magnitude) is greater than 0:
5.02. How many deliveries occur per week at the health facility?
☐ Don't Know ☐ Not Applicable
CC BY-SA 2017, The Water Institute at UNC
37
ACCESS TO SAFE WATER
2.01.What is the main (most often used) water point type used by this health facility? (Check box next to the appropriate category.)
☐ Piped water into facility ☐ Piped water into yard ☐ Public tap
☐ Borehole (with handpump/pump) ☐ Protected dug well (closed) ☐ Unprotected dug well (open) ☐ Protected spring (closed) ☐ Unprotected spring (open) ☐ Rainwater collection ☐ Water-selling cart or truck ☐ Surface water
☐ Bottled water or sachet ☐ Other (please specify)
2. 02.Where is the main water point for the facility?
☐ On premises ☐ Within 500 m ☐ Further than 500 m
☐ No water source available ☐ Don't Know
☐ Decline to state
If 2.02.Where is the main water point for the facility? isn't No water source available:
2.03. Is water available from the main water point right now? (If on premises, observe if water is available)
☐ Yes, observed
☐ Yes, reported but not observed ☐ No
CC BY-SA 2017, The Water Institute at UNC
38
☐ Decline to state
☐ Don't Know
2. 04.Does this health facility store drinking water in a container?
Hint: If no, ask to take a water sample from their main water point. If yes, ask the respondent to see the container.
☐ Yes ☐ No
☐ Decline to state
☐ Don't Know
If 2.04.Does this health facility store drinking water in a container? is Yes:
2.05. [Observe] Type(s) of container(s) used to store water. (Check box next to any that apply.)
☐ Narrow opening container ☐ Wide opening container ☐ Container with spigot/tap ☐ Other (please specify)
If 2.04.Does this health facility store drinking water in a container? is Yes:
2.06. [Observe] Does the health facility’s water storage container have a lid that completely covers it?
☐ Yes ☐ No
If 2.04.Does this health facility store drinking water in a container? is Yes:
2.07. Can you show me how you would normally take water for drinking? (Check box next
to any that apply.) (Use this water for the microbial water test)
Hint: (Mark only the options that are directly used to remove water from the container. For example, if water is ladled out of a container and later poured into a bowl, you should only mark “Dipper or ladle” here.)
☐ Water poured directly from container ☐ Dispensed through a spigot or spout ☐ Removed with jar, bowl, bucket, or cup
CC BY-SA 2017, The Water Institute at UNC
39
☐ Removed with dipper or ladle ☐ Removed with hands
☐ Other (please specify) ☐ Don't know
☐ Decline to state
[For Enumerator] Take a picture of the container or water point where the respondent served you water from.
☐ Not Applicable
2.07b Scan the bar code of the microbial water sample.
☐ Not Applicable
If 2.07b Scan the bar code of the microbial water sample. is Not
Applicable: Take a picture of the microbial sample barcode
If 2.07b Scan the bar code of the microbial water sample. is Not Applicable: 2.17b Enter the barcode number
☐ Not Applicable
[For Enumerator] Are you taking a sample duplicate?
☐ Yes ☐ No
If [For Enumerator] Are you taking a sample duplicate? is Yes: Scan the barcode of the sample duplicate
☐ Not Applicable
If [For Enumerator] Are you taking a sample duplicate? is Yes: 2.17b Enter the barcode number
CC BY-SA 2017, The Water Institute at UNC
40 ☐ Not Applicable
[For Enumerator] Are you taking a sample blank?
☐ Yes ☐ No
If [For Enumerator] Are you taking a sample blank? is Yes: Scan the barcode of the sample blank
☐ Not Applicable
If [For Enumerator] Are you taking a sample blank? is Yes: 2.17b Enter the barcode number
Hint: You may enter NA if the barcode scanned properly
☐ Not Applicable
2.08. Does the health facility do anything to the water to ‘make it safer?’
☐ Yes ☐ No
☐ Decline to state
☐ Don't Know
If 2.08. Does the health facility do anything to the water to ‘make it safer?’ is Yes:
2.09. What do you do to make the water safer? (Check boxes next to all that apply.)
☐ Boiling
☐ Chlorine (liquid, powder, or tablets) ☐ Filtration with a cloth
☐ Ceramic filter
☐ Other (please specify) ☐ Decline to state
CC BY-SA 2017, The Water Institute at UNC
41 2.10. Does the main water point operate continuously?
Hint: (A continuous water supply means that water is available to the health facility 24 hours a day)
☐ Yes ☐ No
☐ Decline to state
☐ Don't Know
If 2.10. Does the main water point operate continuously? is No:
2.11. Does the health facility’s water point provide service at fixed times?
Hint: Scheduled water service is service that provides water at designated times of the day on a schedule.
☐ Yes ☐ No
☐ Decline to state
☐ Don't Know
If 2.10. Does the main water point operate continuously? is No:
2.12. How many hours per week does the health facility receive water?
☐ Don't Know ☐ Not Applicable
2.13. Has the health facility’s primary (main, most often used) water point been out of service in the past two weeks?
☐ Yes ☐ No
☐ Decline to state
☐ Don't Know
If 2.13. Has the health facility’s primary (main, most often used) water point been out of service in the past two weeks? is Yes:
2.14. How many times was the primary water point out of service in the past two weeks?
CC BY-SA 2017, The Water Institute at UNC
42 ☐ Not Applicable
2.15. Is water at this facility accessible for people with reduced mobility? (either water source or storage container)
☐ Yes ☐ No
☐ Decline to state
☐ Don't Know
If 2.15. Is water at this facility accessible for people with reduced mobility? (either water source or storage container) is No:
2.16. What are the reasons why the water is not accessible for people with reduced mobility? [Do not read the answers aloud. Mark all that apply]
☐ Water point is far from the health facility
☐ Path to water point/storage container is difficult to navigate
☐ Pump or water tap superstructure is difficult to access or traverse ☐ Water taps or pumps are difficult to manipulate
☐ Location of water container is inaccessible ☐ Water container is too heavy to lift or carry
☐ Visual impairment hinders use of the water container ☐ Unable to grasp or balance the container
☐ Not allowed or discouraged by staff or household members to access/manipulate water
☐ No one available to help them access water
☐ Embarrassed/ashamed to fetch water at the water point
☐ Other (please specify) ☐ Decline to state
☐ Don't Know
2.17. Does the health facility use any sources for drinking water other than the primary water point?
CC BY-SA 2017, The Water Institute at UNC
43
☐ No
☐ Decline to state
☐ Don't Know
If 2.17. Does the health facility use any sources for drinking water other than the primary water point? is
Yes: 2.18. What other source(s) of drinking water does the health facility use? (Check box next
to the appropriate category.)
☐ Piped water into dwelling
☐ Piped water into yard ☐ Public tap
☐ Borehole (with handpump/pump) ☐ Protected dug well (closed) ☐ Unprotected dug well (open) ☐ Protected spring (closed) ☐ Unprotected spring (open) ☐ Rainwater collection ☐ Water-selling cart or truck ☐ Surface water
☐ Bottled water or sachet ☐ Other (please specify) ☐ Decline to state
☐ Don't Know
If 2.17. Does the health facility use any sources for drinking water other than the primary water point? is Yes:
2.19 Where is the closest alternative water source that this health facility uses?
☐ On premises ☐ Within 500 m ☐ Further than 500 m ☐ Decline to state
CC BY-SA 2017, The Water Institute at UNC
44
If 2.17. Does the health facility use any sources for drinking water other than the primary water point?
is Yes: 2.20. Does the health facility’s closest alternative water point have a continuous supply
of water?
Hint: (A continuous water supply means that water is available to the health facility 24 hours a day)
☐ Yes ☐ No
☐ Decline to state
☐ Don't Know
If 0.17 [For Enumerator] Has informed consent been obtained? is Yes: ACCESS TO SANITATION
3.00. Does the health facility have access to its own sanitation facilities?
☐ Yes ☐ No
☐ Decline to state
☐ Don't Know
3. 01.How many sanitation facilities are at/in this health facility? Hint: Count each toilet or pit or drop hole
☐ Don't Know ☐ Not Applicable
If 3.01.How many sanitation facilities are at/in this health facility? is greater than 0: 3.02. How many of the sanitation facilities are being used?
☐ Don't Know
3.03. Is there open defecation at this facility?
☐ Yes ☐ No
CC BY-SA 2017, The Water Institute at UNC
45
Toilet 1
3.04. [Observe] What type of sanitation facility is this?
☐ Flush toilet to piped sewer system ☐ Flushed toilet to septic tank
☐ Flushed toilet to pit latrine (single or twin)
☐ Flushed toilet to elsewhere (e.g. river, surface, etc.) ☐ Ventilated improved pit latrine (VIP)
☐ Pit latrine with slab ☐ Pit latrine without slab ☐ Composting toilet ☐ Bucket
☐ Hanging toilet ☐ Community latrines ☐ Other (please specify)
3.18. Is this sanitation facility designated for women and girls only?
☐ Yes ☐ No
☐ Decline to state
☐ Don't Know
3.20. Is this sanitation facility designated for staff only?
☐ Yes ☐ No
☐ Don't Know
Ask the respondent to take you to each of the sanitation facilities at the health facility and answer the following questions for each sanitation facility.