Effect of number of slit rows in a distributor
plate of a four duct plenum chamber in a
swirling fluidized bed
Sijin Nazar1, Ernest Markose Mathew2Abstract- This paper presents the numerical investigation via Computational Fluid Dynamic (CFD) to study the effect of number of rows and slit length in a distributor plate for air flow distribution in a swirling fluidized bed (SFB).In this study, distributor plate with seven numbers of slit rows and five numbers of rows are taken for analysis. Air flow distribution was analyzed based on the tangential velocity distribution, pressure drop at the distributor outlet and bed pressure drop. Both computational and numerical analysis is used for getting the result. According to this study, result found that more uniform velocity distribution and less pressure drop obtained in five row distributor plate. Also find that slit of length 30 mm has more advantage over 25 mm.
1. INTRODUCTION
Fluidization is the operation by which solid particles are behaves like a fluid through suspension in a liquid or gas. A fluidized bed is formed when a quantity of a solid particulate substance is placed under appropriate conditions to cause a solid /fluid mixture to behave as a fluid. Fluidized beds play an important role in many industries such as oil, gas, petrochemicals, and power plants, because of their multifunctional applications, such as mixing, drying, coating, granulation, separation, combustion etc. Many attempts have been made to improve the performance of the conventional fluidized bed. The swirling fluidized bed is an outcome of studies carried out in order to overcome the disadvantages of the conventional fluidized beds. In a SFB the fluidizing gas enters the bed at an inclination to the horizontal directed thus by a suitable design of distributor which as an array of blades with centre body, which forms annular opening. Quality fluidization with distributors having low distributor pressure drop is possible in a swirling fluidized bed. Due to the cross flow of the particles, no stable jet formation occurs in the swirling fluidized bed. . The present works have investigated the aerodynamics of a SFB by taking into the effect of distributor design on velocity distribution and pressure drop inside the bed. The most important function of a gas distributor as the name indicates is the uniform distribution of air in the bed. Design of a good gas distributor is
essential for the satisfactory performance of any fluidized bed. As for this study, distributer plate with seven numbers of rows and five number of rows are taken for analysis. Slit length are also changed for better analysis
.
2. EXPERIMENTAL INVESTIGATION The schematic diagram shown in Figure describes important parts of the experimental set-up and the photograph of the complete view of the experimental setup is presented in figure. Components of swirling fluidized bed are plenum chamber, containing vessel, distributer blower, U-tube manometer and pitot U-tube. Plenum chamber is a pressurized housing containing a gas or fluid at positive pressure. The chamber is made of mild steel plate. The distributer is placed on the plenum chamber. It has a tangential inlet pipe from blower facilitating an initial circulatory motion of air before entering the distributor.
Fig 2.1: Experimental setup
The containing vessel is made up of mild steel so as to allow the visual observation of bed particle. The height is selected suitably so as to avoid the spilling of the particles at the fluidizing velocity it acts as a bed wall so that the height is taken as 600 mm. An
important component of any fluidized bed is the gas distributor. The role of the distributor is to evenly distribute the fluidization gas across the bed inlet and hence to initiate effective gas-solids contacting. Experimental setup specification
Diameter of plenum chamber 800 mm Diameter of central cylindrical hub 400 mm Middle zone diameter 600 mm
Air Inlet area 190 * 240 mm
No. of inlet ducts 4
Area of each duct 95 * 120 mm
Height of plenum chamber
500mm,600mm,700mm . The length of the slit can be determined from the following relation.
Length of slit (L) = [𝑟𝑑 −𝑟𝑐 − 3×𝑏𝑟 ]
𝑛𝑟
Where rd - radius of the distributor = 400 mm
rc - radius of the hub at the centre = 200 mm
br - width of the ridge = 4 mm
nr - number of rows = 7
Thus length of the slit (L) = [𝟒𝟎𝟎−𝟐𝟎𝟎− 𝟑×𝟒 ]
𝟕 = 25 mm
The inner radius of each row of slits can be determined from the relation
The inner radius of the row (Ri)
= 𝑟𝑐 + 𝑛𝑠 − 1 × [𝐿 + 𝑏𝑟] = 200 + 𝑛𝑠 − 1 × [25 + 4] Where ns - position of the row starting from the centre. The inner radius of each row is given in table Sl no. Position of the
row 'ns'
Inner radius of the row (Ri)= 𝟐𝟎𝟎 + 𝒏𝒔 − 𝟏 × [𝟐𝟒 + 𝟒 ] 1 1 200 2 2 228 3 3 256 4 4 284 5 5 312 6 6 340 7 7 368
Table2.1: The inner radius of each row
Fig 2.2: Geometry of slits in distributor.
The blower is used to supply air into the distributer at sufficient velocity and flow rate. It is a centrifugal type blower and is run by a three phase motor. Manometer is provided in the experimental setup to measure the velocity of air to the bed. Both end of the U –tube manometer to the of pitot tube. So then the velocity of air through the pipe can be measured.
3. METHODOLOGY
Investigation of the air flow distribution in a SFB was conducted by experimental and also using commercial CFD software –FLUENT 15.The models of four duct plenum chamber is generated using solid works premium.
Fig 3.1: Geometry of fluidized bed
Figure shows the created model of fluidized bed chamber all dimensions are as that of experimental setup.. Hub region support and eliminate the particle sedimentation on the center of distributor. The total seven rows are created according to the original model each row has different number of slits. No slits provided on the center because of no air flow through that region.
Fig 3.2: Geometry of slits in distributor To study the effect of number of rows and length of slit, created another distributer plate.
Fig 3.4: Geometry of slits in distributor For finding the minimum fluidization velocity the pressure drop taken from different points on distributor in radial direction. From the figure the distributor plate divided into 3 different sections first section has no air flow because below that hub region second and third sections has same air flow rate because of same area. So D1, D2, D3 are 400mm, 600mm, 800 mm respectively. Here we are taking the bed pressure drop along radial distance on the distributor by from different tapings are at various distance from the center.
L10 = 210 mm, L11 = 240 mm, L12 = 300 mm
L13 = 330 mm, L14 = 360 mm
Fig 3.5: position of pressure tapings
Investigation of the air flow distribution in a SFB was conducted using commercial CFD software –ANSYS FLUENT 15 At first the analysis started with 2 million of cells then got total pressure of 101388 pa at 5 mm above distributor then repeating the analysis with increasing number of elements by 3.2 to 4.4 million total pressure also increases. The grids are generated using FLUENT. The basic principle in meshing is that it should have finer elements to get better accuracy of the result. At the same time, number of grids should not exceed available computational capacity. To achieve this objective, fine mesh was used where the solution gradient is higher and coarse mesh was used where there is low solution gradient.
Mesh is refined at areas where sudden change in cross section is there. More refinement giving on above and below of distributor to obtain the results with more accuracy. Tetrahedral meshes are using for getting good aspect ratio and orthogonal quality of meshing. The standard k-epsilon model was used to calculate the turbulent viscosity. This model is a two-transport-equation model solving for kinetic energy k and turbulent frequency epsilon. This model allows
for a more accurate near wall treatment with an automatic switch from a wall function to a low-Reynolds number formulation based on grid spacing. This model demonstrates superior performance for wall-bounded and low Reynolds number
flows.
This model shows potential for predicting transition. The operating pressure was taken as default 101325 Pa, since all the experimental measurements are taken at gauge pressure. Operating Inlet velocities are varies from 3 to 8 m/s for measuring corresponding pressure on the top of the distributor and the bed pressure drops along radial distance. Assuming all the experiments are done at standard temperature of 270C, air with corresponding properties is used for flow modeling.The different zones in the discredited model need to be given specific boundary conditions i.e., the values need to be specified at these boundaries depending upon the boundary type chosen. At the inlet, velocity inlet boundary condition was specified. The velocity corresponding to 3 was given at the inlet area at first then changes with different velocities up to 8 m/s after the solution became converged the results taken and repeat the experiment with another velocity. Inlet area is a rectangular area at the inlet duct. Here the static gauge pressure required at inlet area for the solution phase was set to be 0 Pa, value of which is not constant throughout all the solution phase. It adjusts its value in order to satisfy the flow conservative equations i.e., initially and subsequently then pressure value was calculated by the program. Pressure inlet boundary conditions were used to define the fluid pressure flow at flow inlets, along with all other scalar properties of the flow. They are suitable for both compressible and incompressible flow calculations. Pressure inlet boundary conditions can be used when the inlet pressure is known but the rate and /or velocity is known. Mass flow boundary conditions can be used in FLUENT to provide a prescribed mass flux at the inlet. The total pressure is adjusted locally to achieve the velocity needed to provide the prescribed mass flux. This is in contrast to the pressure inlet boundary conditions, where inflow stagnation properties are prescribed and mass flux varies depending in the interior solution. Inlet parameters such as velocity taken as 8 m/s ,7m/s,6m/s,5 m/s,4m/s,3m/s and fluid medium is air.
4. RESULTS AND DISCUSSION
For validation of the numerical model using experimental values, the Pressure Vs inlet velocity curves of the model for positions corresponding to pressure tapings on the experimental set up need to
plotted and compared with the plot obtained from experimental analysis. If the graphs are found similar up to an extent, numerical model can be finalized as validated and further analysis can be conducted using the numerical model.
Pressure velocity curves for different radial positions over the distributor plate were plotted for the experimental set up and CFD model for comparison. Position of these pressure tapings were at radial distances 21 cm,24 cm, 30 cm, 33 cm and 36 cm respectively named as P1, P2, P3, P4 and P5. The comparison of plots obtained as listed in below figure
Fig 4.1: Pressure vs velocity curve comparison at P1
Fig 4.2: Pressure vs velocity curve comparison at P2
Fig 4.3: Pressure vs velocity curve comparison at P3
Fig 4.5 Pressure vs velocity curve comparison at P5 For finding the effect number of slit rows in a distributer plate, five row plates and 7 row plate are compared. Five row plates has a slit length 30mm and 7 row plate has 250 mm. The following figure shows the air velocity distribution across plenum chamber and fluidization zone of 7 channel distributer plate and 5 channel plates. For comparison inlet velocity is taken as 8m/s for reference.
For good fluidization velocity distribution should be more uniform across the distributer plate. From the figure, we can see that for five channel plate velocity distribution increases. Therefore localized swirling increases in the case of five channel distributer plate when compare to seven channel plate. More vortex created on the inner and middle region of the distributor that shown in the figure reduces gradually moving to outer.
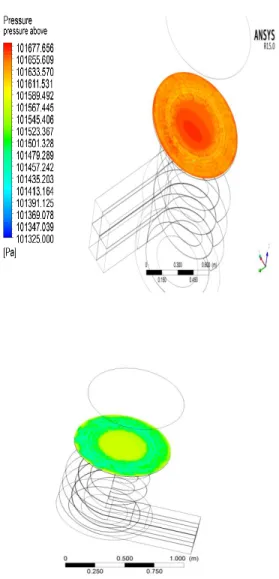
Incase of pressure distribution, pressure above the distributer plate is high enough to stabilize the bed.
Pressure variation above and below the seven channel plate is shown below
Fig 4.6: pressure contour with seven channel plate
Pressure variation above and below the five channel plate is shown below
Fig 4.7 :pressure contor with five channel
Pressure should be uniform over the distributer plate for good fluidization. Pressure distribution of five channel plate and seven channel plates are shown below
Pressure variation at different point of two type distributer plate can be plotted in the graph and compared. Pressure velocity curve is an important parameter in determining the performance of a swirling fluidized bed The graph corresponding to different pressure are shown below. Pressure and velocity curve at point one shown below
Fig 4.8 : Pressure at point P1 at different velocity
Fig 4.9: pressure at point P2 at different velocity
Fig 4.8: pressure at point P3
Fig 4.9: pressure at point P4
Fig 6: pressure at point P6
At point P1 and P2 five channel distributor plate and seven channel plate have almost similar curve. But slightly higher pressure curve obtained in five channel. But at point P3 seven channel has higher pressure curve with different velocities .At point P4,P5,P6 five channel has higher pressure curve over seven channel.
5. CONCLUSION
CFD simulation is an effective method to understand the complex phenomena of velocity distribution in swirling fluidized bed. According to CFD analysis, ,result found that more uniform velocity distribution and less pressure drop obtained in five row distributer plate .It can be concluded that number of slit rows has stronger influence on velocity distribution and pressure drop. Also conclude that if slit length increases better characteristic will be obtained. So we can conclude that five channel with 30 mm slit length better configuration compared to seven channels with 25 mm slit length.
REFERENCES
[1] Mohideen M F, Seri S M and Raghavan V R 2012 Fluidization of Geldart Type-D Particles in a Swirling Fluidized Bed Applied Mechanics and Materials. 110-116 3720 – 27
[2] Agarwal J. c., Davis W. L., and King D. T., (1962), ""Fluidized -bed Coal dryer", Chemical Engil/eering
Progress, Vo1.58, No. Il,pp 85-90.
[3] Binod Srccnivasan and Vijay R. Raghavan, (2002), "Hydrodynamics or a swirling tluidised bed", ('hemical
£i7gineering and Processing. VolA I. PP 99- 106.
[4] Birk R. H., Camp G. A. and Hutchinson L. B., (1990). "Design or an Agglomeration Resistant Gas Distributor". AIChE Symposium series. Vol 86. PP 16-21.
[5] Botterill .f. S. M., Tcoman Y. and Yiiregir K. R., (1982). "The Effect or Operating temperature on the Velocity of Minimum Fluidization. Bed Voidage
and General Behaviour". Powder Technology, Vol.3l, pp 101-110.
[6] Geldart D., and Bayens J., (1985). '"The design of distributors for gas-fluidized beds", Powder Tee/moloK". Vol. 42. pp 67.
[7] Holman J. P. and Gajda Jr., (1989). "Experimental Methods for Engineers". Mc Graw Hill.
[8] Kroger D. G., Levy E. K. and Chen J. c., (1979), "Flow Characteristics Itl Packed and Fluidized Rotating Bed".
Powder Technology, Vo124, pp 9.
[9] Otero R. A. and Munoz C. R.. (1974), "Fluidized Bed Gas Distribution of Bubble Cap Type". POIl'der
Techn%f!y. Vol 9. Pp 279-287.
[10] Yang J.S, Liu Y.A. and Squires, (1987), "Pressure Drop across Shallow Fluidized Beds: Theory and Experiment", Powder Technology, Vol 53, pp 79-89.
Sijin Nazar1 ,M Tech Scholar, Department of Mechanical Engineering, Mar Athanasius College of Engineering, Kothamangalam Ernakulum, India.He had completed his graduation in Mechanical Engineering, from RIT, kottayam Ernest Markose Mathew 2 , Associate. Professor, Department of
Mechanical Engineering, Mar Athanasius College of Engineering, Kothamangalam Ernakulum, India. He had completed his graduation in mechanical engineering from mg university and post graduation from SJCE Mysore. He is also life member of ISTE.