research paper series
China and the World Economy
Research Paper 2007/19
The effects of governance changes on bank efficiency in China:
A stochastic distance function approach
by
Shujie Yao and Chunxia Jiang
The Authors
Shujie Yao is a Professor and Head of the School of Contemporary Chinese Studies, University of Nottingham and an Internal Research Fellow in GEP. Chunxia Jiang is a PhD student at Middlesex University Business School.
Acknowledgements
This research is supported by the EU-China Financial Services Cooperation Project (EuropeAid 112901/C/SV/CN), and the Leverhulme Trust (F/00765/A). Shujie Yao gratefully acknowledges financial support through the Leverhulme Trust (Grant No. F114/BF). The views expressed here do not represent those of sponsors but solely of the authors.
The effects of governance changes on bank efficiency in China:
A stochastic distance function approach
by
Shujie Yao and Chunxia Jiang
Abstract
China has accelerated and deepened bank reform since it joined the WTO in 2001. Employing a stochastic distance function, this paper investigates the technical efficiency of banks and examines the static, selection and dynamic effects of governance changes on bank efficiency in China for the period 1995-2005. Our results show that bank efficiency has been improved and state-owned banks still perform poorly except for a noticeable improvement from 2003. Strong selection effects are found from both the foreign acquisition and going-public reform strategies. Foreign acquisition may benefit bank efficiency in the long run, but going-public appears to have just some short run effects. One obvious policy implication is that foreign competition is beneficial to China’s on-going bank reform, and going-public is just a means to allow effective foreign competition.
JEL classification: D21, L32, P31
Keywords: Distance function, Efficiency, Banking, China
Outline
1. Introduction
2. Chinese banking system and efficiency literature 3. Methodologies
4. Data and empirical methods 5. Empirical results
Non-Technical Summary
State-owned commercial banks reform is an important part of China’s economic reform over the last two decades. When China joined the World Trade Organisation (WTO) in December 2001, many pundits believed that China’s four large state-owned commercial banks would not be able to face up to the tough foreign competition. Consequently, China had to accelerate and deepen its bank reform as soon as it joined the WTO. The latest and most radically reform involved two important strategies: foreign acquisition and going public. Foreign acquisition takes various forms from strategic alliance to direct buying of shares and stake of Chinese banks. From 1998 to 2006, the government stripped off 2.57 billion RMB of non-performing loans from the four large state banks and injected massive fresh capital to enable them to be listed in the stock exchanges. The successful IPOs of Bank of China, China Construction Bank and Industrial and Commercial Bank of China in 2005 and 2006 and their extraordinarily bullish performance in the stock markets are a cornerstone of China’s bank reform.
To analyse and test how such reforms have transformed China’s banks, this paper employs a stochastic distance function to investigate the technical efficiency of banks and examines the static, selection and dynamic effects of governance changes on bank efficiency for 31 national and regional commercial banks over the period 1995-2005. The sample banks represent 85% of China’s total banking assets and activities. The empirical results show that bank efficiency has been improved but state-owned banks still perform poorly except for a noticeable improvement from 2003. Strong selection effects are found from both the foreign acquisition and going-public reform strategies. Foreign acquisition may benefit bank efficiency in the long run, but going-public appears to have just some short run effects. One obvious policy implication is that foreign competition is beneficial to China’s on-going bank reform, and going-public is just a means to allow effective foreign competition. The super bullish performance of China’s listed banks partly reflect their efficiency improvement as a result of ownership diversification and foreign competition, but more so as a result of positive expectation of domestic and foreign investors on China’s future economic prospects.
1. Introduction
The Chinese banking system has experienced fundamental structural changes and reforms along with China’s comprehensive economic reform since 1978. The aim is to transform the sector from a state-owned, monopolistic and policy-driven to a multi-ownership, competitive and profit-oriented system. However, the pace of bank reform has lagged far behind the reform in the real economic sectors. With the rules and obligations set by the World Trade Organisation (WTO), domestic banks have to compete with foreign banks on a level playing field from 2007 onwards. Accordingly, China has accelerated and deepened its bank reform since it joined the WTO in 2001.
With a sequence of capital injections and stripping-off of non-performing loans (NPLs) from 1998 amounting to 2.57 trillion RMB, the Bank of China (BOC), the China Construction Bank (CCB) and the Industrial and Commercial Bank of China (ICBC) have successfully made their initial public offering (IPO) in the Shanghai and Hong Kong Stock Exchanges. The market reaction to these IPOs was highly positive from the second half of 2006, with their share prices rocketing by up to 100%, making them among the few largest firms in the Shanghai Stock Exchange. Based on market values, ICBC is now the second largest bank in the world, second only to Citigroup.
Recent reforms have focused on ownership shift of state-owned banks in the hope of enhancing corporate governance to improve efficiency. Foreign acquisition and IPO are two major strategies of reforming state-owned banks. The underpinning economic theories are the principal-agent problem and soft budgetary constraints. Both are possible sources of inefficiency because that agent (management) may not act on the best interests of the principal (the owner) and a soft budget constraint gives rise to a moral hazard problem. These strategies are expected to change banks’ corporate governance and result in a hard budget, helping to resolve the agency and moral hazard problems. These reform measures are also grounded on the mounting empirical findings in which state-ownership is generally found less efficient.
A five-year grace period of WTO has elapsed. Chinese banks have become a real player in an open market without a government protecting umbrella. A number of research questions are of particular importance and interest. How efficient are Chinese banks? How those reform efforts affect bank efficiency? What are the effects of foreign acquisitions and IPO
on the banking sector? What kind of further reforms are likely to be required? This paper addresses these questions and contributes to existing literature from two main aspects. The first is to develop a stochastic frontier model by incorporating governance changes and overcoming the potential drawbacks of other commonly used techniques to estimate efficiency. The second is to provide reliable and up-to-date technical efficiency measurement for China’s commercial banks and to jointly analyze the static, selection, dynamic effects of corporate governance changes on bank efficiency.
This paper develops a comprehensive model to investigate bank efficiency and the impact of governance changes by combining the advantages of existing models, procedures and methods. It adopts a stochastic frontier approach (SFA) that separates the error term into a random error ( ) and inefficiency ( ), resulting in more accurate technical efficiency estimates. It employs a distance function, allowing for the estimation of a multiple inputs and multiple outputs production technology without input price information and behavioural assumptions. Moreover, it uses a single-step procedure to overcome serious econometric problems suffered by a two-step procedure. In addition, the model incorporates Berger et al. (2005) method into the technical inefficiency effects model to jointly examine the static, selection, and dynamic effects of corporate governance changes.
i
v ui
Using data for the period 1995-2005, the regression results show that bank efficiency has been improved in China. The average efficiency level is about 70%, which is moderate compared with that of the US or European banks. Corporate governance and risk taking characteristics are found to have a significant impact on bank efficiency. State-owned banks, on average, still performed poorly although there have been significant improvement in the last three years (static effect). Strong selection effects are found for both foreign acquisition and initial public offering (IPO). The benefits of foreign acquisition may be realised for a longer term. The going-public strategy is found to benefit in the short term but the efficiency gains are unsustainable in the long term. These results have important policy implications. Moreover, different model specifications shed important light on methodological issues of efficiency study, that is, income-based model is proved to be superior to earning assets-based model, at least from our data.
The paper is organized as follows. Section 2 introduces the Chinese banking industry and reviews literature on bank efficiency. Section 3 describes methodologies, including a
one-step procedure of stochastic frontier estimation and an output distance function approach. Section 4 specifies empirical models and describes data. Section 5 analyses empirical results. Section 6 draws conclusions with policy implications.
2. Chinese banking system and efficiency literature
2.1 The Chinese banking system
Prior to economic reforms in 1978, the Chinese banking industry was entirely dominated by the People’s Bank of China (PBC). The reform process can be divided into four periods: initial institutional restructuring (1979-1984); establishing four big state-owned commercial banks (1984-1994); reforming these state banks (1994-2003); ownership reform and foreign competition from 2003 onwards (Tang, 2005). During 1979-1984, PBC was broken up into two arms: the central bank retaining the name of PBC, and commercial operations comprising of four specialized state-owned banks, namely, Agricultural Bank of China (ABC), CCB, ICBC, and BOC. During 1984-1994, institutional restructuring was deepened. A two-tier system was created, dominated by these state banks, along with some newly established joint-equity commercial banks. Their operations were subject to frequent intervention of central and local governments to extend loans to state-owned enterprises (SOEs), resulting in mounting non-performing loans (NPLs).
The period 1994-2003 was characterised with the commercialization of the state-owned commercial banks (SOCBs). The policy lending function of SOCBs was taken away by three newly created state-owned policy banks, although they were still requested to play a significant role in policy lending. In helping SOCBs create a sound capital structure, the government injected RMB 270 billion through issuing long-term treasure bonds and off-loaded RMB 1.4 trillion NPLs via four newly established State Assets Management Companies. A series of concrete and comprehensive reforms were initiated to transform the policy-driven banking system to a market-oriented one, such as removal of credit quotas in 1998, introduction of capital adequacy requirement and the application of an internationally accepted five-classification standard scheme. Moreover, 112 city commercial banks (CCBs) were created through restructuring and consolidating the former urban credit cooperatives (Wong and Wong, 2001).
Since 2003, bank reform has been accelerated and deepened to bring the SOCBs into modern financial enterprises through two new major strategies: foreign acquisition and IPO. The government commenced the second round of financial restructuring and injected $45 billion to BOC and CCB in 2003 and $15 billion to ICBC in 2005, utilizing its excessive foreign exchange reserves. They were restructured as modern financial enterprises with a better corporate governance structure and subsequently underwent IPO so as to subject their operations to market discipline (Tang, 2005).
Meanwhile, foreign equity participation in domestic banks has been encouraged, motivated by the much-needed capital and the urgency of importing superior management and technology. All major international banking giants and financial institutions have shown great interests in this emerging market, hoping to gain a well-positioned strategic seat before its full opening up by 2007. Foreign investors started with a prudent trial investment in domestic banks since 2001, followed by a surge in 2004 and a peak in 2005, covering all types of domestic banks. More strikingly, after financial restructuring and reform, the performance of SOCBs has been improved significantly, attracting considerable foreign investment. For example, in 2005 Bank of America acquired 9% stake in CCB and the Royal Bank of Scotland, together with Merrill Lynch and Li Ka-shing, bought 10% stake in BOC. In the same year, Goldman Sachs, Allianz and American Express signed MOU with ICBC, agreeing to acquire a 10% stake (source from various press releases). By acquiring equity stakes in domestic banks, foreign investors not only avoid suffering from low efficiency claimed for foreign banks in some cases but also reduce substantial costs of establishing a branch network to serve their customers.
China has made remarkable progress in bank reforms, with far-reaching economic implications. ICBC, CCB and BOC have emerged to be among the big banks in the world. In 2004, CCB was reported as the most profitable bank among the international banking giants measured by return on equity. ICBC was listed in Shanghai and Hong Kong in October 2006. By the end of 2006, it became the second biggest bank in the world by market value.
The success of bank reform depends heavily on whether banks can really refrain from government intervention. Government intervention in lending decision still persists although less explicitly. It is also uncertain whether this implicit intervention could be reversed in the near future. As discussed in Dobson and Kashyap (2006), the 11th
Five-Year Plan has addressed the growing rural-urban and regional inequality and projects to balance urban-rural development through urbanization. Therefore, more employment is needed to absorb surplus rural labour and SOCBs are more likely to assist in achieving the overall goals and to provide necessary finance. This role is in conflict with the commercial banks’ economic objectives of profitability and efficiency. The implication is that government influence might remain and that the reform of transforming SOCBs to truly commercial banks might take longer.
2.2 Bank efficiency in transition economies and developing counties
A wealth of literature on bank efficiency has been well established, but mainly in the US and European countries1. During the last decade, more attention has been paid to bank efficiency of developing countries and transition economies. In the literature, state-owned banks are notorious for being more inefficient over other types of banks for a number of reasons. State-owned banks generally functioned as government agents to fulfil national development plan and may pursue non-economic goals such as maintaining social stability and safeguarding employment. Other reasons include a severe free-rider problem that all citizens are theoretic co-owners who are unable to influence the management of state-banks and the lack of discipline for managers of inefficient banks (Huibers, 2005).
Consequently, state ownership is considered to be a source of inefficiency and many governments attempt to privatize state-owned banks as an ultimate way of improving bank performance. Most studies find improved bank performance after privatization and financial liberalization (Williams and Nguyen, 2005; Megginson and Metter, 2002; Gilbert and Wilson, 1998), while some others argue that the positive effect may be temporal and unsustainable in the long run (Hao et al., 2001; Katib and Mathews, 2000).
Foreign acquisition and initial public offering (IPO) are two commonly used methods of privatization. Empirical literature generally concludes that foreign acquisition is associated with greater improvements in post-privatization performance than is purely domestically privatization (Fries and Taci. 2005; Bonin et al., 2005a, 2005b and Hasan and Marton,
1
2003). IPO is considered as an effective method of privatization than others by minimizing suboptimal behaviour and eliminating inefficiencies. Going public not only facilitates the adoption of market-oriented disciplines but also improves banks’ corporate governance. IPO, as the divestment mechanism of state ownership, has been proved to be a productive strategy for privatizing banks in Poland (Huibers, 2005).
The relationship between performance and corporate governance is often considered under the economic theory of principal-agent problem which arises whenever the management of an entity is separated from its owner. This problem is compounded for state-owned banks because the role of owner—the state is ambiguous, being both the regulator and owner. Governance issue in banking industry is even more complicated because of its speciality, including strengths of bank regulation and supervision, the opaqueness of bank assets, the level of markets development, and institutional environment (Levine, 2004). Appropriate governance structure is the one that eliminates inefficiency caused by principal-agent problems. Berger et al. (2005) carry out an outstanding study examining the relationship between governance changes and bank efficiency by proposing a method that accounts for the static, selection and dynamic effects of governance changes simultaneously in one model.
While the literature on bank efficiency in transition and developing countries has been well-developed during the last decade, only a handful of studies examine the efficiency of the Chinese banking sector. Using SFA, Yao et al. (2007), Fu and Heffernan (2005), and Berger et al. (2006) examine the relationship between ownership and bank efficiency and consistently report improved efficiency level and state-owned banks being the least efficient. Employing DEA, Chen et al. (2005) examine the effect of deregulation and find state-owned banks outperform other banks, whereas Hu et al. (2006) and Wang et al. (2005) come up with an opposite story that joint-stock commercial banks are more efficient than state-owned banks. These studies focus on the static effects of different governance structures on efficiency. This paper advances the existing literature by examining the effects of various ongoing reform measures and risk-taking characteristics on bank efficiency over the 1995-2005 for all types of commercial banks in China. To our best knowledge, it is the first study adopting an output distance function to estimate bank efficiency by jointly examining the static, selection and dynamic effects of governance changes, particularly foreign acquisition and IPO, on bank performance in China.
3. Methodologies
3.1 One-stage SFA model
A stochastic frontier approach (SFA), independently developed by Aigner, Lovell, and Schmidt (1977) and Meeusen and van den Broeck (1977), pre-specifies a functional form for estimation and decomposes the error term into random error ( ) and inefficiency ( ). SFA has been criticized for using a predetermined frontier functional form and pre-assumed distribution of the random error and inefficiency. However, the separation of a random error from inefficiency improves the accuracy of estimated technical efficiency. Efficiency studies employing SFA frequently adopt a two-stage estimation procedure. The first stage specifies and estimates a stochastic frontier to estimate inefficiencies for individual firms, assuming these inefficiencies are distributed identically. The second stage regresses these predicted inefficiencies on a set of firm specific characteristics attempting to explain differences in estimated efficiency. This two-stage procedure suffers from serious econometric problems, due to its contradictory assumptions on the independence of the inefficiency effects in the two stages (Kumbhakar and Lovell, 2000).
i
v ui
The awareness of the contradiction has promoted the development of the single-stage approach in which the potential relationship between the firm specific variables and technical efficiency is imposed in a single-stage procedure to estimate the production technology and firm efficiencies (Kumbhakar et al., 1991; Reifschneider and Stevenson, 1991; Huang and Liu, 1994; and Battese and Coelli, 1995). With extensive Monte Carlo evidence, Wang and Schmidt (2002) strongly recommend the one-stage models.
This study adopts a one-step model proposed by Battese and Coelli (1995). It assumes that non-negative technical inefficiencies are a function of firm-specific and environmental variables, and independently distributed as truncations of normal distribution with a constant variance, but with means that are a linear function of observable variables. The model is a more generalized model than other one-step model by encompassing other efficiency estimation models as special cases.
The distance function approach is a recently developed technique in efficiency study and it has been increasingly applied to efficiency study with the recognition of its potential advantages. A distance function approach has a number of prominent virtues (Cuesta and Orea, 2002; Coelli and Perelman, 2000; Fare et al., 1993; and Grosskopf et al., 1995). A major advantage is that a distance function represents multiple-outputs and multi-inputs production technology, which facilitates efficiency study for industries employing such technology without input price information and behavioural assumption. When price information is unavailable or inaccurately measured and/or when behaviour assumptions of cost-minimization or profit-maximization are inappropriate or unrealistic, traditional dual approach to accounting for multi-outputs production technology, such as cost and profit functions, are inapplicable. In this regard, a distance function approach can be used as an applicable alternative to the dual approach for the multi-outputs production technology. A distance function can be defined in terms of radial input conservation or output expansion. This multi-dimensional technological relationship can be represented by the technology set, which is a list of the technologically feasible combinations of inputs and outputs. If the vector of M inputs is denoted by x=(x1,x2,...,xM)and the vector of N
outputs is denoted byy=(y1,y2,...,yN), the technology set can be defined by equation (1).
T={(x,y):x∈ℜ+N,y∈ℜ+M, x canproducey} (1) For each input vector x, let P(x) be the set of feasible output vectors y, that are obtainable from the input vector x in equation (2).
} : { ) (x y x can produce y P = ∈ℜM+ (2)
It is assumed that the technology satisfies the standard axioms, such as convexity, weak disposability, as listed in Fare and Primont (1995).
The output distance function is first introduced by Shephard in 1970. Based on common definition of production technology that transforms inputs into outputs, the output distance function is defined in terms of the output set P(x), by equation (3).
where θ is the scalar ‘distance’ by which the output vector can be deflated.
The value of will be less than or equal to one if the output vector, y, is an element of the feasible production set of P(x).
) , (y x DO
A translog function is selected for empirical representation of the output distance function, which is given in equation (4) for I firms producing M outputs using K inputs,
∑
∑∑
∑
= = = = + + + = M m mi M M mn mi ni K k ki Oi y y y x D 0 ln ln ln 2 1 ln ln α α α β m1 m1n1 k 1∑∑
∑∑
= = = = + + K k M m mi ki km K k K l li ki kllnx lnx lnx lny 2 1 β γ 1 1 1 1 = m 1 n=1 m=1 nm mn i=1,2,…,N (4)where “O” indicates an output-oriented distance function and i denotes the ith firm in the sample.
An output distance function must satisfy certain regularity restrictions, including homogeneity of degree one in outputs
∑
M αm =1, and∑
= = , andM
mn 0 (m 1,2,...,M)
α
∑
M γkm =0 (k =1,2,...,K)and restriction on symmetry
), ,..., 2 , 1 , (m n= M =α α and βkl =βlk (k,l=1,2,...,K).
Following Lovell et al (1994), homogeneity constraint can be imposed by normalizing the output distance function by one of the outputs. The homogeneity property implies that
) , ( ) , (x y D x y
DO ω =ω O for any ω>0and it can be satisfied by output normalizations using
an arbitrary output in the empirical practice. If the Mth output is chosen for normalization and ωis set at1/yM, then we haveDO(x,y/yM)=DO(x,y)/yM. In particular, equation (4) becomes:
∑
− +∑∑
− − +∑
+ = 1 * 1 1 * * 0 ln ln ln 2 1 ln / ln M M M K ki k ni mi mn mi m Mi Oi y y y y x D α α α β =1 =1 =1 =1 m m n k
∑∑
∑∑
= − = = = + + K k M m mi ki km K k K l li ki kl x x x y 1 1 1 * 1 1 ln ln ln ln 2 1 β γ i=1,2,…,N (5) where ymi* = ymi/yM, yni* = yni/yM.Rearranging equation (5) by moving the distance term ‘ ’ to the right-hand-side of the equation and reinterpret it as a traditional SFA disturbance term with a noise ( ) and technical inefficiency ( ), the distance function in equation (5) becomes:
Oi D ln i v i u
∑
−∑∑
∑
= − = − = = + + + = − 1 * 1 1 * * 0 ln ln ln 2 1 ln ln M m M m M n K k ki k ni mi mn mi m Mi y y y x y α α α β 1 1 1 1 i i K M mi ki km K K li ki kl x x + x y +v −u +∑∑
∑∑
−1 * ln ln ln ln 2 1 β γ k m k=1 l=1 =1 =1 i=1,2,…,N (6)For the estimation purpose, the left hand side of equation (6) is transformed to be rather than and it becomes a standard SFA model.
1
lny 1
lny −
Simultaneous equation bias might exist when both inputs and outputs in the distance function appear as regressors. Coelli and Perelman (1996) argue that the normalization procedure for imposing homogeneity of degree one in outputs by one of the outputs results in the fact that the output ratios appear in the model rather than output variables. These output ratios may be assumed to be exogenous since the output distance function is defined for radial expansion of all outputs, given the input levels.
Morrison Paul et al. (2000) present a complex but general and rich model for the representation of production technique and estimation of efficiency by embedding a distance function into a SFA framework. This paper borrows the idea and develops a richer empirical model to provide more reliable efficiency estimates and possible determinants. Our model expands and enriches Morison Paul et al. (2000) model by incorporating Berger et al. (2005) method in a one-stage estimation procedure. Such a model inherits all statistical and practical virtues of a stochastic frontier approach, a distance function approach, one-stage procedure, and Berger et al. (2005) method. In addition, the inefficiency effects model also simultaneously examines the effects of bank specific risk taking characteristics and macroeconomic conditions.
4. Data and empirical models
In this paper, Chinese commercial banks are classified into four groups: state-owned commercial banks (SOCBs), joint-equity commercial banks (JECBs), city commercial banks (CCBs), and foreign banks (FBs). The sample contains 310 observations and covers all major commercial banks in China, accounting for more than 85% of total banking assets and activities. Time period spans eleven years from 1995 to 2005 in which the banking industry experienced significant corporate governance changes. Data are collected mainly from monthly updated Thompson’s BankScope database and the latest issue of the database used in this study is up to the end of 2006. Other sources include Almanac of China’s Finance and Banking (1986-2005), China Statistical Yearbook, and websites of central bank, CBRC, and individual banks. The quality of data in China is often questioned, while data have been collected from multiple sources and have been carefully cross checked to ensure data quality and hence improve the reliability of research findings.
The commonly used intermediation approach (Sealey and Lindley, 1977) is adopted, which views banks as using labour, physical capital, and funds to produce earning assets. The treatment of deposits has long been a controversial issue. This paper adopts a dual approach that treats the stock value of deposits as an output while treats the costs of deposits as input like in Bauer et al. (1993), Humphrey and Pulley (1997) and Chen et al. (2005).
Empirical studies show that efficiency estimates can be sensitive to the specification of inputs and outputs and therefore this paper specifies three different combinations of inputs and outputs. Particularly, Model 1 is income-based specification which defines two inputs: total interest expense ( ) and non-interest expense ( ), and two outputs: net interest income ( ) and non-interest income ( ) (Sturm and Williams, 2004; Park and Weber, 2006). Models 2 and 3 are earning assets-based specification. Model 2 specifies two inputs, total interest expense ( ) and labour and physical capital ( ), and three outputs, total loans ( ), total deposits ( ) and non-interest income ( ) (Rogers, 1998; Park and Weber, 2006). Non-interest income is defined as an additional output to capture the effect of increasingly important diversification of bank activities. Model 3 specifies three inputs,
1 x x2 1 y y2 1 x x3 3 y y4 y2
1
x x4 x5
3
y y4 y5
The summary statistics of related variables and ratios are presented in Table 1. Foreign banks have shown very different characteristics from domestic banks. They are the most profitable banks in terms of ROA at 12.27%, and the most cost efficient banks in terms of overhead to total assets ratio of 0.91%. All risk taking indicators are the highest, reflecting low capital risk, low credit risk, high dependence on wholesales market, and high liquidity risk.
total interest expense ( ), physical capital ( ), and labour ( ), and three outputs, total loans ( ), total deposit ( ) and other earning assets ( ).
Equation (7) is the empirical specification of an output distance function in Translog form.
∑∑
∑
∑∑
∑
= = − = − = − = = + + + + = K k K l ki li kl M m M m M n K k ki k ni mi mn mi m Mi y y y x x x y 1 1 1 1 1 1 1 1 1 * * * 0 ln ln 2 1 ln ln ln 2 1 ln ln α α α β β i i M m K k ki ki mi mi K k M m mi ki km x y + t y + t x +t+v −u +∑ ∑
∑
−∑
= = = − = 1 1 1 * 1 1 1 * ln ln ln ln α β γ * ywhere are outputs normalized by net-interest income for Model 1 and total loans for Models 2 and 3;
i=1,2,…,N (7)
Table 1 Mean value of sample banks by governance type, 1995-2005, in million RMB CCBs_ ALL CCBs_ NO FBs_ ALL JECBs ALL JECBs NO SOCBs All SOCBs NO
Listed banks Selection foreign
Selection listing
Outputs and Inputs and other financial figures
Loans* 19 11 1 115 113 1,676 1,501 322 494 757
Other earning assets* 17 9 1 77 73 1,007 656 208 325 495
Deposits* 30 16 1 147 149 2,231 1,795 438 673 1,030
Net interest income 575 306 51 3,163 2,616 42,473 36,853 9,770 12,809 19,658 Other operating income 376 217 35 1,570 1,502 18,662 9,200 4,385 6,391 9,697 Fixed assets 469 402 31 2,684 2,677 52,024 49,064 10,466 14,493 22,396 Overhead 387 222 16 2,219 2,035 30,694 32,415 6,692 8,758 13,413 Interest expense 781 432 71 3,719 4,191 106,420 56,744 11,569 32,283 49,724 Non-interest expense 414 239 21 2,374 2,160 35,034 36,830 7,339 9,906 15,192 ROA 1.65 1.78 12.27 1.36 0.94 0.57 0.29 1.29 1.20 1.07 Cost efficiency 1.14 1.11 0.91 1.20 1.16 1.13 1.48 1.24 1.19 1.12 Total assets* 39 22 2 200 200 2,886 2,335 555 874 1,336
Risk taking indicators
LLR/total loans 1.29 1.26 2.33 2.24 1.24 1.53 0.91 2.31 1.99 2.06 Interbank fund/deposits 87.94 80.87 268.53 38.76 37.88 52.57 40.00 27.12 57.51 39.11 Loans/deposits 70.32 72.48 131.94 79.74 76.96 81.42 97.20 80.61 76.79 77.97
Source: BankScope and authors’ calculation.
Notes: (1) ROA = return on assets; LLR = loan loss reserve; Cost efficiency = overhead over total assets. Loans, other earning assets, deposits and total assets are presented in RMB billion. CCBs = city commercial banks, FB = foreign banks, JECB = joint-equity commercial banks, SOCB = state-owned banks, NO = no governance changes, ALL = all banks in the group, Selection foreign = selection with foreign acquisition, Selection listing = selection with listed banks. (2) Variables with a negative or zero value have been added by a constant that equals the absolute value of the minimum values plus one in order to avoid taking natural logarithm on zero or negative observations. All monetary variables have been deflated to 1995 price level and input and output variables have been mean-corrected by their geographic mean.
All types of banks with no governance change are less profitable on average, except for CCBs. This may be the reflection that better performing banks have been picked up for governance changes or banks have performed better after governance changes, or both. CCBs and JECBs with no governance changes are more cost efficient than their group average, implying that governance changes generally involve excessive costs at least in the short run but its downside effects have been offset fully by improved profitability. SOCBs with no governance changes are shown to be less profitable and less cost efficient than the group average. Governance changes in SOCBs not only have improved profitability but also cost efficiency.
The inefficiency effects model of one-step Battese and Coelli (1995) model shown in equation (8) particularly examines the impact on bank performance of risk taking characteristics, corporate governance changes in certain macroeconomic environment.
b it it (8) b it a a it CG Risk GDP t u =
δ
+∑
δ
+∑
δ
+δ
+δ
+ε
= = 15 16 14 11 10 1 0where t is a time trend variable; is a vector of governance indicators; is a vector of risk taking indicators; GDP is GDP index.
it
CG Riskit
Risk taking characteristics are represented by a set of financial ratios. In particular, E/A ratio controls for capital risk, loan loss reserve to total loans ratio for credit risk, interbank borrowing to total deposits ratio for market risk, and total loans to total deposits ratio for liquidity risk.
E/A ratio presents capital risk and the higher the E/A ratio, the lower the capital risk. It should be analyzed in conjunction with the budget constraints argument. Credit risk indicator, LLR/Total Loans ratio, measures how much banks provide for unanticipated losses from loan default. It reflects banks’ financial strength since loan loss reserve is used as a cushion against possible future loan defaults. Banks with higher LLR/Total Loans ratio are exposed to lower level of credit risk, and thus are expected to be more efficient. The ratio of interbank borrowing to total deposit for each bank measures the extent to which a bank specialises in wholesale rather than retail operations. GDP growth is included as a proxy for general macroeconomic environment in which banks
operate. A time trend variable is also included to capture common effect on efficiency, i.e. technical change and policy change.
A set of governance changes indicators is used to capture the effect of intensified contemporary banking reform in China. Berger et al. (2005) highlight the importance to analyze static, selection, and dynamic effects on the performance of different groups of banks in the same model. Static governance indicators are used to capture the effect of maintaining certain types of governance structure over the long term, while selection effect indicators reflect the performance of banks being selected for governance changes. Dynamic governance indicators explore short-run and long-run effects of different types of governance changes by comparing bank performance before governance changes with their subsequent performance after changes. The present study specifies five static indicators, two selection indicators, two short-run and two long-run dynamic indicators. These governance indicators are defined as dummy variables and details are presented in Table 2.
Static indicators, CCBs-No Governance Change, JECBs-No Governance Change, SOCBs-No Governance Change, FBs-No Governance Change, represent banks that underwent no governance changes, and Listed Bank shows whether a bank has been listed on a stock exchange. For all periods, these dummy variables equal 1 for such a bank and 0 for all other banks. As shown in Table 2, the share of banks without governance changes is 64% of CCBs, 18% of JECBs and 25% of SOCBs in terms of the number of banks and 34% of CCBs, 18% of JECBs and 20% of SOCBs in terms of total assets. In aggregate, 59% of domestic banks controlling 80% of the total assets have experienced governance changes. As to the listing status, only 7 out of 35 banks are listed on stock exchanges, accounting for 27% of the total banking assets. The first static indicator, CCBs-no governance change, is excluded in the estimation as the base case for comparison purpose like in Berger et al. (2005) and Williams and Nguyen (2005).
The selection indicators, Selected for Foreign Acquisition and Selected for Going Public, represent banks being selected for foreign acquisitions or IPO. Dummies equal 1 for all periods for such a bank and 0 for all other banks. In the case of banks experiencing both foreign acquisition and going public, both are accounted separately. As shown in Table 2, 14 out of 35 banks have been selected for foreign acquisitions,
the end of 2006 in order to take account of three large IPOs of SOCBs, BOC and ICBC. Nine domestic banks have been selected for IPOs, controlling 75% of the total bank assets in China.
Short-term dynamic indicators, Foreign Acquisition-ST and Going Public-ST, measure the timing following governance changes. The dummy equals 0 prior to governance change and 1 starting from the change. Long-term dynamic indicators, Foreign Acquisition-LT and Going Public-LT, measure the number of years following a governance changes. Long-term dynamic variables equal 0 prior to governance change for all banks and 1 after the change. It is important to distinguish long-term and short-term effects since transition costs may last more than one year and/or banks may return back to their previous steady state a few years after governance change.
Table 2: Corporate governance indicators
Governance Definition of dummy variables Bank No. TA
Static Governance Indicators % %
CCBs without Governance change
1 without governance change and 0 otherwise 9 (14) 64 34
JSCBs without Governance change
1 without governance change and 0 otherwise 2 (11) 18 18
SOCBs without Governance change
1 without governance change and 0 otherwise 1 (4) 25 20
FBs without
Governance change
1 without governance change and 0 otherwise 6 (6)
Listed Banks 1 for listed banks and 0 otherwise 7(35) 20 27
Selection Governance Indicators
Selection for Foreign acquisition
1 with at least one foreign acquisition during 1995-2005 except 2004, 0 otherwise
14 (35)
40 77
Selection for Going public
1 with IPO except BOC and ICBC, 0 otherwise
9 (35) 26 75
Dynamic Governance Indicators--ST
Foreign acquisition 1 after foreign acquisition, 0 before acquisition and all other banks
Dynamic Governance Indicators--LT
Foreign acquisition Number of years since foreign acquisition, 0 before acquisition and other banks
Going public Number of years since foreign acquisition, 0 before acquisition and other banks
Notes: * Figures in parentheses are the total number of respective types of banks or total banks in the sample.
* TA: total assets.
5. Empirical results
5.1 Results of stochastic frontier model
Maximum-likelihood (ML) estimates of parameters are reported in Table 3. Results from different model specifications are generally consistent with each other. The signs of estimates in all three models are as expected and highly significant at 1% level. The estimated parameter γ (γ =σu2/
(
σu2 +σv2)
) is more than 0.82 and significant at the 1% level. The LR test of a one-sided error is greater than 160, showing the existence of a one-sided error within the composite error term. The positive coefficient on the time trend indicates that the production frontier moved upward. In balance, the results are well estimated and imply good fitness of the output distance function. Due to similar results from the earning assets-based Models 2 and 3, only Model 2 is further analyzed along with Model 1.Following Fare and Primont (1995) and Coelli and Perelman (1999), the scale elasticity
is given by . The negative sum of the
first-order input coefficients in the output distance function estimation indicates the return to scale in the production process. The scale elasticities are less than one in all three models, suggesting decreasing return to scale at the mean of the Chinese banking industry.
∑
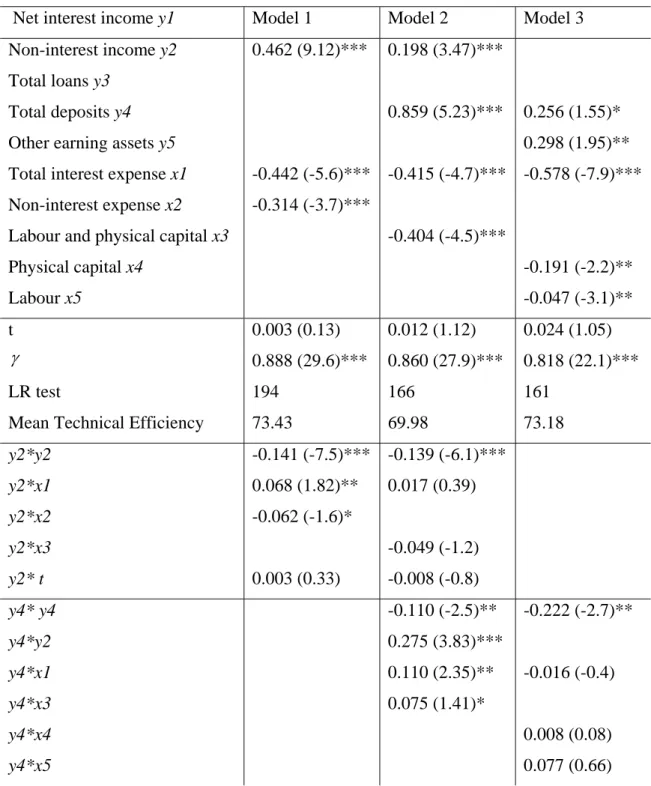
= ∂ ∂ − = M k k it it it D y x x EE 1 0( , )/ ln lnTable 3 Estimated parameters for stochastic output distance function
Net interest income y1 Model 1 Model 2 Model 3
Non-interest income y2 0.462 (9.12)*** 0.198 (3.47)*** Total loans y3
Total deposits y4 0.859 (5.23)*** 0.256 (1.55)*
Other earning assets y5 0.298 (1.95)**
Total interest expense x1 -0.442 (-5.6)*** -0.415 (-4.7)*** -0.578 (-7.9)***
Non-interest expense x2 -0.314 (-3.7)***
Labour and physical capital x3 -0.404 (-4.5)***
Physical capital x4 -0.191 (-2.2)**
Labour x5 -0.047 (-3.1)**
t 0.003 (0.13) 0.012 (1.12) 0.024 (1.05)
γ 0.888 (29.6)*** 0.860 (27.9)*** 0.818 (22.1)***
LR test 194 166 161
Mean Technical Efficiency 73.43 69.98 73.18
y2*y2 -0.141 (-7.5)*** -0.139 (-6.1)*** y2*x1 0.068 (1.82)** 0.017 (0.39) y2*x2 -0.062 (-1.6)* y2*x3 -0.049 (-1.2) y2* t 0.003 (0.33) -0.008 (-0.8) y4* y4 -0.110 (-2.5)** -0.222 (-2.7)** y4*y2 0.275 (3.83)*** y4*x1 0.110 (2.35)** -0.016 (-0.4) y4*x3 0.075 (1.41)* y4*x4 0.008 (0.08)
y4*t 0.046 (2.55)** -0.019 (-0.8) y5*y5 -0.141 (-2.2)** y5*y4 0.377 (3.56)*** y5*x1 0.095 (2.02)** y5*x4 0.136 (1.98)** y5*x5 -0.301 (-4.2)*** y5*t 0.026 (1.22) x1*x1 0.144 (0.71) 0.053 (1.79)* -0.023 (-0.8) x1*x2 0.002 (-0.04) x1*t -0.019 (-1.8)* -0.004 (-0.3) -0.025 (-2.3)** x2*x2 0.019 (0.81) x2*t 0.030 (265)** x3*x3 0.050 (1.91)** x3*x1 -0.090 (-1.7)* x3*t 0.013 (1.01) x4*x4 0.058 (1.49)* x4*x1 0.063 (1.16) x4*x5 -0.180 (-2.5)** x4*t -0.002 (-0.4) x5*x5 0.097 (2.21)** x5*x1 -0.013 (-0.2) x5*t 0.043 (2.33)**
Notes: Figures in parenthesis are t-values. ‘***’ signifies significance at 1%, ‘**’ at 5% and ‘*’ at 10% levels.
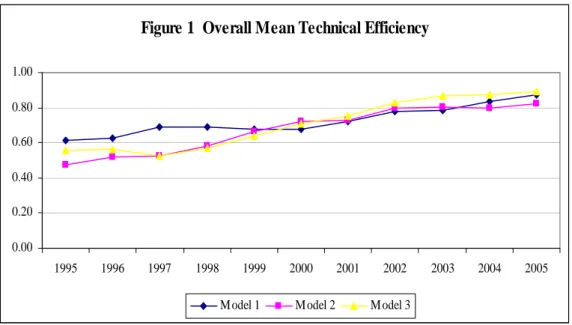
Bank efficiency has improved steadily over the sample period (Figure 1). The average estimated technical efficiency is 70%. The most efficient banks are China Merchants Bank in Model 1, Bank of Communications in Model 2 and BOC in Model 3, with the estimated technical efficiency of 93%, 89% and 93% respectively. The most inefficient domestic bank is China Everbright Bank with an efficiency score of about 40%. Wide efficiency variations across banks indicate that there is significant potential for efficiency improvement in the Chinese banks.
Figure 1 Overall Mean Technical Efficiency
0.00 0.20 0.40 0.60 0.80 1.00 1995 1996 1997 1998 1999 2000 2001 2002 2003 2004 2005
M odel 1 M odel 2 M odel 3
The average estimated technical efficiencies of different bank groups are plotted in Figure 2a for income-based Model 1 and Figure 2b for earning assets-based Model 2. For both models, CCBs are the least efficient domestic banks except for the first four years. This is because only a small number of high performing CCBs are included. Strikingly, foreign banks are found to be less efficient than their domestic counterparts.
Figure 2a Mean Technical Efficiency M1
0.00 0.20 0.40 0.60 0.80 1.00 1995 1996 1997 1998 1999 2000 2001 2002 2003 2004 2005 CCBs FBs JSCBs SOCBs
Figure 2b Mean Technical Efficiency M2
0.00 0.20 0.40 0.60 0.80 1.00 1995 1996 1997 1998 1999 2000 2001 2002 2003 2004 2005 CCBs FBs JSCBs SOCBs
In Model 1, the efficiency level tends to increase and converge. JECBs are the most efficient group, consistent with the literature as well as general expectation. They have a number of advantages over other banks, such as less government intervention and no historical financial burden. Reported efficiency level of SOCBs is still low. Although it is not surprising, the results are not in line with the considerable reform efforts made by the government, such as stripping off NPLs, massive capital injection, and financial
restructuring. One possible reason is that it might take time to realize the full effects of those reforms. Another possible reason is that government influence on bank operation, such as lending decisions, still exists (Dobson and Kashyap, 2006).
In Model 2, the efficiency levels of domestic banks have moved in parallel, a steady improvement up to 1999 followed by a stable period. The most efficient bank group is SOCBs, a similar finding to Chen et al. (2005). It is in contrast to the main stream literature on the relationship between state ownership and efficiency.
The further exploration of the contradiction arising from two types of models shows important methodological implications. As previously defined, Model 1 focuses more on the efficiency of income generation (profitability) and Model 2 devotes more attention to the efficiency of earning assets production (earning assets growth). Two models measure the efficiency of bank operations from different angles and results should be interpreted with caution.
Earning assets are important for banks, whereas they are intermediate outputs and are ultimately for the purpose of income generation. Higher efficiency in earning assets growing is a sufficient condition, which does not necessarily result in higher efficiency in income generation. Efficiency estimates from the earning assets-based model could be inflated by the imprudent lending and investing activities. The poor quality of rapidly expanded earning assets could result in significant bank inefficiency when estimated by an income-based model. Without taking into account asset quality, undesirable outputs, such as non-performing loans, are inappropriately treated along with earning assets and therefore inflate the efficiency level. For example, JECBs are the most efficient bank group, which outperform SOCBs by 9% in the income-based model. However, SOCBs are identified to be the most efficient bank group and outperform JECBs by 6% in the earning assets-based model. These figures suggest that JECBs tend to be more prudent in extending loans and investing activities and more profit-oriented, while SOCBs focus more on traditional assets growing activities with less attention to assets quality and profitability.
Comparing Figure 2a and 2b, more valuable information can be found. For the first five years up to 1999, efficiency improvement is quicker in Model 2 than in Model 1, indicating that banks have focused more on earning assets growth rather than
2b, suggesting that banks become more profit conscientious instead of pursuing assets growth.
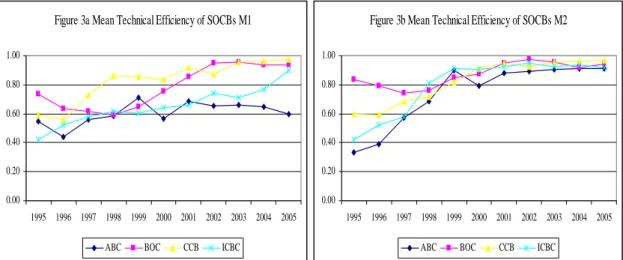
It emerges that the income-based model is superior to earning assets-based models as far as our sample banks are concerned, while the latter is complementary. Different estimates from two types of models may be taken as a weak indication of relative asset quality among banks. In China, a vast amount of accumulated NPLs in SOCBs is a major issue plaguing the authority. In effect, it remains unresolved despite being transferred to assets management companies. Due to insufficient NPL data, its effects on efficiency have not been properly controlled in this study. However, different model specifications partially reflect relative asset quality among different bank groups. The estimated efficiencies of individual SOCBs are plotted in Figure 3a for Model 1 and Figure 3b for Model 2. Efficiency levels have increased in general. BOC and CCB outperform the other two SOCBs. ABC is the least efficient bank in Model 1, while it is as efficient as other SOCBs in Model 2. Wide dispersion in Model 1 implies large differences in the efficiency of income generation among SOCBs. In Model 2, the efficiency gaps among SOCBs are close up to 1998 and the subsequent convergence in efficiency show small differences in the efficiency of earning assets. Comparing Figures 3a and 3b, once again, underscores the superiority of the income-based model over the earning assets-based model.
Figure 3a Mean Technical Efficiency of SOCBs M1
0.00 0.20 0.40 0.60 0.80 1.00 1995 1996 1997 1998 1999 2000 2001 2002 2003 2004 2005 ABC BOC CCB ICBC
Figure 3b Mean Technical Efficiency of SOCBs M2
0.00 0.20 0.40 0.60 0.80 1.00 1995 1996 1997 1998 1999 2000 2001 2002 2003 2004 2005 ABC BOC CCB ICBC
5.2 Results of technical inefficiency effects model
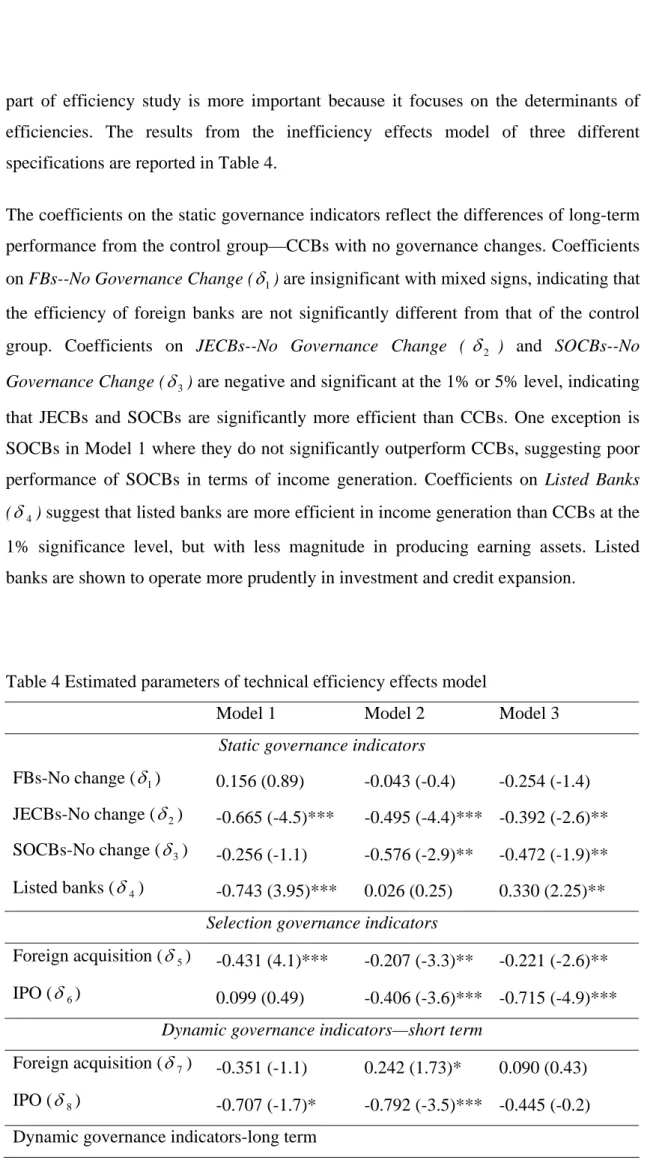
part of efficiency study is more important because it focuses on the determinants of efficiencies. The results from the inefficiency effects model of three different specifications are reported in Table 4.
The coefficients on the static governance indicators reflect the differences of long-term performance from the control group—CCBs with no governance changes. Coefficients on FBs--No Governance Change (δ1) are insignificant with mixed signs, indicating that the efficiency of foreign banks are not significantly different from that of the control group. Coefficients on JECBs--No Governance Change ( δ2 ) and SOCBs--No Governance Change (δ3) are negative and significant at the 1% or 5% level, indicating that JECBs and SOCBs are significantly more efficient than CCBs. One exception is SOCBs in Model 1 where they do not significantly outperform CCBs, suggesting poor performance of SOCBs in terms of income generation. Coefficients on Listed Banks (δ4) suggest that listed banks are more efficient in income generation than CCBs at the 1% significance level, but with less magnitude in producing earning assets. Listed banks are shown to operate more prudently in investment and credit expansion.
Table 4 Estimated parameters of technical efficiency effects model
Model 1 Model 2 Model 3
Static governance indicators
FBs-No change (δ1) 0.156 (0.89) -0.043 (-0.4) -0.254 (-1.4) JECBs-No change (δ2) -0.665 (-4.5)*** -0.495 (-4.4)*** -0.392 (-2.6)** SOCBs-No change (δ3) -0.256 (-1.1) -0.576 (-2.9)** -0.472 (-1.9)** Listed banks (δ4) -0.743 (3.95)*** 0.026 (0.25) 0.330 (2.25)**
Selection governance indicators
Foreign acquisition (δ5) -0.431 (4.1)*** -0.207 (-3.3)** -0.221 (-2.6)**
IPO (δ6) 0.099 (0.49) -0.406 (-3.6)*** -0.715 (-4.9)***
Dynamic governance indicators—short term
Foreign acquisition (δ7) -0.351 (-1.1) 0.242 (1.73)* 0.090 (0.43)
Foreign acquisition (δ9) -0.079 (-1.1) -0.220 (-7.7)*** -0.156 (-3.8)***
IPO (δ10) 0.064 (0.52) -0.039 (-0.32) 0.003 (0.01)
Risk taking indicators
Equity/asset (δ11) -0.287 (-3.86)*** 0.004 (0.07) 0.083 (1.19) LLR/loans (δ12) -0.050 (-1.4)* -0.023 (-0.9) -0.061 (-1.7)* Interbank fund/deposits(δ13) 0.088 (2.17)** 0.173 (5.83)*** 0.237 (4.67)*** Loans/deposits (δ14) 0.099 (1.25) 0.596 (4.32)*** 0.099 (0.68) Time (δ15) -0.096 (-5.4)*** -0.124 (-6.5)*** -0.106 (-4.8)*** GDP (δ16) -0.219 (-0.6) -0.077 (-0.4) -0.058 (-1.9)**
Notes: This table reports only the results related to governance changes and banks’ risk taking behaviour. FB=foreign banks, ‘No change’=no governance change, JECB=joint-equity commercial banks, SOCB=state-owned commercial banks, or the Big Four, IPO=initial public offering, assets=total bank assets, loans=total bank loans, LLR=loan loss reserve.
The coefficients on Foreign Acquisition (δ5) are negative and significant at 1% or 5%
level, suggesting that foreign acquisition can improve bank efficiency. An alternative explanation is that foreign investors may have cherry-picked good domestic banks to invest. Examining the same coefficient from different models, it appears that foreign acquisition is more income-generating efficient than asset growth efficient. The estimated coefficients on IPO(δ6) show that IPO has little effect on income efficiency
but has a significant and positive effect on asset growth. The Chinese government has focused on restructuring SOCBs to have them listed in the stock markets, but our results show that SOCBs have improved their asset value more than their profits in the restructuring process.
The estimated coefficients on Foreign Acquisition-ST (δ7) and Foreign Acquisition-LT (δ9 ) show that foreign acquisition has led to efficiency improvement but not statistically significant. This is because foreign acquisition peaked in 2005, the final year of our sample and therefore the major effects have not been reflected. In the earning-assets models, the estimated coefficients show a negative short-term impact of
losses may result from more prudent investing and lending activities after foreign acquisition. In the long term, foreign ownership participation tends to have a significant impact on efficiency. This result has important policy implications, since encouraging foreign participation in domestic banks is an important element of the Chinese bank reform strategy.
IPO-ST (δ8) and IPO-LT (δ10) quantify the dynamic effects of the going public strategy. In Model 1, the estimated coefficients on δ8 and δ10 imply that IPO is associated with significant efficiency gains in the short run. However, this gain cannot be sustained in the long run. For the earning-assets models, results also show unfavourable long-term effects of IPO. One possible reason is that operational and managerial weaknesses may be covered up in order to be listed in the stock market, resulting in short-term gains. After listing, if banks take no effective measures to thoroughly overcome these weaknesses, short term gains are unsustainable in the long run.
IPO is another major element of China’s bank reform strategy. Domestic banks, especially SOCBs, are encouraged to be listed in the stock markets. The strategy is based on the belief that IPO could impose market pressure on SOCBs to direct management’s attention away from its traditional goal of growing assets and market share to profitability and long-term viability. Our results suggest that IPO by itself is not sufficient to result in better performance. Without significant improvement in the quality of management team, managerial capability and skills, without fundamentally changing away from management traditions of being an assistant of government, IPO would have no effect on improving efficiency. However, given three significant IPOs, CCB, BOC and ICBC in 2005 and 2006, it may be too early to look for strong evidence of efficiency improvement.
In Model 1, a negative coefficient of the E/A ratio suggests that banks subject to hard budget constraints are more efficient. It confirms our hypothesis that a soft budget is a source of inefficiency because it causes a moral hazard problem. If banks are subject to a hard budget constraint, they have to raise capital from shareholders and hence they need to be more efficient to attract more capital. In earning assets-based models, E/A ratio is found to have a negative effect on efficiency. Results from different models are
income generation but more efficient in earning assets. However, it provides further evidence that a soft budget constraint is associated with moral hazards, leading to a quick expansion in earning assets but low efficiency in income generation. Again, it provides evidence for the superiority of an income-based model over an earning assets-based model, especially in a situation where assets quality is poor.
LLR/Total Loans (δ12) ratio is found to have a negative impact on inefficiency in all models, suggesting banks taking less credit risk are more efficient. Interbank fund/Deposits (δ13) and Total Loans/Deposits (δ14) are found to have a positive impact
on inefficiency and most are statistically significant. The results show that banks are less efficient if they depend more on borrowing from the wholesale market than collecting deposits from the retail market. A negative coefficient on the time trend in the inefficiency effect model means that inefficiencies tended to decrease by 5% per year. The negative sign of the coefficient on GDP growth suggests that favourable macroeconomic condition of an economy has a positive impact on bank performance.
6. Conclusion
This paper examines technical efficiency and the impact of corporate governance and risk-taking behaviour on bank performance in China during 1995-2005. The estimated average efficiency is 70%, suggesting a large potential for efficiency improvement. After many years of reforms, SOCBs still dominate the banking industry and their efficiency levels are still low compared with JECBs despite significant improvement in the past three years.
Our data provide adequate information for constructing a stochastic output distance function to examine the static, selection and dynamic effects of corporate governance changes and risk-taking behaviour on bank efficiency. JECBs are found to be the most efficient group, while foreign banks are the least efficient (static effects). The selection effect indicators provide an economic justification for the opening up policy. Associated with a significant cherry-picking effect (selection effects), foreign participation in domestic banks can improve efficiency in the long run (dynamic effect). A cherry-picking effect is also found in the Chinese banks which had undergone an IPO to gain more assets. Banks with IPO have realized efficiency gains in the short term, but such gains may not be sustained in the long run. This has serious policy
does not necessarily result in efficiency gain. The underlying reasons need to be carefully investigated and this reform strategy should be re-considered more carefully with a focus on fundamental changes. Moreover, banks subject to a hard budget tend to be more prudential in risk taking and therefore more efficient than those subject to a soft budget, implying that there is scope for improving efficiency of the Big Four through a harder budgetary discipline, which has been conducted through IPO over the last two years for CCB, BOC and ICBC.
This paper has also contributed to the literature with methodological concerns. It has found that an income-based model is superior to an assets-earning model, especially when assets quality is poor. It has implications on the choice of models when studying bank efficiency, especially in countries like China. Our suggestion is that both models should be used since the investigation from different models could yield more valuable information in order to have an objective and accurate judgement on bank performance. During the past few years, the Chinese government has speeded up bank reform by allowing foreign investment and SOCBs to be listed in the stock markets. The market reaction to the listing of CCB, BOC and ICBC has been surprisingly positive and the share prices of these banks are now much higher than their IPO prices. One critical question is whether the bullish market is driven by the fundamental changes in these banks, or by a positive expectation on China’s economic growth, or by pure speculation. The results in this paper show that IPO can have a short term positive effect but such an effect can fade in the long term. This implies that the future of SOCBs depends on their own ability to improve efficiency and profitability and IPO is at best the first step to improve such ability.
The success of bank reform also depends on whether banks can be essentially freed from government intervention. Government intervention in lending decision still persists but less explicitly. It is uncertain whether this implicit intervention could be reversed in the near future.
References
Aigner, D., Lovell, C.A.K. and Schmidt, P., 1977. Formulation and estimation of stochastic frontier production models. Journal of Econometrics 6, 21-37.
Battese, G.E., Coelli, T.J., 1995. A model for technical inefficiency effects in a stochastic frontier production function for panel date. Empirical Economics 120, 325-332.
Bauer, P.W., Berger, A.N., Humphrey, D.B., 1993. Efficiency and productive growth in US banking, in: Fried, H. O., Lovell, C. A. K., Schmidt, S. S. (Eds), The Measurement of Productive Efficiency: Techniques and Applications, Oxford University Press, New York, pp. 386-413.
Berger, A.N., Clarke, G.R.G., Cull, R., Klapper, L., Udell, G.F., 2005. Corporate governance and bank performance: a joint analysis of the static, selection, and dynamic effects of domestic, foreign, and state ownership. Journal of Banking and Finance 29, 2179-2221.
Berger, A.N., Hasan, I., Zhou, M., 2006. Bank ownership and efficiency in China: what will happen in the world’s largest nation? Wharton Financial Institutions Centre Working Paper 2007, 03.
Berger, A.N., Humphrey, D.B., 1997. Efficiency of financial institutions: international survey and directions for future research. European Journal of Operational Research 98(2), 175-212.
Bonin, J.P., Hasan, I., Wachtel, P., 2005a. Bank performance, efficiency and ownership in transition countries. Journal of Banking and Finance 29, 31-53.
Bonin, J.P., Hasan, I., Wachtel, P., 2005b. Privatization matters: bank efficiency in transition countries. Journal of Banking and Finance 29, 2155-2178.
Chen, X., Skuly, M., Brown, K., 2005. Banking efficiency in China: application of DEA to pre-and post-deregulation eras: 1993-2000. China Economic Review 16, 229-245.
Coelli, T.,Perelman, S., 1996. Efficiency measurement, multi-output technologies and distance functions: with application to European railways. CREPP Working Paper 96, 05, University of Liege.
Coelli, T., Perelman, S., 1999. A comparison of parametric and non-parametric distance functions: with application to European railways. European Journal of Operational Research 117, 326-339.
Coelli, T., Perelman, S., 2000. Technical efficiency of European railways: a distance function approach. Applied Economics 32, 1967-1976.
Cuesta, R.A., Orea L., 2002. Mergers and technical efficiency in Spanish savings banks: a stochastic distance function approach. Journal of Banking and Finance 26, 2231-2247. Dobson, W., Kashyap, A.K., 2006. The contradiction in China’s gradualist banking reforms. Working Paper, Graduate School of Business, University of Chicago.
Fare, R., Grosskopf, S., Lovell, C.A.K., Yaisawarng S., 1993. Derivation of shadow prices for undesirable outputs: a distance function approach. The Review of Economics and Statistics 75, 374-380.
Fare, R., Primont, D., 1995. Multi-output Production and Duality: Theory and Applications, Kluwer Academic Publisher, Boston.
Fries, S., Taci, A. 2005. Cost efficiency of banks in transition: evidence from 289 banks in 15 post-communist countries. Journal of Banking and Finance 29, 55-81.
Fu, X., Heffernan, S., 2005. Cost X-efficiency in China’s Banking Sector. Working Paper, Cass Business School, City University, London.
Gilbert, R.A., Wilson, P.W., 1998. Effects of deregulation on the productivity of Korean banks. Journal of Economic and Business 50, 133-166.
Grosskopf, S., Margaritis D., Valdamis, V., 1995. Estimating output substitutability of hospital services. European Journal of Operational Research 80, 575-587.
Hasan, I., Marton, K., 2003. Development and efficiency of the banking sector in a transitional economy: Hungarian experience. Journal of Banking and Finance 27, 2249-2271.
Hu, J., Chen, C. and Su, Y., 2006. Ownership reform and efficiency of nationwide banks in China. Working Paper, Institute of Business and Management, National Chiao Tung University, Taiwan.
Huang, C.J., Liu J.T., 1994. Estimation of a non-neutral stochastic frontier production function. Journal of Productivity Analysis 5, 171-180.
Huibers, F.E., 2005. Initial public offerings, in: Caprio, G., Fiechter J.L. Litan, R., Pomerleano, M. (Eds), The Future of State-Owned Financial Institutions. Brookings Institution Press, Washington, D.C. pp. 315-344.
Humphrey, D.B., Pulley, L.B., 1997. Banks’ responses to deregulation: profits, technology, and efficiency. Journal of Money, Credit, and Banking 29, 73-93.
Katib, M.N., Mathews, K., 2000. A non-parametric approach to efficiency measurement in the Malaysian banking sector. The Singapore Economic Review 44, 89-114.
Kumbhakar, S.C., Ghosh, S., McGuckin, J.T., 1991. A generalized production frontier approach for estimating determinants of inefficiency in US dairy farms. Journal of Business and Economic Statistics 9, 279-286.
Kumbhakar S. C., Lovell C.A.K. 2000. Stochastic Frontier Analysis. Cambridge University Press.
Levine, R., 2004. The corporate governance of banks: a concise discussion of concepts and evidence. World Bank Policy Research Working Paper, 3404.
Lovell, C.A.K., Richardson, S., Travers, P., Wood, L.L., 1994. Resources and functioning: a new view of inequality in Australia, in: W. Eichhorn (Eds.), Models and Measurement of Welfare and Inequality, Berlin, Springer-Verlag.
Morrison Paul, C.J., Johnson, W.E., Frengley G.A.G., 2000. Efficiency in New Zealand sheep and beef farming: the impact of regulatory reform. The Review of Economics and Statistics 82, 325.
Meeusen, W., Broeck J. van den, 1977. Efficiency estimation from Cobb-Douglas production functions with composed error. International Economic Review 18, 435-444.
Park, K.H., Weber, W.L., 2006. A note on efficiency and productivity growth in the Korean banking industry, 1992-2002. Journal of Banking and Finance 30, 2371-2386. Reifschneider, D., Stevenson, R. 1991. Systematic departures from the frontier: a framework for the analysis of firm inefficiency. International Economics Review 32, 715-723.
Rogers, K.E., 1998. Non-traditional activities and the efficiency of US commercial banks. Journal of Banking and Finance 22, 467-482.
Sealey, C.W., Lindley, J.T., 1977. Inputs, outputs and a theory of production and cost at depository financial institutions. Journal of Finance 32, 1251-1266.
Shephard, R.W., 1970. Theory of Cost and Production Functions. Princeton University Press.
Sturm, J.E., Williams, B., 2004. Foreign bank entry, deregulation and bank efficiency: lessons from the Australian experience. Journal of Banking and Finance 28, 1775-1799. Tang, S., 2005. Review and outlook of China’s banking reforms. Speech at the Caijing Magazine leadership forum: world and China 2005.
Wang, W.K., Huang, H.C., Lai, M.C., 2005. Measuring the relative efficiency of commercial banks: a comparative study on different ownership modes in China. The Journal of American Academy of Business 7, 219-223.
Wang, H.J., Schmidt, P., 2002. One-step and two-step estimation of the effects of exogenous variables on technical efficiency levels. Journal of Productivity Analysis 18, 129-144.