Sharing Audience Data:
Strategic Participation in Behavioral Advertising Networks
Steven Schmeiser
*Mount Holyoke College
October 30, 2015
— working draft —
Abstract
I consider the incentives of special interest websites to participate in behavioral advertising networks. By participating in the network, the website gives valuable audience data to the network and allows the network to use that data to target the site’s audience on general interest websites – thus expanding the supply of impressions and decreasing average revenue per impression. I explore monopoly and duopoly settings and highlight the trade-off between sharing audience data and displaying higher value ads. In the duopoly setting, endogenous choice of networks can lead to surprising results such as the possibility of a site’s revenue decreasing as it increases the number of ad impressions per user (holding the num-ber of users constant). The model generates several empirical predictions about the choice of network technologies within and across advertising markets.
1 Introduction
Internet advertising is a large and growing market, with 2014 revenues of nearly $50 billion in the United States.1 Fine grained audience data and the ability to precisely target consumers sets online advertising
apart from traditional offline advertising. This paper examines the incentives of websites to share audience data with behavioral advertising networks – one of the primary sources of data used for targeting. Several studies (reviewed below) have examined the consequences of increased targeting ability for the advertising market, but have taken the general availability of targeting data as an exogenous technological progression. Here, I consider special interest websites that possess the audience data required for targeting and examine their choice of advertising networks and the decision of whether or not to make their data available for targeting on other websites.
In my model, multi-homing consumers visit special interest websites and general audience websites. A special interest site caters to a single advertising market (e.g., rock climbing, stock trading, cooking) and a visit to a special interest website identifies a consumer as a “match” that the advertiser would like to reach. A visit to a general audience site (e.g., The New York Times, CNN, Yahoo!) does not reveal any information that is useful for targeting ads – for a general audience site to target ads it need an external source of data. Advertiser demand for impressions is generated by a matching model that generalizes Butters (1977) to allow for a parameterized value of repeated impressions while retaining a simple and easy to interpret analytical form.
Rather than directly contract with advertisers, the websites use an advertising network that acts as an intermediary between the website and the advertiser. Here, websites choose between two types of advertis-ing networks – a contextual network and a behavioral network. The contextual network uses the site’s own content to target ads to the audience, while the behavioral network uses a consumer’s browsing history to build a profile of a consumer’s interests and uses that profile to target ads. If the special interest website joins the contextual network, the advertiser can only reach consumers on the special interest website, as no audience data is shared with general audience sites. If the special interest site joins the behavioral network, targeted ads may be shown on both the special interest site and the general audience site.
I first consider a monopoly special interest site. As a monopoly, the special interest site is the only source of targeting data in its market. The site faces a trade-off in choosing networks. By choosing the contextual network, the site prevents its audience data from being used to target its consumers on general interest sites and this keeps all impressions on the special interest site. If the special interest site chooses the behavioral network, they may be able to show higher value ads, but their audience data is used to target consumers on general audience sites. This increases the supply of impressions per user, which decreases the average value of an impression. The price decrease due to increased supply depends crucially on the value of repeated impressions.
In the duopoly setting, special interest sites face the same trade-offs as in the monopoly setting, as well as strategic concerns driven by consumers that visit both special interest sites. If one special interest site uses the contextual network, the other special interest site may leak its audience data to the behavioral network, negating the benefit of the contextual network. In a multi-site setting, a single site no longer has total control over its audience data. In equilibrium, identical special interest sites always choose the same network. When sites are not identical, there are equilibria in which the sites choose different networks. I find that sites are more likely to choose the behavioral network when the value of repeated impressions is high, when the amount of multi-homing between special interest sites is high, and when traffic (per consumer) on the special interest site is high relative to the general audience site.
There is a growing literature in economics that explores the unique characteristics of online advertis-ing, and the consequences of targeting in particular. Athey and Gans (2010) consider the consequences of increased targeting ability for the supply of advertising. They show that targeting allows genreal audi-ence sites to serve more advertisers. This increase in supply pushes down average prices and affects the returns to targeted advertisements. Athey et al. (2014) consider how multi-homing among consumers af-fects equilibrium advertising prices and the decisions of advertisers to show ads on multiple sites. In their model, tracking may be used to avoid showing the same ad to the same consumer multiple times. This type of tracking (impression tracking) is different from the tracking used to build profiles of consumer in-terests discussed here, although I do discuss impression tracking in the context of my model’s advertising matching technology. Bergemann and Bonatti (2011) construct a competitive equilibrium model of ad-vertising and explore the implications of increased targeting on equilibrium prices and revenues for media outlets. Chen and Stallert (2014) use a circular model of horizontal differentiation to explore the effects of behavioral advertising on publishers and advertisers. In their model, “behavioral advertising” is a form of targeted advertising in which different ads are shown to different consumers on the same site. They find that not all publishers benefit from the switch to behaviorally targeted advertising. These papers take the ability to target consumers as exogenously given and do not consider the origins of the data. Here, I endogenize the choice of websites to reveal their audience data to the “consumer data” market so that it may be used for targeting on other websites. Bergemann and Bonatti (2015) model data exchanges where this information is bought by advertisers and sold by data brokers, but do not consider the provenance of the data or the incentives of a website to reveal the data in the first place. Goldfarb and Tucker (2011), Johnson (2013), Tucker (2012), Zhang and Katona (2012) also investigate questions around targeting and online advertising.
The paper most closely related to mine is Ghosh et al. (2012). They explore the willingness of websites to share cookie information with each other and determine equilibrium prices under sharing and no-sharing arrangements. They find that in equilibrium, websites (special interest and general audience) always agree on whether or not to share cookie information. In my model, this translates to the special interest site always agreeing to join the behavioral network. In Ghosh et al. (2012), advertisers commit to buying a
certain fraction of a website’s traffic at a constant per-impression price. In my model, advertisers value and buy impressions on a per-impression basis. Additionally, I allow for repeated impressions to be valuable, and focus on the strategic interaction between same-market sites as they choose advertising technologies.
2 Behavioral Advertising Networks
It is common for websites to outsource advertising to a third-party advertising network. The website sets aside space on the page where the advertisement will appear and the advertising network contracts with advertisers and selects an advertisement to fill this space each time the page is visited. Typical contracts between the advertising network and website specify a revenue share in which the website receives a fixed proportion of the revenue the advertising network receives from the advertisements displayed on the web-site.
Advertisers are willing to pay more to display ads that are targeted to their desired audience. Advertising networks have adopted many different strategies to provide advertisers with audience information when matching viewers to ads. Contextual networks use the content of the website itself to provide this data. For example, if the website caters to a narrow interest such as rock climbing, then the advertising network knows that the audience is interested in rock climbing. Another example of contextual advertising is search advertising, where a consumers search terms provide the information necessary to target ads. The contextual approach becomes difficult for general audience sites such as national news outlets and internet “home-pages” such as Yahoo!.
Behavioral advertising networks address this difficulty by creating a profile of user’s interests as revealed by their browsing history. The data is then available to use for targeting on any of the behavioral network’s member sites. Behavioral networks are especially popular on general audience sites that cannot target with contextual information. For example, Budak et al. (2014) find that 91% of page views on genreral interest publisher sites use targeting data from a behavioral network.
Tracking is typically done through the use of cookies – small text files that websites store in a user’s browser.2 For security reasons, cookies are only allowed to be read by the site that creates them. For
example, apple.com cannot read (or determine the existence of) a cookie set by facebook.com. Because third-party advertising networks are contacted in the process of loading a member site’s page, they are also able to read and write cookies in a user’s browser. Additionally, the advertising network knows from which member site it’s code was loaded. This allows the network to recognize the same user across all member sites, and therefore to build a profile of that user’s interests – with the limitation that the ad network only gets to see a user’s visits to sites that use the network to serve ads. The network’s ability to build a useful profile then depends on having member sites that reveal specific information about a user – i.e. special interest sites.
However, special interest sites are the very sites that have audience data well suited to contextual ad-vertising – so why join the behavioral network? By joining the behavioral network, the site may receive a higher expected revenue for two reasons. First, the site’s contextual data may be augmented with be-havioral data form the network. For instance, instead of just knowing that a viewer is interested in rock climbing, the advertiser might know that the rock climber is also a 40-45 year old woman, and be willing to pay more for more specific targeting. Additionally, the behavioral network could provide a higher revenue share than the contextual network in order to attract publishers to its platform.
3 Model
3.1 Advertising Technology
Consider a single advertiser that sendsmadvertisements to an audience ofN consumers. Each
advertise-ment reaches a particular consumer with uniform probability1/N. It is possible that any given consumer
sees the ad more than once, and the advertiser values a consumer’skth advertising impression according to
the functionv:N→R. When the advertiser sends out itsmth message, the probability that it is reaching
a consumer that has seenk−1ads (and this is therefore the consumer’skth impression) is given by the
binomial distribution B(k−1, m−1; 1/N) = ( m−1 k−1 ) ( 1 N )k−1( N−1 N )m−k .
As mandN grow large, but holding(m−1)/N constant, the binomial distribution converges to the
Poisson distribution P((m−1)/N;k−1) = 1 (k−1)! ( m−1 N )k−1 e−(m−1)/N.
The expected value of themth advertisement is then given by EV(m) = ∞ ∑ k=1 1 (k−1)! ( m−1 N )k−1 e−(m−1)/Nv(k). (1)
The value is approximate, as the sum is infinite, and it is impossible for the 1,000th advertisement sent to be a particular consumer’s 1,001st advertisement received. However, whenm and N are large, it is
extremely unlikely that allmadvertisements have gone to a single consumer, and the weight on terms with k > mare infinitesimal.
In many advertising networks, advertisers can use cookies for inventory tracking. This allows them to know exactly how many times a particular consumer has seen an ad. In that case, the advertiser is able to bid directly according tov(k). However, when choosing an advertising network, a website uses Equation 1
to make decisions based on expectations regardless of whether or not inventory tracking is utilized. For particular value functionsv(·)the infinite sum converges with an analytical solution. For the case of exponential decay withλ∈(0,1),
v(k) =λk−1
the sum takes on the form
EV(m) =e−(m−1)(1−λ)/N. (2)
This follows from the fact that Equation 1 is the Taylor series expansion of Equation 2 (as a function ofλ).
Equation 2 gives the expected marginal benefit of themth advertisement. The expected value of themth
advertisement is decreasing inm, increasing inN, and increasing inλ.
This advertising technology is a generalization of models used in previous literature. When λ = 0, Equation 1 takes on the form first used by Butters (1977) and subsequently used by many others, including Athey et al. (2014) and Bergemann and Bonatti (2011). Whenλ = 0only the first impression has value and subsequent impressions have no marginal benefit. Whenλ= 1, advertising becomes linear and each impression has equal value. This case is considered in an extension in Bergemann and Bonatti (2011). As shown in later sections, the decay parameterλhas important implications for a site’s choice of advertising
network.
To compute the total value of impressions to an advertiser, I sum over the expected value of each im-pression. If there are N consumers withαimpressions per consumer (for a total ofαN ad impressions),
then the expected value ofαNadvertisements is given by V(N, α) = αN ∑ m=1 e−(m−1)(1−λ)/N = e 1/N(1−e−α(1−λ)) e1/N −eλ/N . (3)
3.2 Websites and Advertising Networks
There are many different technologies and market mechanisms that determine which ads a user sees and how much the advertiser pays for the impression. Here, I use a simple setup that captures the relevant features of commonly used methods. The advertiser pays a price per impression according to Equation 2 and the network receives revenue equal to Equation 3. The assumption that advertisers pay their full value for each impression is an approximation of the auction mechanisms commonly used to allocate advertising inventory.
I consider two types of websites: general interest sites and special interest sites. A visit to a general interest site does not reveal any information that can be used to target advertisements. Examples include large media sites and publishers such as The New York Times and CNN. I do not model the decisions of general interest sites and assume that they use a behavioral network to serve ads. This is supported by the
empirical findings of Budak et al. (2014).
Information used for targeting is revealed by one or more special interest websites. These sites deliver content related to the advertiser’s product market. For example, if the advertiser is a golf club manufacturer, then golf.com would be a relevant special interest site. The special interest site must decide which type of advertising network to use: behavioral or contextual.
If the special interest site chooses the contextual networkC, the contextual network knows that that
visitors to the site are in the advertiser’s market and will deliverαads to each of theN consumers on the
site. If the special interest site chooses the behavioral networkB, the behavioral network will deliver ads
on the special interest site using the same information as the contextual network. However, the behavioral network retains this data and can use it to deliver ads to the same consumer on general interest sites. Letγ
be the number of ad impressions from general interest sites that belong to the behavioral network. Because consumers multi-home, the advertiser can reach the consumerα+γtimes if the site chooses the behavioral
network and onlyαtimes if the site chooses the contextual network. Implicit in this is an assumption
that the advertiser only seeks to display ads to a consumer that has revealed their preference through a visit to the special interest site. If the special interest site does not share audience data, the advertiser could display ads to random consumers on the general site and hope that some of the impressions reach consumers interested in their market. I do not take this into account, as the general site is assumed to use the behavioral network, and the low values of randomly placed ads on the general audience site will get out-bid by advertisers in markets that have special interest sites that do participate in the behavioral network.
Without loss of generality, I assume that all revenue generated by the advertising network is passed on to the sites that display the ads. In reality, most networks operate on a revenue share model that gives sites a fixed fraction of the revenue generated by each ad. I normalize the value of a consumer’s first impression on the contextual network to 1. On the behavioral network, more information about each consumer is available and the value of an impression to an advertiser is higher. For example, on a behavioral network, in addition to knowing that a consumer is interested in the special interest site’s topic, the advertiser might also know the consumer’s gender and age category. LetP ≥1be the premium per impression offered by behavioral advertising over contextual advertising. If the behavioral and contextual networks offer different revenue shares, this difference is also incorporated intoP.
4 Monopoly Site
I first consider a monopoly special interest site in order to highlight the decision theoretic elements of the choice between contextual and behavioral networks. In the monopoly setting, there is only one site that possesses the information needed to create matches between the advertiser and consumers.
the special interest site andγimpressions on general interest sites that belong to the behavioral network.
Therefore, the special interest site has inventoryαNand general sites have combined inventoryγN.
If the special interest site chooses the contextual network, it generates revenue
R(C) =V(N, α). (4)
Revenue is strictly increasing and strictly concave in inventory per user, as first impressions generate more revenue than later impressions. Therefore the average price of an ad is falling in inventory per user. For large N, revenue is approximately linear inN with slope 1−exp{−1−αλ(1−λ)} as each new user generates a
constant marginal increase in revenue.
If the site chooses the behavioral network with general inventoryγN and specialist inventoryαN, the
revenue going to the special interest site is
R(B) =P α
α+γV(N, α+γ). (5)
When the site participates in the behavioral network, a total of α+γ impressions per user are served,
and the special interest site receives a fractionα/(α+γ)of the total ad spend. By expanding the supply of advertising inventory, the special interest site risks losing valuable first impressions. IfP = 1, then the average price per impression falls and the special interest site would be better off on the contextual network. IfPis large enough, the premium can overcome the reduced average price and the monopoly site
will choose the behavioral network.
Proposition 1 Monopoly decision
LetPMbe the premium at which monopoly site is indifferent between the contextual and behavioral networks.
PM =
α+γ α ×
1−e−α(1−λ)
1−e−(α+γ)(1−λ). (6)
IfP > PM, the monopoly site chooses the behavioral network. IfP < PM, the monopoly site chooses the contextual
network.
The decision of whether or not to join the behavioral network does not depend on the number of unique usersN.PMis approximately equal to(α+γ)/αunlessλis very close to one. This is illustrated in Figure 1.
Whenλis low, only the first few ad impressions per user are valuable and revenue to the special interest site
is determined by what fraction of first impressions it gets. If, by joining the behavioral network, the special interest site gets one tenth of first impressions (as opposed to all of the first impressions in a contextual network), then it would need to receive a premium ofP = 10 in order to participate in the behavioral network. Ifλis very high, then later impressions are also valuable. In this case, the special interest site is
α=���γ=�� α=����γ=��� ��� ��� ��� ��� ��� ��� λ � � � � �� �� ��
Figure 1: The monopoly cutoff premiumPM as a function ofλ.
premium.
Asαandγget large, the right hand fraction of Equation 6 approaches a decreasing step function (as a
function ofλ) equal to one forλ <1and equal to zero forλ >1. This effect can be seen in Figure 1. When αandγare large, the relative importance of the first few impressions is high, as the average value of an ad
impression is very low (unlessλis near one). Whenαandγare small, the average value of an impression
is still relatively high and the importance of receiving the first few impressions is mitigated by the higher average revenue. Other comparative statics are detailed in the following proposition.
Proposition 2 Monopoly network choice comparative statics 1. PMis decreasing inλ.
2. PMis decreasing inα.
3. PMis increasing inγ.
Proof. See Appendix A.
As explained above, the cutoff premium is decreasing inλ. The cutoff premium is also decreasing in α, the number of impressions per user. Increasingαincreases the probability that the special interest site
captures the valuable first impressions, which makes them more willing to share impressions with the general audience site. Correspondingly, the cutoff premium is increasing inγ, the number of impressions
per user on general interest sites. Asγincreases the probability that the special interest site gets the first
impressions decreases.
Proposition 3 Equilibrium monopoly revenue is 1. strictly increasing inλ,
2. strictly increasing inα,
3. weakly decreasing inγ,
4. strictly increasing inN,
5. weakly increasing inP. Proof. See Appendix A.
Revenue varies with the parameters in intuitive ways. If λincreases, all impressions after the first
generate more revenue and total revenue increases. Ifαincreases, the site shows more impressions per
user, which increases revenue. Last, ifγincreases, there is no effect if the site is on the contextual network,
but revenue falls on the behavioral network as the general interest site receives more impressions which decreases the average value of an impression.
The monopoly site results suggest that a special interest site is most likely to participate in a behavioral network when the premium to doing so is high. The premium is high if the behavioral network offers a higher revenue share than the contextual network, or if additional information from behavioral advertising is complementary to the market segment under consideration. Additionally, there are more nuanced pre-dictions that depend on how advertisers value repeated ad impressions to the same consumer. If repeated impressions in the relevant market are valuable, then a special interest site is more likely to participate in a behavioral network. This suggests that advertising industries that value repeated impressions are more likely to be served by a behavioral network. Additionally, specialist sites are more willing to participate in a behavioral network if they generate a large number of impressions relative to the general audience inventory on the network.
5 Duopoly
I now consider the duopoly setting. The model extends to an arbitrary number of sites in a natural, although algebraically cumbersome, way. Two sites are enough to demonstrate the qualitative results of the model. There are two sites with inventoryM1 =α1N1 andM2 =α2N2. It is possible that consumers multi-home and the two sites share some of the same visitors. Let βi ∈ [0,1]denote the fraction of site i’s
audience that also visits sitej ̸=i. Moreover, assume that a consumer that visits both sites makes a total
ofα1+α2visits to each site. The parameterαcan then be interpreted as the number of impressions that occur as a consumer consumes a site’s content (such as number of ads per page), not the total amount of attention a consumer gives to the topic, which then gets split between the two sites. Each sitei’s choice
5.1 Revenue
Let expected revenue to siteibe given byR(xi, xj). If both sites choose the contextual network, revenue
to siteiis given by
R(C, C) =V((1−βi)Ni, αi) +
αi
αi+αj
V(βiNi, αi+αj). (7)
The first term is the value of the(1−βi)consumers that are unique to sitei, and the second term is sitei’s
share of the revenue from the remainingβconsumers that visit both sites, and thus have inventoryαi+αj.
If both sites choose the behavioral network, then siteihas expected revenue of R(B, B) =P [ αi αi+γ V((1−βi)Ni, αi+γ) + αi αi+αj+γ V(βiNi, αi+αj+γ) ] . (8)
The site gets a premium ofP over all ad impressions. The first term in the square brackets is the revenue
generated by visitors unique to sitei. Each of these consumers generateαiimpressions on the specialist
site andγ impressions on general interest sites. In expectation, the special interest site receives revenue
equal to the fractionαi/(αi+γ)of impressions that it generates. The second term is revenue generated
from users that visit both special interest sites.
Now I consider the case where sites choose different networks.1−βiof the consumers on siteican only
be reached on the behavioral network, whileβiof the consumers on siteican be reached on the behavioral
network, or on the contextual network through the overlap with sitej. Therefore1−βiof the consumers
on the behavioral network have an expectedαi+γimpressions each, whileβiof the consumers have an
expectedαi+αj+γimpressions each. Therefore the expected revenue for siteiis given by
R(B, C) =P [ αi αi+γ V((1−βi)Ni, αi+γ) + αi αi+αj+γ V(βiNi, αi+αj+γ) ] . (9)
Note thatR(B, B) =R(B, C). If siteijoins the behavioral network, it does not matter what network the
competition joins, as the inventory per user is the same in each case. This assumes that either the advertiser is using inventory tracking technologies (as discussed in the model section) or that in expectation the advertiser bids appropriately as they deliver advertisements across the two networks and do not treat the same consumer on each network as different consumers. In other words, the fact that consumers are split across two networks (with some overlap) does not affect the total ad spend by the advertiser. The variables that determine total ad spend are number of unique consumers and number of impressions per consumer.
If siteichooses contextual and sitejchooses behavioral, the expected revenue for siteiis given by R(C, B) =V((1−βi)Ni, αi) +
αi
αi+αj+γ
5.2 Best Responses
The best response of siteito sitej’s action is given by
BRi(xj) = C ifR(C, xj)> R(B, xj) B if else (11)
Similar to the monopoly case, I considerPi
C andPBi, the cutoff values ofP above which siteichooses the
behavioral network, conditional on the other site joining the contextual or behavioral network (respec-tively).
Proposition 4 Duopoly best responses. Ifβ >0thenPi C > P i B, otherwiseP i C=P i B. Proof. PCi = V((1−βi)Ni, αi) +αiα+iαjV(βiNi, αi+αj) αi αi+γV((1−βi)Ni, αi+γ) + αi αi+αj+γV(βiNi, αi+αj+γ) PBi = V((1−βi)Ni, αi) +α αi i+αj+γV((βiNi, αi+αj+γ) αi αi+γV((1−βi)Ni, αi+γ) + αi αi+αj+γV(βiNi, αi+αj+γ)
The denominator and first term of the numerator ofPCi andPBi are the same. ThereforePCi > PBi iff αi αi+αj V(βiNi, αi+αj)> αi αi+αj+γ V(βiNi, αi+αj+γ).
Ifβ >0, this is always true, as ∂ ∂x V(N, x) x =− e1/N(1−e−x(1−λ)(x(1−λ) + 1)) x2(e1/N −eλ/N) <0.
Ifβ= 0, then these terms are equal to zero and therefore equal to each other.
Proposition 4 states that if any of a site’s audience also visits the other site, then the cutoff for joining the behavioral network decreases when the other site switches from the contextual network to the behavioral network. In other words, if sites A and B both use the contextual network and share audience members, then site B switching to the behavioral network creates a negative externality for site A by increasing the supply of advertising impressions for the overlapping audience. The cutoff for site A to join the behavioral network decreases because they experience lower advertising revenue for the shared audience regardless of their choice of network. By joining the behavioral network, site A at least gets the premium P for these shared visitors. If the sites do not share any audience members (β = 0) then site B’s choice of network does not affect site A’s decision.
Comparative statics for the cutoff in the duopoly case follow those for the monopoly case. In the duopoly setting there is an additional result for how cutoffs change with respect toβi. As more of sitei’s audience
multi-homes with sitej, siteiis willing to join the behavioral network for a lower premium.
5.3 Equilibria
If the duopoly sites are identical, then their best response functions are characterized by the samePC
andPB. In this case, all pure strategy Nash equilibria result in both sites choosing the same advertising
network.
Proposition 5 Identical sites
1. IfP > PC, then there is a unique Nash equilibrium(B, B).
2. IfP < PB, then there is a unique Nash equilibrium with(C, C).
3. IfPB< P < PC, then there are two pure strategy Nash equilibria,(B, B)and(C, C).
Proof. Follows directly from the best response functions.
In proposition 5, I only consider the pure strategy Nash equilibria. In the case wherePB < P < PC,
there is also a mixed strategy Nash equilibrium in which sites mix between the contextual and behavioral network. I do not include this, as the ease of switching ad networks makes it likely that sites will coordinate on a pure strategy Nash equilibrium outcome. When multiple equilibria are possible, the sites receive higher payoffs if they join the contextual network, asR(C, C) > R(B, B)in this range ofP. However,
anecdotal evidence from discussions with website operators suggests that not all sites take the effects from audience sharing into account when selecting a network. If one site chooses the behavioral network based on a higher revenue share, then, in this range of parameters, it is the best response of the other site to also choose the behavioral network even though both sites would be better off choosing the contextual network.
Figure 2 shows how the Nash equilibria vary with the model’s parameters. In each diagram the upper curve representsPC and the lower curve PB. The results from Proposition ?? therefore translate into
statements about how equilibria change with parameters of the model. Asλincreases, a smaller premium
is required for sites to choose the behavioral network. If late impressions are valuable, increasing the number of impressions per user does not decrease the expected value of an impression as much as when only the first impressions are valuable. Therefore the cost of expanding the supply of impressions per user does not harm the special interest site. Thenλ= 1, all impressions are worth the same and no premium is required to participate in the behavioral network. This result suggests that there will be more behavioral data in advertising markets where repeated impressions are valuable.
Asβincreases, a smaller premium is required for the sites to choose the behavioral network. Ifβ= 1, a site’s audience is already receiving extra impressions on the other special interest site, and the marginal
(���) (���) (���)�����(���) 0.0 0.2 0.4 0.6 0.8 1.0 0 2 4 6 8 10 12 14 λ P (���) (���) (���)�����(���) 0.0 0.2 0.4 0.6 0.8 1.0 0 2 4 6 8 10 12 14 β P (���) (���) (���)�����(���) 0 10 20 30 40 50 0 2 4 6 8 10 α P (���) (���) (���)�����(���) 0 20 40 60 80 100 0 2 4 6 8 10 γ P
Figure 2: Regions of Nash equilibria for the identical site case asP varies withλ, β, α, and γ. Other
increase in impressions due to the switch to the behavioral network is low. This is particularly pronounced when the other site is already on the behavioral network. Then, the marginal increase in impressions is zero andPB = 1. Whenβ = 0, there is no overlap between special site audiences and one site’s decision
does not depend on the behavior of the other andPC =PB.
Asαincreases, a smaller premium is required for the sites to participate in the behavioral network. As αincreases, the share of total impressions generated by the site itself increases and the relative increase
in impressions due to switching to the behavioral network decreases. Whenλis low, sites compete to
get the valuable first impressions. By increasingα, a special interest site is more likely to capture the first
impressions and the inclusion of general audience impressions is less risky than with low α. Similarly,
asγ increases the premium required for behavioral advertising increases. Whenγ is large, the general
audience site os more likely to capture valuable first clicks, making behavioral advertising risky for the special interest site.
The best response functions are essentially invariant in N, and the set of Nash equilibria
(approxi-mately) does not change asNchanges. This is demonstrated in Figure 3.
These results suggest that advertising markets are more likely to use behavioral advertising to target consumers when the value of repeated impressions are high. Additionally, behavioral networks are more likely to be used in markets that are served by special interest sites that have a large inventory of impressions per user. Moreover, behavioral networks are more likely in markets where consumers tend to multi-home between special interest sites. Indeed, if all of one site’s audience also visits another special interest site, then the sites may both join the behavioral network in equilibrium even ifP = 1.
(���) (���)�����(���) (���) 0 200 000 400 000 600 000 800 000 1×10⁶ 0 2 4 6 8 10 N P
Figure 3: Regions of Nash equilibria asP andN vary. Other parameters are held fixed atα= 10,γ= 100, λ= 0.5,β= 0.5.
equilibrium choice of network stays constant. When a change in parameters leads to equilibrium switching, it is possible for revenue change in surprising ways.
Proposition 6 If a change in parameters does not result in different equilibrium network selection, then equilibrium revenue for siteiis
1. strictly increasing inαi, 2. strictly decreasing inβi, 3. weakly decreasing inγ, 4. strictly increasing inλ, 5. strictly increasing inNi, 6. weakly increasing inP.
Proof. Results forαi, γ, N, P, andλfollow from Proposition 3, as the duopoly revenue objects are convex
combinations of the comparative statics therein. Asβiincreases, more weight is put on the second term
of each revenue object, which is less than the first term (see proof of Proposition 4).
However, a change in parameters can lead to different equilibrium behavior and the possibility that the comparative statics above are violated. For example if P < PB the sites both choose the contextual
network in equilibrium. Ifαincreases such thatPB< P < PC, then the sites may switch to the behavioral
network equilibrium (contextual and behavioral are both equilibria in this range) and equilibrium revenue for each site falls. If the sites continue to play the contextual equilibrium, then revenue continues to rise asαincreases. Other possibilities are explored in the next section.
5.4 Asymmetric Firms
If the two sites have different size overlaps or different impressions per user, then they will have different best response functions. Consider the case of a large special interest site and a smaller site that caters to a subset of the larger site’s audience (and the sites serve the same advertising markets). For example, a siteR
about rock climbing, and a siteBabout bouldering (a specific type of rock climbing). In this case,βR< βB,
and by Proposition??,PR
C > PCBandPBR> PBB. In this case, if the rock climbing site chooses the behavioral
site, then the bouldering site will also use the behavioral network. By choosing the behavioral network, the rock climbing site imparts a large externality on the bouldering site by revealing a large fraction of the bouldering site’s audience data to the network. However, the opposite is not always true. There is a Nash equilibrium with the climbing site choosing the contextual network and the bouldering site choosing the behavioral network ifPBR> P > PCB. This result and other combinations are summarized in Proposition
Proposition 7 Asymmetric sites LetPi C> P j CandP i B > P j B. Then 1. IfP > Pi B, P j C, P j
Bthen(B, B)is the unique Nash equilibrium.
2. IfP < PCj, Pi
C, PBi then(C, C)is the unique Nash equilibrium.
3. IfPi
B> P > P j
Cthen(C, B)is the unique Nash equilibrium.
4. IfPCj > P > Pi
Bthen(C, C)and(B, B)are the pure strategy Nash equilibria.
Proof. Follows directly from the best response functions.
Similar to Proposition 5 for the identical site case, Proposition 7 shows that sites choose the same type of network except for the case when the premium falls above both of one sites’s cutoffs and below both of the other site’s cutoffs. This can happen in many different situations, such as one site’s audience being mostly a subset of the others’ (as in the example above) or if one site has many more impressions per user than the other.
Equilibrium revenue in the asymmetric site case is similar to the symmetric site case. If a change in parameters does not lead to an equilibrium network change, the comparative statics in Proposition 6 hold. If one or both sites change equilibrium network, then the proposition need not hold. This situation is more realistic in the asymmetric site case as it does not rely on both sites switching equilibrium network – one site could change a parameter (αfor example), causing the other site to unilaterally change equilibrium
networks, which then affects the original site’s revenue.
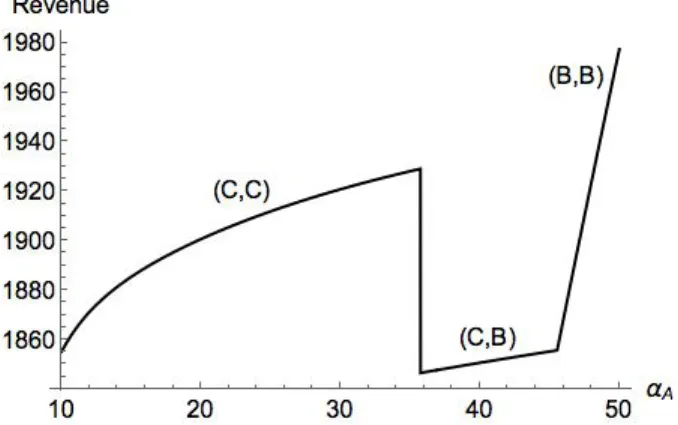
For example, suppose the rock climbing site in the above example has αA = 35, βA = 0.10 and the
bouldering site hasαB = 20, βB = 0.95. Let the common parameters beλ = 0.5, γ = 100, andP = 3.
In this environment, the unique Nash equilibrium is(C, C)– both sites choose the contextual network. If the rock climbing site increases impressions per user toαA = 40, then the new unique equilibrium is
(C, B)– the bouldering site switches to the behavioral network. The increase in impressions per user on the rock climbing means that 95% of the bouldering site’s audience is already getting so many impressions through the rock climbing site that the marginal cost of switching to the behavioral network drops below the marginal benefit of showing higher value ads (P). The bouldering site’s switch to the behavioral network
means that 10% of the rock climbing site’s audience is now exposed to targeted rock climbing ads on the behavioral network, and revenue for the rock climbing site falls. If the rock climbing site keeps increasing itsαto around 46, then the rock climbing site itself switches to the behavioral network and the new unique
equilibrium is(B, B). The revenue for the rock climbing site in this example is shown in Figure 4.
6 Conclusion
When sites that possess valuable audience data participate in behavioral networks, they share their audi-ence data with other members of the network. This expands the supply of targeted ed impressions and
Figure 4: Revenue for an example site A as it increases its impressions per userαA. At low αA, both
sites choose the contextual network in equilibrium. As siteAincreasesαA, the other site switches to the
behavioral network (causing a drop in site A’s revenue), then both sites eventually switch to the behavioral network.
drives down the average price per impression. The effects from sharing audience data on a behavioral network can outweigh the benefits of a behavioral network such as higher average baseline prices for ads and a possibly higher revenue share. This paper explores the strategic effects of behavioral networks in advertising markets and models the ad technology choices of monopoly and duopoly special interest sites. Behavioral networks are a large and growing segment of the online advertising landscape and they present many interesting questions for future research. As seen in this paper, special interest sites es-sentially cross-subsidize general audience sites when they join a behavioral network. Without targeting information from the network, a general audience site would either have to display non-targeted ads for a lower price or purchase targeting data from other sources. Behavioral networks currently pay a flat revenue share to all types of participating sites, however, they may be able to elicit greater participation from special interest sites with pricing schemes that reward special interest sites for their information. Berman (2013) addresses a similar question and uses the Shapley value to overcome inefficiencies in current revenue shar-ing models.
Additionally, this paper makes many empirical predictions about the choices of advertising network technologies by sites within single advertising markets. Testing these predictions is an area of future re-search.
References
Athey, S., Calvano, E., and Gans, J. (2014). The impact of the internet on advertising markets for news media. Working paper, National Bureau of Economic Research.
Athey, S. and Gans, J. S. (2010). The impact of targeting technology on advertising markets and media competition. The American Economic Review, 100(2):pp. 608–613.
Bergemann, D. and Bonatti, A. (2011). Targeting in advertising markets: implications for offline versus online media.The Rand Journal of Economics, 42(3):417–443.
Bergemann, D. and Bonatti, A. (2015). Selling cookies.American Economic Journal: Microeconomics, 7(3):259– 294.
Berman, R. (2013). Beyond the last touch: Attribution in online advertising.Available at SSRN.
Budak, C., Goel, S., Rao, J. M., and Zervas, G. (2014). Do-not-track and the economics of third-party advertising.Boston U. School of Management Research Paper No. 2505643.
Butters, G. R. (1977). Equilibrium distributions of sales and advertising prices. The Review of Economic Studies, 44(3):465–491.
Chen, J. and Stallert, J. (2014). An economic analysis of online advertising using behavioral targeting.MIS Quarterly, 38(2):429–449.
Ghosh, A., Mahdian, M., McAfee, P., and Vassilvitskii, S. (2012). To match or not to match: Economics of cookie matching in online advertising. ACM EC’12, pages 741–753.
Goldfarb, A. and Tucker, C. E. (2011). Privacy regulation and online advertising. Management Science, 57(1):57–71.
Johnson, J. P. (2013). Targeted advertising and advertising avoidance. The RAND Journal of Economics, 44(1):128–144 © 2013, RAND.
Tucker, C. E. (2012). The economics of advertising and privacy.International Journal of Industrial Organization, 30(3):326–329.
A Proofs
A.1 Proof of Proposition 2
∂PM ∂λ = α+γ α × α(e−(α+γ)(1−λ)−e−α(1−λ)) +γ(e−(2α+γ)(1−λ)−e−(α+γ)(1−λ)) α(e−(α+γ)(1−γ))2 <0 ∂PM ∂α = e−α(2−λ)−γ(−γeλ(α+γ)−(eα+γλ−eα+γ)(α(1−λ)(α+γ) +γ))−γ a2(e−(1−λ)(α+γ)−1)2 <0 ∂PM ∂γ = ( 1−ea(λ−1)) (e−(1−λ)(α+γ)(−(α+γ)(1−λ)−1) + 1) α(e−(1−λ)(α+γ)−1)2 >0
A.2 Proof of Proposition 3
The following comparative statics show how V varies with the parameters of interest holding network
choice constant. If a change in the parameters results in a change in equilibrium network, the results hold as revenue is the upper envelope ofR(C)andR(B), which have the (weakly) the same sign slope in each of the parameters. Asλincreases,V also increases. Asαincreases, bothV(N, α)and α
α+γV(N, α+γ)increase.
Last, asγincreases, there is no effect on revenue if the site uses the contextual network, and revenue is
decreasing if on the behavioral network, as α
α+γV(N, α+γ)is decreasing inγ. Next,V is increasing inN.
Results forP follow immediately from the definition ofR(C)andR(B). ∂ ∂λV(N, α;λ) = e1/N(e−α(1−λ)((αN−1)eλ/N −αe1/NN)+eλ/N) N(e1/N−eλ/N)2 >0 ∂ ∂αV(N, α) = (1−λ) e−α(1−λ)+1/N e1/N −eλ/N >0 ∂ ∂α ( α α+γV(N, α+γ) ) = e 1/N(γ−e−(α+γ)(1−λ)(γ−α(α+γ)(1−γ))) (e1/N−eλ/N)(α+γ)2 >0 ∂ ∂γ ( α α+γV(N, α+γ) ) = −αe 1/N(e−(1−λ)(α+γ)(1−λ(α+γ) +α+γ+ 1)) (α+γ)2(e1/N −eλ/N) <0 ∂ ∂NV(N, α) = (1−λ)(1−e−α(1−λ))e(1+λ)/N N2(e1/N −eλ/N)2 >0