Dynamics of EHR Implementations
Saeed P. Langarudi* [email protected] Diane M. Strong* [email protected] Khalid Saeed* [email protected] Sharon A. Johnson* [email protected] Bengisu Tulu* [email protected] John Trudel† [email protected] Olga Volkoff‡ [email protected] Lori R. Pelletier§ [email protected] Lawrence Garber† [email protected] Isa Bar-On* [email protected]* Worcester Polytechnic Institute † Reliant Medical Group
‡ Simon Fraser University § UMass Memorial Healthcare
Abstract
In this paper we endeavor to develop a theory to explain the dynamics of an Electronic Health Record (EHR) implementation. We base our theory on a well-established system dynamics model of improvement evolution—the model by Repenning and Sterman (RS)—with modifications that incorporate aspects of the more detailed Affordance Actualization (AA) theory. To do so we develop two simulation models: a small generic model for conceptualization and a larger more sophisticated model for operational policy design purposes. The “small” model can explain general EHR implementation dynamics producing success or failure in healthcare (HC) settings. However, it is not sufficient for comprehensive policy design and analysis. The “big” model, on the other hand, is flexible enough to allow users to design and test their own policies. Experimentation with this model revealed that a structural change of the model is needed for the EHR implementation to be successful. We show that this change—a strong connection between organizational benefits and individual benefits—is key for successful EHR implementation. Specifically, it is important to adjust the reward scheme for physicians to make the implementation successful.
P a g e
3 | 30
1
I
NTRODUCTION
Healthcare (HC) organizations are implementing Electronic Health Records (EHR) with the promise of improved quality of care, better access to healthcare services, and reduced costs. But achieving these goals is not certain and there is evidence that they may only partially achieved or not at all (Lau et al. 2010; Linder et al. 2007).
In an effort to understand the organizational change process associated with EHR implementation in HC organizations Strong et al. (2014) followed such an implementation and developed a mid-range theory of EHR-associated organizational change based on interviews conducted over several years. They looked at EHR implementation through an IT affordance lens (Gibson 1986; Markus and Silver 2008) and developed the concept of a dynamic actualization process through which the potential of affordances become realized in organizations. For example, through a dynamic actualization process, the EHR becomes incorporated into existing clinic processes as individuals and organizations build capabilities to use the EHR to accomplish their work and as the EHR is changed to accommodate the capabilities of individuals and organizations.
One could also look at the dynamics of EHR implementation from a process improvement perspective, following the model by Repenning and Sterman (2001) which uses the capability building aspect of process improvement, similar to the capability building aspect of the affordance-actualization lens. The model focuses on the dynamics leading to success or failure of improvement initiatives such as Total Quality Management (TQM).
Both theories point out the need to invest in affordance actualization (AA) or capability building, respectively, in order to reap the promised benefits for the organization, but neither Strong et al nor Repenning and Sterman give operational guidance to managers who are responsible for implementations of EHR systems in HC organizations.
The goals of this work are a) to show that we can use the AA approach and create a dynamic theory following Repenning-Sterman's model and b) to expand it to the operational level so that managers can experiment with the model and explore policies and scenarios.
In the next section we describe the two frameworks that we use for our models; the affordance actualization (AA) framework and the process improvement framework. Section 3 describes the physical system that provided the data on which we based the models. In section 4 we apply the Repenning-Sterman theory to EHR implementations in a HC setting while maintaining the basic AA terminology using a small high-level model. This theory is further developed in section 5 where the small model is converted into a larger operational model. Section 6 presents simulation results obtained from this model and Section 7 concludes this paper.
P a g e
4 | 30
2
A
FFORDANCE
A
CTUALIZATION AND
P
ROCESS
I
MPROVEMENT
In this section we present the two frameworks or lenses that we will use to understand and simulate the implementation of EHR systems in HC organizations; the AA framework and the process improvement framework.
The AA framework consists of two components: affordances, and actualization. We will examine both components and how they interact to produce organizational change.
2.1
A
FFORDANCES ANDA
FFORDANCEA
CTUALIZATIONAffordances: Gibson (1986), an ecological psychologist, developed the concept of affordances in his study of animals’ perception of their surroundings. According to Gibson’s original definition, an affordance is what is offered, provided, or furnished to someone or something by an object (Gibson 1986). Since Gibson’s groundbreaking work, other ecological psychologists have further developed and refined the concept of affordances, c.f., (Chemero 2003; Hutchby 2001; Michaels 2000; Stoffregen 2000; Turvey 1992).
Markus and Silver (2008) use the term “functional affordances” to refer to Information Technology (IT)-related affordances and define them as “the possibilities for goal-oriented action afforded to specified user groups by technical objects” (p. 622). Zammuto et al. (2007)stress that affordances emerge from the intersection of IT and organizational systems.
Strong et al. extend the affordance definition to accommodate the nature of affordances in an organization as follows: an affordance is the potential for behaviors associated with achieving an immediate concrete outcome and arising from the relation between an artifact and a goal-oriented actor or actors. In their study the “artifact” was an EHR system and the “goal-oriented actor(s)” were individuals or groups of individuals engaging purposefully in professional tasks in the HC organization. They refer to an affordance as an organizational affordance to the extent that the potential actions enabled are associated with achieving organizational level immediate concrete outcomes in support of organizational level goals. These organizational level immediate concrete outcomes are produced by the collective actions of individuals.
Strong et al. identified eight different affordances associated with an EHR implementation, as: Capturing and archiving digital data about patients, Accessing and using patient information anytime from anywhere, Coordinating patient care across sites, facilities and providers, Standardizing data, processes, and roles, Monitoring organizational operations, Substituting healthcare professionals for each other, Incorporating rich information into clinical decision making, and Shifting work across roles. Some of these affordances are dependent on each other, and are perceived only after others have been implemented.
Actualization: Identifying affordances is only a first step for understanding how introducing an EHR into an organization is implicated in organizational change. Strong et al. introduce the concept of actualization, i.e. the process by which the potential captured in the concept of an affordance is realized in organizations. Actualization, involves simultaneously (1) a set of individual journeys occurring in a dynamic organizational context as users learn, the EHR evolves, and managers intervene and (2) a multi-level process in which the journeys of many individuals interact and aggregate to form an organizational journey, i.e., the organizational change process. Actualization is definedas the actions taken by actors as
P a g e
5 | 30
they take advantage of one or more affordances through their use of the technology to achieve immediate concrete outcomes in support of organizational goals.Actualizing affordances is an individual-level process, experienced differently by each person taking goal–oriented action. The actualization process is iterative, as the actualization actions of individuals generate outcomes, and these immediate concrete outcomes, in turn, provide feedback for adjusting (as needed) those individual actions as well as adjusting the elements giving rise to the affordance.
In summary, Strong et al. develop a descriptive theory that explains in detail how organizational actors and technology interact to obtain immediate concrete outcomes and how they contribute to organizational goals. The theory explains how individual actions contribute to organizational change and how individual actualization processes are enabled or constrained by dependencies among the bundle of affordances in an organizational context.
2.2
P
ROCESSI
MPROVEMENTWe can view EHR implementations as an instance of process improvement in the healthcare industry. Similar to other process improvement initiatives such as Total Quality Management (TQM), re-engineering programs, or lean initiatives, EHR implementations promise improved quality, productivity, and cost performance. Nevertheless, many of these initiatives do not succeed to deliver on the promise. Li and Madnick (2012), Salge (2007), Repenning and Sterman (2002; 2001; 1997), Repenning (2002), Keating et al. (1999), and Sterman et al. (1997) investigated the dynamics of process improvement initiatives in an effort to understand what made such initiatives fail.
In the Repenning Sterman (RS) model (2001) time is allocated between working on tasks and on investment in improvement. The more time is invested in improvement activities the more capability is built up in the organization. The model has three main loops: a work harder loop (time spent on tasks), a work smarter loop (tasks performed using improved processes), and an investment in developing capabilities or improvement processes loop. For an improvement initiative to be successful managers need to allocate time for investment in improvement processes and for workers to learn to work using these processes, otherwise capability is eroded and improvement efforts fail. They show that frequently improvement initiatives fail when long-term improvement goals are sacrificed for short-term gains.
Our models will build on this basic Improvement model and incorporate an AA lens as well as insights that we gained from the longitudinal study that provided the data for Strong et al.
3
T
HE
H
EALTHCARE
D
ELIVERY
S
ITE AND
D
ATA
C
OLLECTION
The data for our models is the same data that has been used as the basis for Strong et al. It was collected in a longitudinal study of EHR implementation at a multi-site group medical practice located in the northeastern U.S. The medical practice has about 250 physicians and 1,500 other employees. It serves 200,000 patients with over one million patient visits per year. Each of its 25 clinic locations is responsible for its own performance and operates semi-independently, but there is also a strong central administration and regular communication and coordination across clinics.
P a g e
6 | 30
This group practice is implementing a well-respected commercial EHR package providing features to support ambulatory care clinics across all its clinics, in several phases. The phase we observed implemented computers in the exam room, where HC providers enter data into each patient’s electronic health record and generate orders for prescriptions and lab tests. The previous phase implemented electronic messaging to support communication among providers and to record phone interactions with patients. Each phase involves a gradual roll-out of the software by clinic site.
Data collection involved three rounds of interviews. First, we conducted baseline interviews shortly before the EHR went live in the exam room. These interviews focused on what work (tasks) individuals performed during a typical day and their initial impressions of how the EHR would affect their work.
Second, we conducted interviews about six weeks after the new system went live in the exam rooms. These second round interviews asked interviewees about what EHR features they used, what they most and least liked about the EHR, and how the EHR changed the way they did their work. At this time, users were highly aware of how the EHR was changing how they worked.
Finally, we conducted interviews one year after go-live, a point when users were likely to be proficient with the EHR. At this time, users had integrated the EHR into their work processes, and may have made significant changes in those work processes. Two researchers were present at each interview. Interviews were recorded and transcribed.
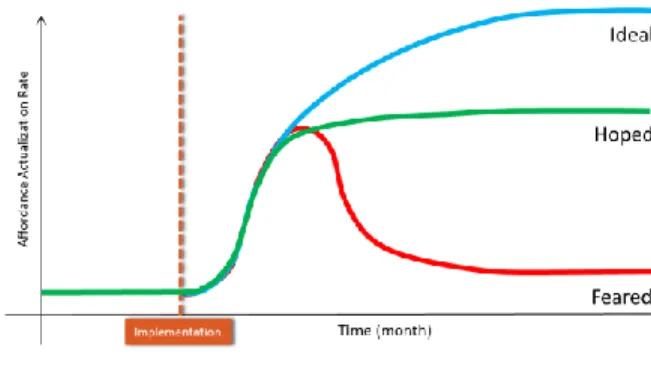
For the modeling exercise we will monitor the affordance actualization rate or development of capability. From the interviews we understood that the AA rate can follow three distinct paths; (1) it can increase slowly until it reaches an average level at which it remains (2) it can increase initially but decrease after a while and remain at a relatively low level, and (3) it can increase exponentially and reach a relatively high level, continuing to grow albeit at a slower rate. Figure 3-1 shows these reference modes as hoped, feared, and ideal respectively.
Figure 3-1: Reference Modes of Behavior
Our model should be able to generate all these potential reference modes in order to be considered a general theory of EHR implementation dynamics.
4
EHR
I
MPLEMENTATION
-
S
MALL
S
IMULATION
M
ODEL
The small EHR implementation model uses the same basic structure as the RS model. It focuses on the actions of the physicians and the effect of these actions on the performance of the HC organization. Physicians can allocate their time on seeing patients (working harder) or on affordance actualization (time
P a g e
7 | 30
spent on improvement in RS). Time spent on AA increases the stock of “Actualized Affordances” (stock of capability in RS). The organization will assess the performance gap and exert pressure to see patients or to actualize affordances, depending on the situation and the decision rules used. Thus our model contains a “work harder” loop, a “work smarter” loop, and a “reinvestment” in capability loop.
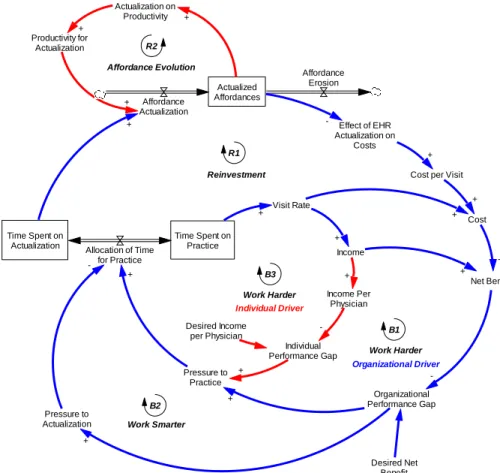
Figure 4-1: Feedback Structure of AA Theory
The model differs from the RS model in two ways; it clearly separates the actions/benefits of the physicians from those of the organization, and it captures some detail of previously discussed AA dynamics. While physicians are those who actually implement and use the EHR system, they do not see a financial benefit. Rather the opposite is true, as time per visit increases due to data entry requirements. The organization may see financial benefits over time. An “Individual performance gap” is determined by the difference between “income per physician” and “desired income per physician.” If the gap is positive physicians will try to focus more on practice. As a result, more time will be allocated to practice and, “time spent on actualization” and consequently, “affordance actualization” will decline. The reverse will take place if the gap is negative.
In this highly aggregated model we lose much of the finer details of AA theory. In order to capture some of the AA dependencies on actualization of other affordances we add a small substructure that captures this dependence in an aggregated way. In our case study we have observed that not all the affordances are available to the organization from the beginning. As the organization actualizes initial affordances new affordances emerge. For example, incorporation of rich data into practice is not available immediately upon implementation. However, after some time patients’ digital information is captured
Desired Net Benefit Organizational Performance Gap Net Benefit Income + Cost per Visit Actualized Affordances Affordance Erosion Affordance Actualization Productivity for Actualization + Time Spent on Practice Time Spent on
Actualization Allocation of Time for Practice -Income Per Physician Individual Performance Gap Desired Income per Physician -Pressure to Practice Pressure to Actualization -+ + + + Effect of EHR Actualization on Costs Cost + + -Visit Rate + + + + Effect of Actualization on Productivity + + + -Work Harder B1 Work Smarter B2 Reinvestment R1 Affordance Evolution R2 Work Harder B3 Individual Driver Organizational Driver
P a g e
8 | 30
and archived―and can be used subsequently in other affordances. So, here in our theory, we have assumed that as the level of “actualized affordances” increases, the productivity for affordance actualization increases. This, in turn, will further increase the level of “actualized affordances.”
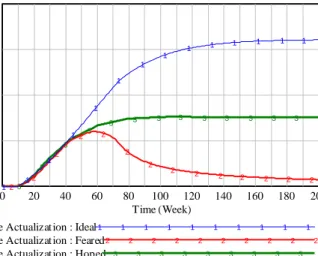
We performed simulations with this small model and the results are summarized in Fig. 4-2. The colors used in Fig. 4-2 follow those chosen in Fig. 3-1 i.e. blue for the “ideal,” green for the “hoped,” and red for the “feared” mode of behavior. The results shown in Fig. 4-2 are obtained for simulations without and with the red ‘individual driver’ loop. Without this loop we obtain only the expected and hoped for behavior (green and blue lines in Fig. 3-1 and Fig 4-2). Only after adding the ‘individual driver’ loop do we obtain the feared behavior (red line in Fig. 3-1, and Fig 4-2) in addition to the two other behaviors. Our simulation experiments with the model show that the small EHR implementation model is able to mimic possible modes of behavior of the real world system closely.
Figure 4-2: Simulation Results of AA Small Model
In summary, this small model is basically a reformulation of the RS model for a HC delivery application. It contains the same structure of “working harder” versus “working smarter” loops, and it points to the critical role of investment in capability building, which is here affordance actualization. The need to invest in AA is also a characteristic of the descriptive AA model by Strong et al. The model differs from the RS model in separating individual physician performance from organizational performance, and in an initial attempt to capture some of the AA characteristics in an aggregated way. It also simplifies important characteristics such as the importance of quality of care to physicians and patients. Nevertheless, it does not manage to capture the richness of the model by Strong et al. neither does it give operational guidance to managers who need to decide how to make an implementation successful.
5
EHR
I
MPLEMENTATION
–
AN OPERATIONAL MODEL
In the previous section we developed a fairly small simulation model to capture our theory. In this section we build a larger simulation model which contains more details of the EHR affordance dynamics, and which can more readily be translated to operational situations. This bigger model should enable us to practice a wide range of policy and scenario analysis. Here we discuss the model’s structure.
400,000 300,000 200,000 100,000 0 3 3 3 3 3 3 3 3 3 3 3 3 3 2 2 2 2 2 2 2 2 2 2 2 2 2 2 1 1 1 1 1 1 1 1 1 1 1 1 1 1 0 20 40 60 80 100 120 140 160 180 200 Time (Week) R ec or d/ W ee k
Affordance Actualizat ion : Ideal1 1 1 1 1 1 1 1 1 1
Affordance Actualizat ion : Feared2 2 2 2 2 2 2 2 2 2
P a g e
9 | 30
5.1
R
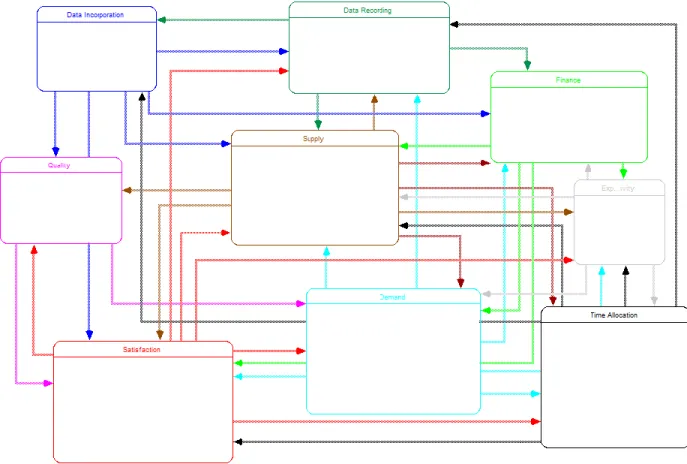
OLE OF MODEL SECTORSThe structure consists of nine sectors; demand, supply, time allocation, quality, satisfaction, experience and productivity, finance, data recording, and data incorporation as shown in Figure 5-1. The model keeps the important role that time allocation by physicians and other staff plays. Time investment in EHR usage to record data and for other functions increases the experience and eventually the
productivity of individuals. Over time this furthers the incorporation of data into the workflow leading to
successful affordance actualization. These relationships are articulated in the sectors DATA RECORDING, EXPERIENCE AND PRODUCTIVITY, DATA INCORPORATION AND AFFORDANCE ACTUALIZATION, respectively.
Figure 5-1: Aggregate View of the Model’s Structure
Better use of tools together with process improvements (AA) results in improved quality of care, and thus in physician and patient satisfaction. This is modeled in the QUALITY OF CARE and SATISFACTION sectors.
Satisfied patients promote the reputation of the HC organization and lead to increased demand for
services (DEMAND SECTOR), and physician satisfaction is an important component in physician and staff hiring and retention ensuring a sufficient supply of HC staff (SUPPLY SECTOR). These dynamics affect the
financial performance of the organization as modeled in the FINANCE SECTOR.
There are additional connections as shown in Figure 5-1. For example, systematic data capture allows better billing making more resources available, a benefit for staff members. Similarly, satisfied staff will provide better care, thus improve quality of care and patient satisfaction.
P a g e
10 | 30
5.2
D
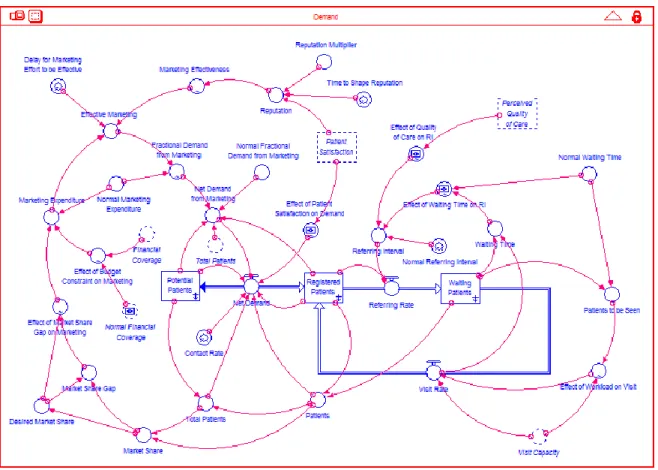
EMANDFigure 5-2 shows the structure of the demand sector. Potential patients can enter the system through the rate of “net demand.” Net demand can be positive (meaning potential patients are joining the system) or negative (which means they leave the system) and is influenced by two factors: word of mouth and marketing. Word of mouth depends on patient satisfaction while marketing depends on the organization’s budget constraints. Marketing effectiveness is also related to the organization’s reputation, which is in turn influenced by patient satisfaction.
Registered patients wait to be seen (visited) in the stock of “waiting patients”. It is implicitly assumed that quality of patient care and the time patients have to wait to receive treatment impact their level of health and consequently determines how frequently they need to be seen. So, these two factors i.e. quality of care and waiting time affect the referring rate.
Waiting patients go back to the stock of registered patients after they receive treatment. This treatment named here “visit rate” is determined by the visit (healthcare service) capacity. Visit capacity will be discussed in more detail in the supply sector. Finally, waiting time is computed by “waiting patient” divided by “visit rate.”
Figure 5-2: Structure of Demand Sector
5.3
S
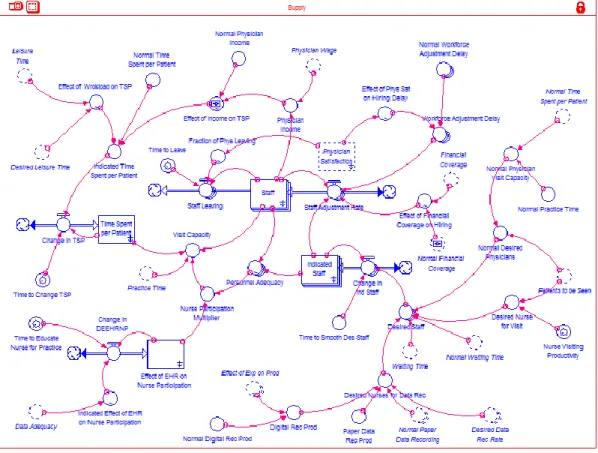
UPPLYThe function of the supply sector is to determine visit (service) capacity. There are two production factors in this supply function: labor (staff), and time they spend on patient visits. Staff is mainly physicians
P a g e
11 | 30
but it is assumed that after EHR implementation medical staff (named here “nurses”) will be able to take over some physician tasks. This is called shifting work across roles by Strong et al.
Staff can be hired or fired based on the visit capacity the organization needs and on the financial restrictions it faces. Physicians can leave the organization if they are dissatisfied with their income or work pressure. Physician satisfaction influences the organization’s ability to hire and retain physicians. Compared to physicians, nurses are less expensive, easier to hire, and never leave the organization on their own initiative.
The other health service production factor is “time spent per patient” which is determined by physician workload and their level of income. It is assumed that physicians are paid per patient they visit. However, physician workload is measured by their leisure time.
1 If leisure time is higher than normal it means that workload is not too heavy and the physician can
spend more time per patient. If physicians have less than normal leisure time it is a sign that their workload is alarming so they will spend less time on each patient visit. The same relationship holds between physician income and “time spent per patient” i.e. physicians spend more time per visit if they earn enough. If their income declines below normal they will spend less time per visit in order to increase their productivity.
Figure 5-3: Structure of Supply Sector
P a g e
12 | 30
5.4
T
IMEA
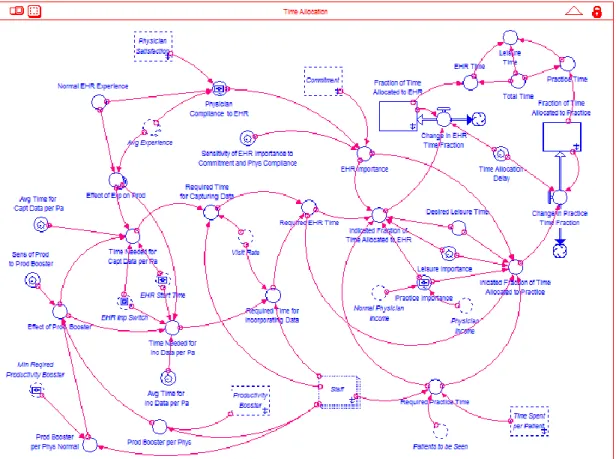
LLOCATIONIn this sector physician time is allocated between three major tasks: medical practice, EHR learning and practice, and leisure. It is assumed that the maximum time physicians can assign to all these tasks is 134 hours per week. That is, physicians have about 5 hours/day for sleep and the rest goes for work (practice and EHR) and leisure. Of course, they can decide to spend part of their leisure time on rest. It is assumed that physicians desire to have 84 hours/week of leisure and that they normally spend 50 hours/week on practice.
Figure 5-4: Structure of Time Allocation Sector
After EHR introduction this equilibrium condition is disturbed. Now, physicians have to spend some their practice and/or leisure time on EHR related activities.
The time required for practice is determined by the number of patients to be seen and by the time spent per patient. Required time for EHR depends on number of EHR-related tasks and physician experience and productivity in doing those tasks. Required time for leisure is equal to desired time, which is 84 hours/week.
The importance of each task is assessed through an index that varies from 0 to 1 with 0 indicating the least and 1 the most important. It is assumed that leisure importance is constant and equal to 1 while the two other indices are determined endogenously. Practice importance is affected by physician income. If physician income decreases practice importance will increase. The importance of EHR is a function of
P a g e
13 | 30
management commitment to EHR implementation2 and physician compliance with EHR use. Physician
compliance with EHR use depends on physician overall satisfaction and their proficiency of EHR use represented by “average experience.”
5.5
Q
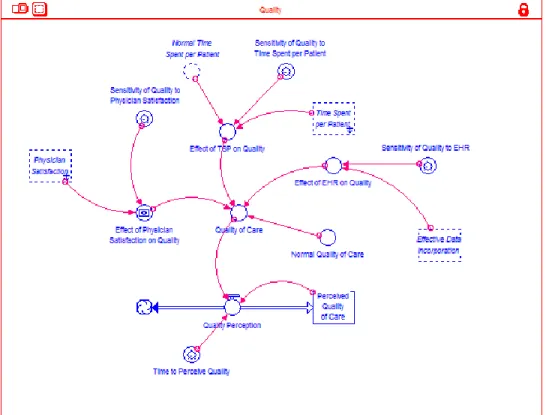
UALITYThis sector calculates a measure for quality of care delivered by the organization. In this model quality of care depends on the time physicians spend per patient, physician satisfaction, and the level of EHR implementation. If physicians spend more time per patient and if they are more satisfied with their work situation they will provide better quality of care. It is also assumed that EHR implementation can positively affect the quality of care by reducing systematic errors in medical practice.
Figure 5-5: Structure of Quality Sector
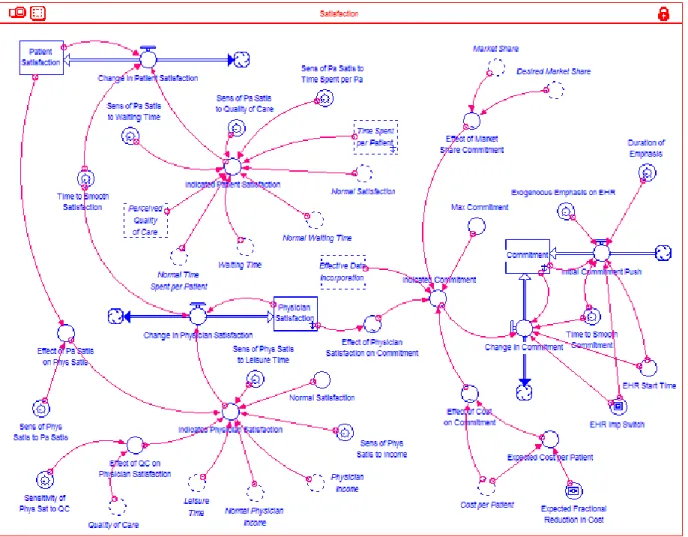
5.6
S
ATISFACTIONThis sector consists of three different types of satisfaction. The first level is patient satisfaction, which is dependent on three factors: waiting time, quality of care, and the time physicians spend per patient. Of course, nobody likes to wait. So, patient satisfaction is negatively related to waiting time. On the other hand, quality of care and time spent per patient have positive impacts on patient satisfaction. It should be mentioned that there is a delay for patients to perceive quality of care.
P a g e
14 | 30
The second type of satisfaction is physician satisfaction, which is a function of physician income, their leisure time, and the quality of healthcare they provide. Physician satisfaction can improve by higher levels of income. Leisure time is a proxy for physician workload. Reduced leisure time means higher work pressure, which decreases physician satisfaction. Physicians also can gain satisfaction by providing higher quality of care.
The third type of satisfaction is organizational satisfaction, which is named here “commitment.” This satisfaction (commitment) refers only to EHR implementation and not to the overall organizational performance. Commitment is defined as a function of cost per patient, physician satisfaction, and market share (which reflects general patient satisfaction). The most obvious expectation of the organization for EHR implementation is to reduce costs or increase income. So, the organization monitors cost per patient carefully to see whether the project is successful or not. If cost is reduced as expected the commitment will remain high but will drop otherwise. Physician satisfaction is also a crucial factor. If physician satisfaction drops significantly management may reconsider continuation of the project. Market share is considered as the organization cannot survive without its customers. So, it continues to support the project as long as market share remains reasonable but commitment may decrease if a decrease in market share is felt.
P a g e
15 | 30
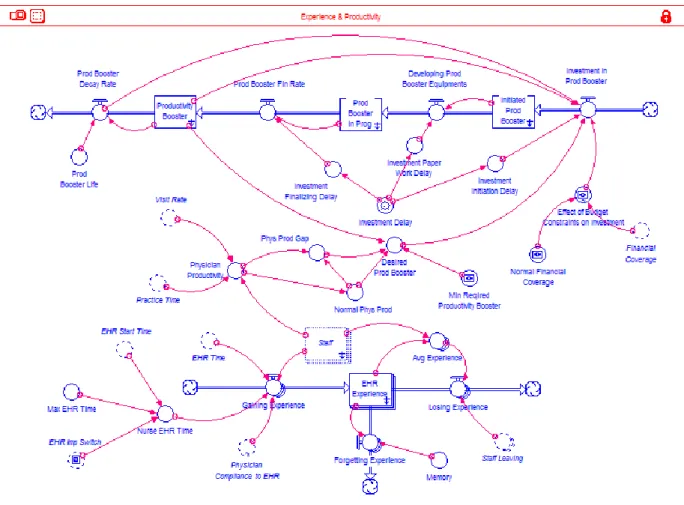
5.7
E
XPERIENCE ANDP
RODUCTIVITYStaff experience will increase over time with EHR use, and more staff experience will result in increased productivity. This sector determines staff experience and productivity resulting from EHR use or conversely forgetting with lack of use. In addition, experience declines if people resist use of the system due to dissatisfaction with EHR use.
Productivity will be improved if the organization invests in “productivity boosters.” Productivity booster here refers to any initiative that can help staff to increase productivity. It can be education or equipment that affects staff productivity. One example of a productivity booster is the use of a voice recognition system that replaces tedious typing. Investment in boosters depends on staff productivity and the financial situation of the organization. If staff productivity decreases below normal the organization may invest in productivity boosters, budget permitting.
Figure 5-7: Structure of Experience and Productivity
5.8
F
INANCEThe finance sector tracks the stock of “financial resources.” This stock increases through income and decreases through cost. Income depends on visit rate and “charge per visit.” Charge per visit is initially constant but may increase after EHR implementation (depending on the level of EHR affordance
P a g e
16 | 30
actualization) since the EHR system allows the organization to monitor and report its processes more precisely than before.3
Figure 5-8: Structure of Finance Sector
Cost includes fixed costs, malpractice premium, treatment cost, cost of paper records, EHR cost (mostly maintenance of the system), marketing expenditure, investment in productivity boosters, and wages and salaries. Among these only fixed costs and marketing expenditure won’t be affected by EHR implementation.
Malpractice will decline since the EHR system helps to reduce medical errors. Treatment costs will decline as the EHR system helps to reduce redundant or unnecessary tests and treatments. Costs of paper records will decline as the new system reduces the volume of paper archives. Investment in productivity boosters will likely increase as it is expected that physicians need to spend some of their practice time on learning and employing the EHR system and will need help increasing their productivity. Wage and salary may change due to changes in staffing needs.
P a g e
17 | 30
5.9
D
ATAR
ECORDINGThis sector follows patient data records either in paper or digital format. By default patient information is captured and archived in paper format. After EHR implementation this system may change depending on (1) adequacy and availability of staff, and (2) adequacy of time staff spends on EHR implementation. When staff starts recording data in digital format the paper records may or may not be supported depending on the level of data incorporation by physicians. If physicians continue to use paper records instead of the electronic system, information has to be recorded in paper format, too.
Figure 5-9: Structure of Data Recording Sector
5.10
D
ATAI
NCORPORATIONData incorporation determines how much physicians use the EHR system in their everyday medical practice. This incorporation depends on several factors: (1) digital data must have already been captured and archived—which is called here “data adequacy;” (2) physicians need to spend enough time on this task—which we call “time adequacy;” and (3) the degree to which physicians comply with EHR implementation.
P a g e
18 | 30
Figure 5-10: Structure of Data Incorporation Sector
6
S
IMULATION
To date we have not tested the model against formal historical time series data as the quantitative data was not available at the time of writing this paper. However, the current model is able to replicate the qualitative behavior we expect to see in a real system i.e. feared, hoped, and ideal cases, which are depicted in Figure 3-1. In this section we show how EHR implementations work without and with structural changes to the system. We will focus on trying to understand conditions that lead to sustained success of such an implementation. In the first section we will implement the EHR without implementing other changes to the system. In the second section we will explore different physician reimbursement schemes and their effect on EHR implementation success.
6.1
EHR
IMPLEMENTATION WITHOUTS
YSTEMC
HANGESFailure of an EHR implementation in healthcare settings is quite a common phenomenon (Lau et al. 2010; Linder et al. 2007). We define “failure” as a situation in which the staff fails to incorporate EHR affordances into their everyday practice routines. There are two main indicators of implementing the EHR system in practice. The first indicator is a “digital data recording” rate, which shows how many electronic records staff capture and archive in a period of time. The second indicator is the rate at which physicians incorporate recorded data in patient visits. To capture the latter we have defined an “index for the incorporation of digital data into practice” as a direct function of “data adequacy,” “time adequacy for incorporating data,” and “physician compliance with EHR.” This function is given below:
P a g e
19 | 30
Where:
IIDDP stands for “index for the incorporation of digital data into practice;”
DA (data adequacy) gives the amount of data recorded and available for incorporation into practice; TAID (time adequacy for incorporating data) represents the adequacy of time physicians spend on data incorporation; and
PCEHR (physician compliance with EHR) is a parameter that indicates how eager physicians are to participate in actualizing EHR affordances.
To make it easier to monitor the aggregate behavior of the model we have combined the two indicators into a single index; “affordance actualization rate.” Thus a low AA rate indicates unsuccessful EHR implementation.
We may also track other indicators such as financial resources, patient satisfaction, physician satisfaction, cost per patient, etc. These indicators are frequently used to assess the performance of healthcare organizations.
The model is initialized in equilibrium without the use of an EHR system. We disturb the equilibrium condition by initiating an EHR implementation project. In the model this is accomplished by changing commitment in the satisfaction sector for some finite time. This change in commitment affects the time allocated to EHR implementation. The result, which we refer to as base case simulation, is shown in Figure 6-1. As we can see, the index initially increases but after a while it starts to stagnate and declines in an unstable manner.
Figure 6-1: Affordance Actualization Rate in Base Case
Figure 6-2 showing the affordance actualization components explains why this index initially increases but fails afterward. In fact, data recording rates follow the same pattern of behavior while the data incorporation index oscillates more significantly. The maximum level it can reach is still very low (about 0.06 compared to the highest reachable level which is 1.000).
P a g e
20 | 30
Figure 6-2: Components of Affordance Actualization in Base Case
Figure 6-3 to Figure 6-6 provide more information about the failure process. Figure 6-3 shows how physicians allocate their time between three major tasks: practice, EHR, and leisure.4 In equilibrium and
prior to the EHR implementation physicians spend 50 hours/week on practice, 84 hours/week on leisure, and zero hours/week on EHR. As EHR implementation begins physicians have to spend part of their time on learning and using it. So, EHR time gradually increases and inevitably both practice time and leisure time decline to provide more space for EHR time. Reduction in practice time increases patient waiting time, which causes physicians to cut corners so they can reduce “time spent per patient”—which is not shown here. This causes the quality of care to decline (see Figure 6-4). This decline along with higher waiting times and less time spent per patient reduces patient satisfaction as is illustrated in Figure 6-4.
Figure 6-3: Physician Time Allocation in Base Case
P a g e
21 | 30
Figure 6-4: Patients Satisfaction, Waiting Time, and Quality of Care in Base Case
Figure 6-5: Physicians, Physician Satisfaction, and Patients in Base Case
P a g e
22 | 30
These changes motivate patients to leave the organization to a better healthcare provider (see Figure 6-5). As patients leave, the cost per patient increases and financial resources decline after a short-term increase (see Figure 6-6). So do the number of visits per physician and thus physician income. Reduction in both income and leisure time make physicians unhappy and cause them to leave the system, too. Lower physician satisfaction, lower patient satisfaction, lower financial coverage, and higher cost per patient decrease commitment of management to EHR implementation (see Figure 6-6).
Staff notices decreased management commitment to EHR implementation reduces time spent on EHR and gradually goes back to old routines. Physicians spend more and more time on practice and gradually quality of care and patient satisfaction start to recover. Physician satisfaction also increases with the increase in number of patients and income, better quality of care, and having more time for leisure. However, their satisfaction is still below its initial level even until the end of simulation (see simulation #2 in Figure 6-5).
In summary, this case of EHR implementation is a failure. Clearly, EHR implementation that merely puts additional demands on physicians with respect to computer skills and data entry is not successful in the long-term.
The question is if we can find a combination of policy parameters5 that will lead to sustained success.
To investigate this issue further we have conducted 1000 simulations each with a different combination of parameter values but we couldn’t find a parameter combination that could resolve the problem. A subset of 250 sensitivity simulations is shown in Figure 6-7 where all policy parameters are varied together. To do so we have used a uniform distribution around ±50% of the base case values of each parameter. The results for our main measure, “affordance actualization rate” are shown in Figure 6-7. The figure shows that no combination of parameters changes the basic behavior pattern.
Figure 6-7: Sensitivity Simulation with All Policy Parameters Varying Simultaneously
5 Policy parameter here refers to those parameters that organization may be able to have an impact on. They
are listed in Appendix. Other parameters of the model are considered as implications of characteristic of the system which may not be under the organization’s control.
P a g e
23 | 30
6.2
EHR
I
MPLEMENTATION WITHS
TRUCTURALC
HANGES TO THES
YSTEMThe structural changes were guided by the insights from our small model where individual benefits were important to success or failure of EHR implementation. Ideally we would like to link AA to physician rewards, but the challenge is that EHR affordance actualization is not a very tangible measure. Thus we tried three different reward systems that reflect AA indirectly. The first system bases physician payment on aggregate physician satisfaction increasing reimbursement when satisfaction falls below normal. The assumption here is that if AA is too onerous on physicians then it will eventually result in decreased aggregate physician satisfaction. Here payment is still based on a patient visit rate.
The second system removes the link between visit rate and physician income. In this system physicians are still paid based on aggregate level of physician satisfaction but they are paid a constant salary independent of patient visit rate. In all cases, payment for aggregate physician satisfaction can be interpreted as a willingness of the organization to consider the situation of the physicians. The third system of payment is designed for the case that physician satisfaction is difficult to measure. This system is very similar to the second system but this time the organization increases physician salary by a constant rate, say 20%, together with the introduction of the EHR. In addition, they may (or may not) reward them if there is an observed improvement in quality of care and patient satisfaction. We call these two last methods (the second and third) “fixed salary” systems while we name the first method “flexible reimbursement” system.
Figure 6-8 to Figure 6-17 compare the simulation results for the three payment methods with the base case scenario. In all graphs we have four different simulation runs. Simulation #1 represents the base case while simulations #2, #3, and #4 represent the first, second, and third payment system respectively. Figure 6-8 shows that all new payment systems can improve the model’s performance. The figure shows that “fixed salary” systems (system 2 and 3) give a slightly better AA rate than the “flexible reimbursement” (system 1) but we need more information to understand the difference between the payment systems.
Figure 6-8: Affordance Actualization Rate; Comparison of Base Case with First, Second, and Third Alternative Payment Systems
Figure 6-9 shows the difference in physician income due to different methods of payment. As we can see the “fixed salary” systems provide a more stable stream of income for physicians. The “Flexible reimbursement” system yields a higher income level than the first “fixed salary” system at the end of the
P a g e
24 | 30
simulation, but the second “fixed salary” outdoes the “flexible reimbursement” system in both aspects; the level of income and stability. These dynamics produce almost the same behavior for physician satisfaction—which is not shown here.
Figure 6-9: Physician Income; Comparison of Base Case with First, Second, and Third Alternative Payment Systems
Figure 6-10 and Figure 6-11 show how physicians spend their time under the different payment systems. For all three systems they spend more time per patient than under the base case in the short and mid-term with the most time spent for system 3. It appears that their increased EHR experience and productivity makes them happier and causes them to spend more time per patient. This is especially convincing for the third system. There is, nonetheless, a declining trend in “time spent per patient” under the new systems because physicians are spending more and more time on EHR. Additionally, patient population is increasing constantly so the waiting time is increasing (look at Figure 6-12).
P a g e
25 | 30
Figure 6-11: Time Spent per Patient; Comparison of Base Case with First, Second, and Third Alternative Payment Systems
The patient perspective can be seen in Figure 6-12 and Figure 6-13. Practice time of physicians has declined and it causes waiting time to increase (see Figure 6-12) but quality of care has also increased (Figure 6-14) because physicians actualize more EHR affordances (which impacts quality as we discussed earlier), spend more time per patient, and are happier now. As Figure 6-12 shows the second “fixed salary” system has generated greater instability and longer waiting time. The first “fixed salary” system has better results compared to the other methods (lower waiting time and less instability) but it is still at a higher level than the base case. Lower waiting time in the base case is mostly due the significant loss of patients.
Figure 6-12: Waiting Time; Comparison of Base Case with First, Second, and Third Alternative Payment Systems
Combination of “time spent per patient,” “waiting time,” and “quality of care” shape patient satisfaction, which is presented in Figure 6-13. It is interesting that the “flexible reimbursement” and the first “fixed salary” systems do even worse than the base case in terms of patient satisfaction at the end of the simulation. On the other hand system three generates a higher level of patient satisfaction.
P a g e
26 | 30
Figure 6-13: Patient Satisfaction; Comparison of Base Case with First, Second, and Third Alternative Payment Systems
Figure 6-14: Quality of Care; Comparison of Base Case with First, Second, and Third Alternative Payment Systems
Figure 6-15 to Figure 6-17 explore the effect of the different payment systems on the financial performance of the organization. Figure 6-15 shows the organization’s income while Figure 6-16 depicts organizational cost. Figure 6-17 illustrates financial coverage. In the base case the organization receives less income but it also incurs lower costs. The suggested payment systems can increase organizational income but they also impose significant costs on the system. The first “fixed salary” system results in better financial performance than the other systems with financial coverage being higher at the end of simulation under this system of payment. Consequently, financial coverage increases to a level that is even higher than the initial financial coverage (10 years). The third system, which has produced the most plausible outcomes (in terms of affordance actualization, physician satisfaction, and patient satisfaction), has the worst impact on financial coverage time among all three alternative payment methods. However, it is still better than the base case scenario at the end of simulation.
P a g e
27 | 30
Figure 6-15: Income; Comparison of Base Case with First, Second, and Third Alternative Payment Systems
Figure 6-16: Cost; Comparison of Base Case with First, Second, and Third Alternative Payment Systems
P a g e
28 | 30
In summary, our experimentation shows that the key for a successful EHR implementation is to bridge between organizational benefit and individual benefit of physicians and by extension of nurses so that individuals as well as the organization can benefit from the EHR implementation. This structural change can increase the chance of a successful EHR implementation but it can also negatively impact the organizational financial indicators. The challenge for the organization is to weigh these competing indicators for their specific situation. In order to do so, more detailed and specific performance data would be required.
7
C
ONCLUSION
In this paper we endeavor to develop a general theory to explain dynamics of an EHR implementation using two different perspectives; an improvement perspective and an affordance actualization perspective. We use a well-established system dynamics theory of improvement mechanism—RS (Repenning-Sterman) model—and include modifications that address the different goals of individuals and organizations as well as the more detailed AA (Affordance Actualization) conceptual framework. Our simulation experiments with a new small model show that it has the ability to explain general EHR implementation dynamics producing success or failure in HC settings.
Both theories, the AA theory and the RS model, emphasize the importance of spending time on AA or capability building, respectively. Our theory is based on the central mechanism, by which physicians allocate their time between routine work and affordance actualization. This is a fundamental structure, which deeply affects the process of EHR implementation. This mechanism is in turn significantly influenced by the alignment of organizational and individual goals. That is, the alignment of the organizational and individual goals significantly increases the chance of a successful EHR implementation while lack of such alignment can lead to failure.
Based on this general theory we developed a more sophisticated operational model, which provides many policy intervention options. The model is flexible enough to allow users to design and implement their own policies. Our sensitivity simulation revealed that something more than alteration of policy parameters is required to ensure successful EHR implementation. Indeed, we need a structural change. Our experimentation with the detailed operational model supports our general theory that we established in the “small” model providing a link between organizational and individual benefits. In fact, this model shows that building a strong link between organizational and individual benefits in the form of benefit distributions (here to physicians) makes successful EHR implementation more likely.
8
W
ORKS
C
ITED
Chemero, Anthony. 2003. “An Outline of a Theory of Affordances.” Ecological Psychology 15 (2): 181–95. doi:10.1207/S15326969ECO1502_5.
Gibson, James Jerome. 1986. The Ecological Approach to Visual Perception. Routledge.
Hutchby, Ian. 2001. “Technologies, Texts and Affordances.” Sociology 35 (2): 441–56. doi:10.1177/S0038038501000219.
Keating, Elizabeth, Rogelio Oliva, Nelson Repenning, Scott Rockart, and John Sterman. 1999. “Overcoming the Improvement Paradox.” European Management Journal 17 (2): 120–34.
P a g e
29 | 30
Lau, Francis, Craig Kuziemsky, Morgan Price, and Jesse Gardner. 2010. “A Review on Systematic Reviews of Health Information System Studies.” Journal of the American Medical Informatics Association
17 (6): 637–45.
Li, Xitong, and Stuart E. Madnick. 2012. “Understanding the Organizational Traps in Implementing Net-Centric Systems.” 2011 Progress Report: Research on Understanding the Challenges to Net-Centric
Systems and Mitigating Approaches.
Linder, Jeffrey A., Jun Ma, David W. Bates, Blackford Middleton, and Randall S. Stafford. 2007. “Electronic Health Record Use and the Quality of Ambulatory Care in the United States.” Archives of Internal
Medicine 167 (13): 1400–1405.
Markus, M. Lynne, and Mark S. Silver. 2008. “A Foundation for the Study of IT Effects: A New Look at DeSanctis and Poole’s Concepts of Structural Features and Spirit.” Journal of the Association for
Information Systems 9 (10): 609–32.
Michaels, Claire F. 2000. “Information, Perception, and Action: What Should Ecological Psychologists Learn From Milner and Goodale (1995)?” Ecological Psychology 12 (3): 241–58. doi:10.1207/S15326969ECO1203_4.
Repenning, Nelson P. 2002. “A Simulation-Based Approach to Understanding the Dynamics of Innovation Implementation.” Organization Science 13 (2): 109–27.
Repenning, Nelson P., and John D. Sterman. 1997. Getting Quality the Old-Fashioned Way: Self Confirming
Attributions in the Dynamics of Process Improvement. Sloan School of Management,
Massachusetts Institute of Technology.
———. 2001. “Nobody Ever Gets Credit for Fixing Problems That Never Happened.” CALIFORNIA
MANAGEMENT REVIEW 43 (4).
———. 2002. “Capability Traps and Self-Confirming Attribution Errors in the Dynamics of Process Improvement.” Administrative Science Quarterly 47 (2): 265–95. doi:10.2307/3094806.
Salge, Markus. 2007. “Exploring Patterns of Process Improvement with a Generic Model.” In Conference
Proceeding, The 24th International Conference of the System Dynamics Society, 23–27.
Sterman, John D., Nelson P. Repenning, and Fred Kofman. 1997. “Unanticipated Side Effects of Successful Quality Programs: Exploring a Paradox of Organizational Improvement.” Management Science 43 (4): 503–21.
Stoffregen, Thomas A. 2000. “Affordances and Events.” Ecological Psychology 12 (1): 1–28. doi:10.1207/S15326969ECO1201_1.
Strong, Diane M., Sharon A. Johnson, Bengisu Tulu, John Trudel, Olga Volkoff, Lori R Pelletier, Isa Bar-On, and Lawrence Garber. 2014. “A Theory of Organization-EHR Affordance Actualization.” Journal of
the Association for Information Systems 15 (2): 53–85.
Turvey, M.T. 1992. “Affordances and Prospective Control: An Outline of the Ontology.” Ecological
Psychology 4 (3): 173–87. doi:10.1207/s15326969eco0403_3.
Zammuto, Raymond F., Terri L. Griffith, Ann Majchrzak, Deborah J. Dougherty, and Samer Faraj. 2007. “Information Technology and the Changing Fabric of Organization.” Organization Science 18 (5): 749–62.
P a g e
30 | 30
9
A
PPENDIX
9.1
L
IST OFP
OLICYP
ARAMETERSParameter Description Unit of Measure
Contact Rate The rate with which patients may meet each other 1/week
Delay for Marketing to Be Effective
Time delay that takes for marketing investment to make a real impact on demand
Weeks Exogenous
Emphasis on EHR
Initial surge of fractional increase in commitment to EHR implementation
Unitless Duration of
Emphasis
Time period within which the organization holds its exogenous commitment to EHR implementation
Weeks Normal Financial
Coverage
Standard time allowance that the organization considers for itself as a limit for being able to pay all its bills even with zero revenue during that period.
Weeks
Sensitivity of Physician Satisfaction to Quality of Care
A constant that determines the sensitivity of physician satisfaction function to changes in quality of care. When it is zero the satisfaction function becomes independent of quality of care. When it is 1, 100% change in quality of care produces 100% change in physician satisfaction.
Unitless
Sensitivity of Patient Satisfaction to Quality of Care
A constant that determines the sensitivity of patient satisfaction function to changes in quality of care. When it is zero the satisfaction function becomes independent of quality of care. When it is 1, 100% change in quality of care produces 100% change in patient satisfaction.
Unitless
Time to Perceive Quality
Time that takes for patients to perceive the quality of care Weeks Time to Smooth
Commitment
Reflects the sensitivity of management to changes in factors that affect their commitment. Longer time delays make the commitment to become slower in response to those factors
Weeks
Time to Educate Nurses for Practice
Time that takes the organization to educated and prepare nurses for being able to help physicians in some parts of their medical practices