February 22, 2016
BY CERTIFIED MAIL
RETURN RECEIPT REQUESTED
Glenn Kellow
President and Chief Executive Officer
Peabody Energy
Peabody Plaza
701 Market St.
St. Louis, MO 63101
Re:
Notice of Intent to File Suit Against Peabody Energy Over Violations of the U.S.
Surface Mining Control and Reclamation Act
Dear Mr. Kellow:
Pursuant to the Surface Mining Control and Reclamation Act (“SMCRA”), 30 U.S.C. §
1270, and regulations thereunder at 30 C.F.R. § 700.13, WildEarth Guardians hereby notifies
you that we intend to file suit in federal court against Peabody Energy over ongoing violations of
SMCRA and regulations implementing SMCRA.
Specifically, Peabody Energy is failing to comply with reclamation bonding requirements
under SMCRA with regards to its operations at several permitted coal mines in Colorado, New
Mexico, and Wyoming. Peabody has failed to notify respective state regulatory agencies that the
company no longer qualifies for self-bonding, and to post an alternative bond within 90 days, as
required by 30 C.F.R. § 800.23(g). Under SMCRA regulations, if a company fails to post an
adequate bond, it must “cease coal extraction.” 30 C.F.R. § 800.16(e)(2).
SMCRA provides that, “[A]ny person having an interest which is or may be adversely
affected may commence a civil action [] to compel compliance [] against any [] person who is
alleged to be in violation of any rule, regulation, order or permit issued pursuant to this [30
U.S.C.] subchapter [V].” 30 U.S.C. § 1270(a)(1). A civil action under SMCRA may not be
commend prior to “sixty days” after the violator has been given notice of the violations. 30
U.S.C. § 1270(b)(1)(A). With this letter, WildEarth Guardians is notifying Peabody Energy that
if the violations documented herein are not resolved in 60 days, we intend to file suit in federal
court to enforce SMCRA. Below, we detail Peabody Energy’s violations.
2
I.
BACKGROUND
Under SMCRA, before a company can mine coal, they are required to post bonds
covering the full cost of reclamation in case mining operations are abandoned prior to the
completion of reclamation.
See
30 U.S.C. § 1259 and 30 C.F.R. § 800.11. Although normally,
companies post surety bonds or offer collateral to ensure the costs of reclamation can be covered,
SMCRA allows companies to post self-bonds, or corporate guarantees.
See
30 U.S.C. § 1259(c)
and C.F.R. § 800.23. Self-bonds are essentially agreements between companies and regulatory
authorities where the mining companies guarantee to cover the costs of reclamation, but do not
actually provide direct funds, collateral, or third-party guarantees to cover such costs.
See
30
C.F.R. § 800.5(c) (defining a self-bond as an “indemnity agreement” between permit applicants,
any guarantor, and the regulatory authority).
Self-bonding is only allowed where a company has “a history of financial solvency.” 30
U.S.C. § 1259(c). Under SMCRA regulations, a company is only allowed to self-bond where it
meets all of certain criteria set forth at 30 C.F.R. §§ 800.23(b)-(e). Among other things, certain
financial conditions must all be met, including that the company seeking to be self-bonded must:
●
Have an “A” rating or higher for its most recent bond issuance, as issued by
Moody’s Investor Service or Standard and Poor’s Corporation;
●
Have a net worth of at least $10 million or fixed assets in the U.S. of at least $20
million, a ratio of total liabilities to net worth of 2.5 times or less, and a ratio of
current assets to current liabilities of 1.2 times or greater; and
●
Ensure that the total amount of self-bonds do not exceed 25% of the company’s,
or guarantor’s, net worth in the United States.
30 C.F.R. §§ 800.23(b)(3) and (d). If any one of these, or other self-bonding criteria for that
matter, is not met, a company is not allowed to self-bond its mining operations.
If a permittee is self-bonded, it has a mandatory duty to “immediately” notify regulatory
authorities if financial conditions change such that it no longer meets the financial criteria at 30
C.F.R. §§ 800.23(b)(3) and (d). 30 C.F.R. § 800.23(g). Within 90 days of this notification, the
permittee must also post an alternate bond in the “same amount as the self-bond.”
Id
. If the
company fails to do so, it must “cease coal extraction” and “shall immediately begin to conduct
reclamation operations[.]” 30 C.F.R. § 800.16(e)(2).
The States of Colorado, New Mexico, and Wyoming all regulate coal mining pursuant to
regulatory programs approved by the U.S. Office of Surface Mining Reclamation and
Enforcement.
See
30 C.F.R. §§ 906, 931, and 950. Under these programs, the states have
adopted regulations related to self-bonding that effectively mirror the regulations implementing
SMCRA.
See
Colorado Mined Land Reclamation Board Regulations § 3.02.4; New Mexico
Administrative Code § 19.8.14.1410; and Wyoming Land Qualify Division Coal Rules and
Regulations, Chapter 11. Notably, all states require that self-bonded coal mine operators notify
respective state regulatory authorities when they no longer qualify for self-bonding and to post
3
substitute bonds within 90 days.
See
Colorado Mined Land Reclamation Board Regulations §
3.02.4(2)(e)(vii); New Mexico Administrative Code § 19.8.14.1410(F); and Wyoming Land
Qualify Division Coal Rules and Regulations, Chapter 11, Section 5.
II.
PEABODY ENERGY’S FINANCIAL STATUS
In the case of Peabody Energy, reports indicate that while the company self-bonds mining
operations across the U.S., the company no longer meets the financial criteria for self-bonding
under 30 C.F.R. § 800.23. As detailed in recent reports, the company fails as follows:
●
Peabody no longer has an “A” rating or higher, as issued by both Moody’s
Investor Service and Standard and Poor’s Corporation, rendering the company
ineligible for self-bonding under 30 C.F.R. § 800.23(b)(3)(i). As disclosed in a
December 2015 Moody’s report, the company’s corporate family rating is now
“Caa3,” which “reflects [Moody’s] expectation of continued deterioration in the
company’s credit metrics[.]”
1Further, as of July 2015, Peabody’s rating with
Standard and Poor’s was “BB-.”
2●
Peabody’s total liabilities to net worth ratio is greater than 2.5, rendering them
ineligible for self-bonding under 30 C.F.R. § 800.23(b)(3)(ii) and (iii). According
to Peabody’s most recent filings, the company’s total liabilities were reported to
be $10,102,800,000 and the company’s net worth, as indicated by stockholders’
equity, was reported to be $869,900,000, yielding a liabilities to net worth ratio of
11.63.
3Feb. 11, 2016
Total Liabilities
$10,102,800,000
Net Worth
$869,900,000
Liabilities to Net Worth Ratio
11.63
●
The company’s total amount of outstanding self-bonds exceed 25% of their
tangible net worth in the U.S., rendering them ineligible for self-binding under 30
C.F.R. § 800.23(d). According to Peabody’s most recent Form 10-K, as of the end
of 2014, Peabody’s total amount of self-bonding amounted to $1,361,400,000.
4
1
Moody’s Investors Service, “Moody’s downgrades Peabody’s ratings (CFR to Caa3), outlook negative,” website available at https://www.moodys.com/research/Moodys-downgrades-Peabodys-ratings-CFR-to-Caa3-outlook-negative--PR_341808.
2 StreetInsider.com, “UPDATE: Standard and Poor’s Downgrades Peabody Energy (BTU) to ‘BB-’; Outlook to
Stable,” website available at
http://www.streetinsider.com/Credit+Ratings/UPDATE%3A+S%26P+Downgrades+Peabody+Energy+(BTU)+to+B B-%3B+Outlook+to+Stable/10725752.html.
3 Peabody Energy, “Peabody Energy Announces Results For the Year Ended December 31, 2015,” available at https://mscusppegrs01.blob.core.windows.net/mmfiles/files/investors/quarterly-results/q415%20er%20release.pdf. Attached as Exhibit 1.
4 Peabody Energy, “2014 10-K,” available at
4
This is more than 100% of the company’s current net worth, as indicated by
stockholders’ equity. Furthermore, even though there is a chance that Peabody
may sell its Colorado and New Mexico assets, such a sale would, according to
reports, eliminate only $300 million in self-bonding obligations.
5This would
eliminate only a small amount of total reclamation liability and still place the
company’s total liabilities to net worth ratio far above 2.5.
In spite of this, Peabody has generally asserted that it still is allowed to self-bond for its
mining operations. The reason is because the guarantor of its self-bond is Peabody Investments
Corporation, a subsidiary of Peabody Energy, which the company claims does meet the
requirements for self-bonding.
However, filings indicate that Peabody Investment Corporation’s assets are entirely
pledged as collateral to Peabody Energy’s debt.
6This appears to indicate there is no possible way
that this subsidiary could meet the criteria for self-bonding set forth at 30 C.F.R. § 800.23. If
Peabody Investment Corporation’s assets are pledged as collateral to Peabody Energy, then the
subsidiary is as financially unqualified as the parent.
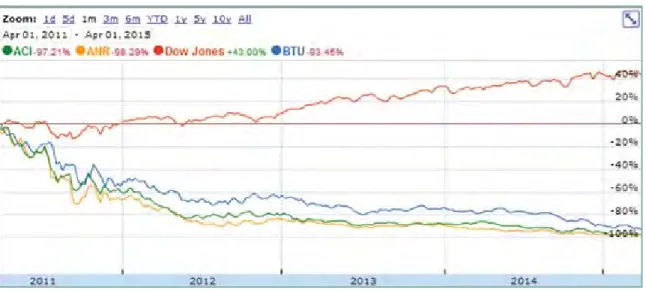
Peabody’s poor financial status is underscored by numerous reports that the company is
very likely to file for bankruptcy this year. A January 20, 2016 Bloomberg News article reported
that Peabody is likely the next coal mining company to file bankruptcy, following on the heels of
Patriot Coal, Walter Coal, Alpha Natural Resources, and Arch Coal. According to the
Bloomberg report:
7In terms of capital, Peabody had $1.4 billion in liquidity including cash and availability
under its revolving loans as of Nov. 5, according to a company filing. Its cash dropped to
$167.4 million on that day from $334.3 million at the end of September. At that rate, the
company is going to run out of cash in nine months, Bloomberg data show.
In a January 22, 2016 filing, Peabody disclosed an extensive debt exchange proposal and
ongoing discussions with debt holders to address its precarious financial status and potentially
avoid bankruptcy.
8However, industry observers have expressed skepticism that any potential
U&companyName=Peabody+Energy+Corp.&formType=10-K&dateFiled=2015-02-25. Excerpts attached as Exhibit 2.
5 PR Newswire, “Peabody Enters into Agreement to Sell New Mexico and Colorado Assets,” website available at http://www.prnewswire.com/news-releases/peabody-energy-enters-into-agreement-to-sell-new-mexico-and-colorado-assets-300182846.html.
6 Peabody Investment Corporation’s assets are pledged as collateral to Peabody Energy’s debt. See Peabody Energy,
“Amended and Restated Credit Agreement,” available at
http://www.sec.gov/Archives/edgar/data/1064728/000106472813000119/btu_20130930ex101.htm. Agreement attached as Exhibit 3.
7 Xu Klein, J. and T. Loh, “The Coal Miner ‘On Everybody’s List’ as Next Bankruptcy Victim,” Bloomberg
Business (Jan. 21, 2016), available online at http://www.bloomberg.com/news/articles/2016-01-21/the-coal-miner-on-everybody-s-list-as-next-bankruptcy-victim. Attached as Exhibit 4.
8
Peabody Energy, “Form 8-K” (Jan. 2, 2016), available at
http://app.quotemedia.com/data/downloadFiling?webmasterId=101533&ref=10684481&type=HTML&symbol=BT U&companyName=Peabody+Energy+Corp&formType=8-K&dateFiled=2016-01-22.
5
debt exchange will succeed in preventing bankruptcy, noting that similar exchanges did not
prevent Arch Coal and other companies from recently filing for bankruptcy.
9More recent reports have further highlighted Peabody’s precarious financial status.
According to the Wall Street Journal, the company is drawing down a $1.65 billion revolving
loan to secure cash, an indication of impending bankruptcy.
10And most recently, Peabody’s
attempts to sell its Colorado and New Mexico assets to Bowie Resource Partners has apparently
stalled out.
11Upon information and belief, if Peabody cannot sell its Colorado and New Mexico
assets, it cannot complete its proposed debt exchange.
III.
PEABODY’S SELF BONDING IN COLORADO, NEW MEXICO, AND
WYOMING
Peabody Energy reports the company self-bonds a total of $1,361,400,000 in reclamation
obligations across all of its operations, although this number is likely currently higher.
12The vast
majority of these self-bonding obligations are for the company’s permitted coal mines in the
states of Colorado, New Mexico, and Wyoming. According to a 2014 survey by the Interstate
Mining Compact Commission, Peabody self-bonds a total of $1,106,718,756 in these states,
covering mining and reclamation operations at five mines in Colorado, two in New Mexico, and
five in Wyoming.
13See
Table below.
State
Total Peabody
Self-bonding Obligations
Mines (Permit No.)
Colorado
$26,000,000
Foidel Creek (C-1982-056), Sage Creek
(C-2009-087), Seneca (C-1982-057), Yoast (C-1994-082),
Williams Fork (C-1981-044)
New Mexico
$290,439,433 El Segundo (2015-01), Lee Ranch (19-2P)
Wyoming
$790,279,323
Caballo (433-T7), North Antelope-Rochelle
(569-T8), Rawhide (240-T7), School Creek (764-T2),
Shoshone I (477-T7)
TOTAL
$1,106,718,756
Although all indications are that Peabody Energy no longer qualifies for self-bonding
pursuant to SMCRA regulations, the company has not notified regulatory authorities in these
9
Desjardins, D., “Peabody Energy is the Next Coal Company to go Bankrupt,” Seeking Alpha (Jan. 28, 2016), available online at http://seekingalpha.com/article/3841246-peabody-energy-next-coal-company-go-bankrupt. Attached as Exhibit 5.
10 Jarzemsky, M., “Peabody Energy to Draw Down Rest of $1.65 Billion Revolving Loan,” Wall Street Journal
(Feb. 10, 2016), available online at http://www.wsj.com/articles/peabody-energy-to-draw-down-rest-of-1-65-billion-revolving-loan-1455147340. Attached as Exhibit 6.
11 Davis, M., S. Natarajan, and T. Loh, “Peabody Mine Sale Said to Hit Snag as Bowie Stalls on Financing,”
Bloomberg Business (Feb. 20, 2016), available online at http://www.bloomberg.com/news/articles/2016-02-20/peabody-mine-sale-said-to-hit-snag-as-bowie-pauses-on-financing. Attached as Exhibit 7.
12
Supra. Note 4.
13 Interstate Mining Compact Commission, “Self-bonding Survey,” available at http://imcc.isa.us/Self%20Bonding%20Survey.pdf. Attached as Exhibit 8.
6
states that it does not qualify. Further, Peabody has not posted alternate bonds for the
aforementioned mining and reclamation operations.
In fact, Peabody claims these states have continued to determine that the company
qualifies for self-bonding, even though it clearly does not. Most recently, Peabody asserted that
the State of Wyoming re-affirmed the company’s self-bonding of its North Antelope-Rochelle
and Rawhide mining operations in the state.
14The company also asserted that the State of New
Mexico approved of its self-bonding.
15However, there is no indication that Peabody provided
notification to the states of Wyoming or New Mexico, or the state of Colorado for that matter,
that the company does not actually qualify for self-bonding. Regardless of the opinions of
regulators in the states of Colorado, New Mexico, or Wyoming, the obligation remains upon
Peabody to provide proper notification when the company no longer qualifies for self-bonding
and to take steps to ensure adequate bonds are in place.
Furthermore, the circumstances that have rendered Peabody ineligible for self-bonding
show no signs of dissipating. As indicated above, even though the company has expressed its
intent to sell its Colorado and New Mexico assets, this sale would not eliminate sufficient
bonding obligations to render the company eligible for self-bonding again. Additionally, there is
skepticism that this deal may even go through and suggestions that Peabody may file for
bankruptcy in the next few days.
16If Peabody Energy files for bankruptcy, its subsidiary,
Peabody Investments Corporation, will surely also file.
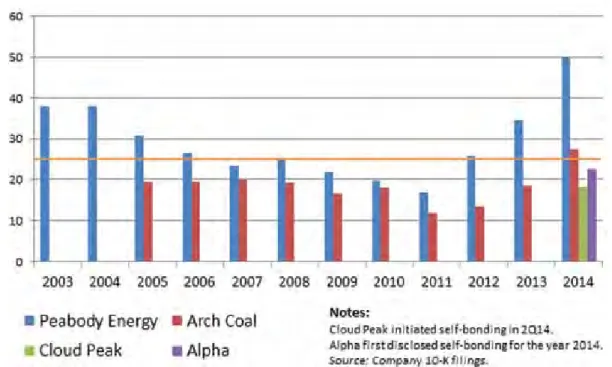
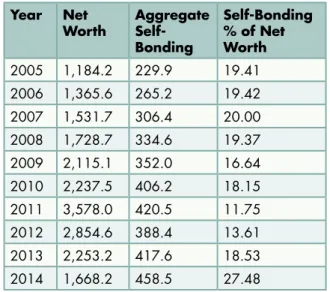
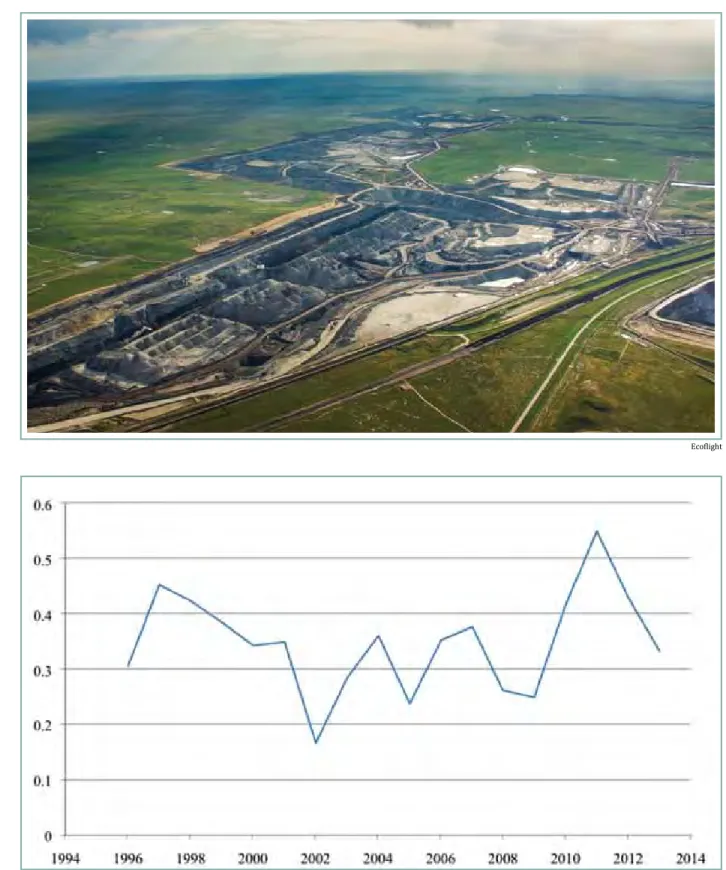
It is important to note that Peabody’s financial status in relation to the company’s
self-bonding is not a new development. In early 2015, the National Wildlife Federation, Western
Organization of Resource Councils, and the Natural Resources Defense Council released a report
detailing signs that Peabody no longer meets the financial criteria for self-bonding.
17Among
other things, the report disclosed that Peabody’s total self-bonding obligations have exceeded
25% of the company’s net worth since at least 2012.
See
Graph below. Thus, Peabody’s failure
to provide proper notification to regulatory authorities and to post alternate bonds appears to be
longstanding.
14
Supra. Note 3.
15 Supra. Note 4.
16 WYCO Researcher, “Peabody Energy Could File for Bankruptcy Unless Bowie Gets Financing,” Seeking Alpha
(Feb. 8, 2016), available at http://seekingalpha.com/article/3872816-peabody-energy-file-bankruptcy-unless-bowie-gets-financing.
17
National Wildlife Federation, Western Organization of Resource Councils, and Natural Resources Defense Council, “Undermined Promise II” (2015), report available at
7
IV.
VIOLATIONS OF SMCRA
Based on the aforementioned information, there is reason to believe that Peabody Energy
is in violation of SMCRA with regards to bonding at its permitted coal mining and reclamation
operations in Colorado, New Mexico, and Wyoming. Peabody Energy clearly no longer has a
history of financial solvency, rendering the company ineligible for self-boning under SMCRA
pursuant to 30 U.S.C. § 1259(c) and 30 C.F.R. § 800.23. In spite of this, Peabody has failed to
provide notification to state regulatory authorities that the company no longer qualifies for
self-bonding at its permitted operations, and to post alternate bonds within 90 days, a violation of 30
C.F.R. § 800.23(g). Peabody’s violations of SMCRA apply to the following permitted coal
mines:
8
Mine Name
Permit No.
Subsidiary Owner
State County
Foidel Creek
C-1982-056
Twentymile Coal, LLC
CO
Routt
Sage Creek
C-2009-087
Peabody Sage Creek
Mining, LLC
CO
Routt
Seneca
C-1982-057
Seneca Coal Company,
LLC
CO
Routt
Yoast
C-1994-082
Seneca Coal Company,
LLC
CO
Routt
Williams Fork
C-1981-044
Moffat County Mining,
LLC
CO
Moffat
El Segundo
2015-01
Peabody Natural
Resources Co.
NM
McKinley
Lee Ranch
19-2P
Peabody Natural
Resources Co.
NM
McKinley
Caballo
433-T7
Peabody Caballo
Mining, LLC
WY
Campbell
North Antelope-Rochelle
569-T8
Peabody Powder River
Mining, LLC
WY
Campbell
Rawhide
240-T7
Peabody Caballo
Mining, LLC
WY
Campbell
School Creek
764-T2
Peabody Powder River
Mining, LLC
WY
Campbell
Shoshone I
477-T7
Shoshone Coal Corp.
WY
Carbon
The failure of Peabody Energy to ensure adequate reclamation bonding harms WildEarth
Guardians and its members in a number of ways. WildEarth Guardians is a nonprofit
environmental advocacy group that is dedicated to protecting wildlife, wild places, wild rivers,
and the health of the American West. If the company ultimately dissolves and leaves reclamation
obligations, then there is no certainty that full coal mine clean ups will be completed and no
guarantee that the environment will be protected. This raises concerns that wildlife, wild places,
wild rivers, and health stand to suffer.
9
V.
CONCLUSION
With Peabody Energy sliding closer to bankruptcy, the need to ensure adequate bonding
is critical. Guaranteeing coal mine reclamation in order to protect society and the environment is
a cornerstone of SMCRA. If the aforementioned SMCRA violations are not resolved, WildEarth
Guardians intends to file suit in federal court against Peabody Energy after sixty days in
accordance with 30 U.S.C. § 1270(a)(1). If there are any questions or concerns, or if Peabody
Energy wishes to discuss the matters set forth in this notice letter, please contact WildEarth
Guardians at the information below.
Sincerely,
Jeremy Nichols
Climate and Energy Program Director
WildEarth Guardians
1536 Wynkoop, Suite 310
Denver, CO 80202
(303) 437-7663
cc via certified mail, return receipt requested:
Sally Jewell
Secretary
U.S. Department of the Interior
1849 C St. NW
Washington, D.C. 20240
Joe Pizarchik
Director
Office of Surface Mining Reclamation and
Enforcement
1951 Constitution Ave. NW
Washington, D.C. 20240
Dave Berry
Regional Director
Office of Surface Mining Reclamation and
Enforcement
1999 Broadway, Suite 3320
Denver, CO 80202
Ginny Brannon
Director
Colorado Division of Reclamation Mining and
Safety
1313 Sherman St., Rm. 215
Denver, CO 80203
Kyle Wendtland
Administrator
Wyoming Land Quality Division
200 West 17
thSt., Lower Level
Cheyenne, Wy 82002
Fernando Martinez
Director
New Mexico Mining and Minerals Division
Wendell Chino Building, Third Floor
1220 South St. Francis Drive
1
News Release
CONTACT:
Vic Svec
(314) 342-7768
FOR IMMEDIATE RELEASE
February 11, 2016
PEABODY ENERGY ANNOUNCES RESULTS
FOR THE YEAR ENDED DECEMBER 31, 2015
2015 revenues of $5.61 billion lead to Adjusted EBITDA of $434.6 million, including
$23.5 million in restructuring charges
Diluted Loss Per Share from Continuing Operations totals $(102.62); Adjusted Diluted
EPS totals $(36.39)
Australian costs per ton improve 24% to record low for platform; U.S. costs per ton
improve 5% even with lower volumes; Capital spending declines 35% to $127 million
2016 targets include 18 to 28 million ton decline in U.S.; Reduced hedging losses;
Lower SG&A expense
Amid difficult market conditions, additional aggressive steps underway to improve
the business, preserve liquidity and reduce debt
ST. LOUIS, Feb. 11 –
Peabody Energy (NYSE: BTU) today reported full-year 2015 revenues of
$5.61 billion. Adjusted EBITDA totaled $434.6 million, which includes $23.5 million in
restructuring charges related to reductions in corporate and regional staff and Australian Mining
Operations. Full-year Adjusted EBITDA excludes the impact of $1.28 billion in charges related
to asset impairments. Diluted Loss Per Share from Continuing Operations totaled $(102.62)
and Adjusted Diluted EPS totaled $(36.39).
“Against a brutal industry backdrop, the Peabody team delivered a strong operating
performance as we improved safety, achieved over $620 million in lower costs, further reduced
capital, streamlined the organization and advanced multiple work streams to address our
portfolio and financial objectives,” said Peabody Energy President and Chief Executive Officer
Glenn Kellow. “It is clear that more must be done, and we are taking further steps to confront a
prolonged industry downturn by targeting additional cost reductions, advancing non-core asset
sales and pursuing aggressive actions to preserve liquidity and delever our balance sheet.”
RESULTS FROM CONTINUING OPERATIONS
2015 revenues totaled $5.61 billion compared with $6.79 billion in the prior year due to
lower realized pricing in the U.S. and Australia and a 21.0 million ton decline in sales. These
factors drove full-year Adjusted EBITDA down 47 percent to $434.6 million as approximately
2
$620 million in cost improvements mitigated more than $450 million in lower pricing and $387.2
million in hedge losses compared to the prior year. Adjusted EBITDA also includes $23.5
million in charges related to reductions in corporate and regional staff and Australian Mining
Operations.
In the fourth quarter, Adjusted EBITDA declined 59 percent from the third quarter to
$53.0 million as a result of a $32.8 million reduction in Trading and Brokerage results, a $14.3
million charge related to the assignment of excess Australian port capacity, a decline in U.S.
shipments and a decrease in Australian pricing. U.S. sales were impacted by lower energy
demand, declining natural gas prices and high customer stockpiles that resulted in
approximately 4 million tons of deferrals from the fourth quarter, with a significant portion of the
deferrals occurring in December.
2015 U.S. Mining Adjusted EBITDA declined $145.6 million to $937.2 million, primarily
due to a 13.5 million ton volume decrease as a result of lower utility coal demand based on
natural gas prices and a planned reduction in volumes associated with export shipments from
the Twentymile Mine. U.S. Mining costs per ton improved 5 percent as a result of lower fuel
expense and cost savings initiatives.
Despite approximately $420 million in impacts from lower pricing, 2015 Australian Mining
Adjusted EBITDA increased $62.4 million to $175.4 million on sharply lower costs. Cost
improvements included the benefit of a weaker Australian dollar, lower fuel prices, operational
improvements and mine plan changes announced previously in the year. These resulted in
record low costs for this platform of $51.07 per ton, even with lower volumes. 2015 Australian
Metallurgical gross margins were adversely impacted by over $2.50 per ton from the Burton
Mine, the company’s only contractor-operated mine. Australian volumes decreased to 35.8
million tons and included 15.7 million tons of metallurgical coal sold at $75.04 per ton and 12.6
million tons of export thermal coal at $53.76 per ton, with the remainder delivered under
domestic thermal contracts.
Trading and Brokerage Adjusted EBITDA for 2015 increased $12.1 million to $27.0
million, primarily due to favorable trading activities and a $7 million litigation settlement benefit
recorded in the third quarter.
Full-year results include impairment charges of $1.28 billion, including $377.0 million in
the fourth quarter. Full-year impairment charges included $969.2 million largely related to
certain Australian metallurgical coal assets and $308.6 million primarily from certain
non-producing reserve and non-mining assets in the United States. Results also include $67.8
million in debt extinguishment charges from refinancing the company’s 2016 Senior Notes in the
first half of 2015. Peabody’s 2015 tax benefit totaled $135.0 million compared to a tax provision
of $201.2 million the prior year. The changes include a $75.3 million benefit related to
3
impairments recorded in 2015 as well as a $284.0 million valuation allowance recorded in 2014
against deferred U.S. income tax assets.
Loss from Continuing Operations totaled $1.86 billion compared to $749.1 million in the
prior year. Diluted Loss from Continuing Operations totaled $(102.62) per share and Adjusted
Diluted EPS totaled $(36.39), which reflects adjustments from the 1-for-15 reverse stock split
enacted in the fourth quarter. Loss from Discontinued Operations totaled $182.2 million.
2015 Operating Cash Flows reflect a usage of $14.4 million as cash generated by the
operations was not sufficient to cover cash interest and health benefit trust payments. Proceeds
from property disposals generated approximately $70 million in cash, while capital spending of
$126.8 million was at the lowest level since 2001.
Regarding the company’s liquidity position:
Liquidity totaled $1.20 billion at the end of December. Peabody also had $709.0 million
in letters of credit.
The company accessed the remaining capacity under its $1.65 billion revolving credit
facility, which provides Peabody with the maximum amount of control and flexibility with
respect to its liquidity position in light of continued challenging market conditions.
As of Feb. 9, 2016, liquidity totaled $902.6 million, which consisted of $778.5 million in
cash, $123.0 million available under the company’s accounts receivable securitization and the
remainder under the revolving credit facility. Peabody also had $823.7 million in letters of credit.
Peabody has previously disclosed that reported Adjusted EBITDA differs from the credit
agreement terms used for calculating compliance. The adjustments may include, in certain
instances, cash proceeds from asset monetization activities.
Peabody continues to qualify for self-bonding in all relevant states and, in the fourth
quarter, the state of Wyoming reaffirmed self-bonding eligibility for the North Antelope Rochelle
and Rawhide surface mines.
GLOBAL COAL MARKETS
Slowing global economic growth drove a wide range of commodity prices lower in 2015,
resulting in the largest broad commodity market decline since 1991. Seaborne coal prices
continued to fall in 2015 as a reduction in Chinese imports more than offset supply cutbacks,
and U.S. coal demand was impacted by lower natural gas prices.
Within seaborne metallurgical coal markets, domestic Chinese steel demand declined
approximately 5 percent in 2015 due to reduced economic growth and oversupply in the
property sector, while steel production declined 2 percent. As a result, China was a net exporter
of “refined” metallurgical coal in 2015 as steel exports increased 20 percent to a new record of
110 million tonnes, while Chinese metallurgical coal imports decreased more than 20 percent.
4
Metallurgical coal price settlements declined throughout the year, and first quarter 2016
settlements for premium hard coking coal fell 9 percent to $81 per tonne. The benchmark for
low-vol PCI eased from $71 to $69 per tonne, showing relative strength to the premium coking
coal product. Seaborne metallurgical coal demand declined approximately 15 million tonnes in
2015 resulting in accelerated production cutbacks primarily in the U.S. and Canada. Peabody
projects modest seaborne metallurgical coal supply reductions in 2016 as further declines in the
U.S. overcome small production increases from other exporting nations.
In seaborne thermal coal markets, demand declined 8 percent on a nearly 75 million
tonne reduction in Chinese imports, lower European demand and a decline in international
liquefied natural gas prices. The overall decline in seaborne thermal demand primarily impacted
U.S. and Indonesian exports, which were down 41 percent and 23 percent, respectively.
Within U.S. coal markets, demand from electric utilities declined approximately 110
million tons in 2015 on mild weather and lower natural gas prices. Natural gas prices fell nearly
40 percent in 2015 to an average of $2.63 per mm/Btu, which drove coal’s share of electricity
generation in the power sector down to 34 percent compared with 40 percent in the prior year.
U.S. coal production declined approximately 105 million tons in 2015 as production cutbacks
accelerated during the year. As a result, fourth quarter production was down approximately 50
million tons compared with the same period in 2014. Despite supply rationalizations, reduced
coal demand led to utility inventories rising nearly 30 percent above prior-year levels.
Peabody expects 2016 U.S. utility coal consumption to decline approximately 40 to 60
million tons based on projected plant retirements and lower natural gas prices. The decline in
demand, combined with an expected significant reduction in utility stockpiles and lower exports,
is projected to result in a 150 to 170 million ton decline in 2016 U.S. coal shipments. As a
result, Peabody is lowering its 2016 U.S. sales targets by 13 percent at the midpoint, and is now
fully priced for the year.
2016 CORE PRIORITIES
Peabody achieved a number of accomplishments in 2015, and the company is
expanding on previous successes with a major focus on operational, portfolio and financial
initiatives across the business.
Core priorities for 2016 include:
Driving continuous improvement in safety, productivity and costs
. In 2015,
Peabody transformed its operations to respond to difficult market conditions. The
company set a new record for safety, with a 13 percent reduction in the global safety
incidence rate to 1.25 per 200,000 hours worked for employees and contractors. In the
U.S. and Australia, Peabody improved costs by 5 percent and 24 percent, respectively,
and gross margins across four of the company’s five operating segments averaged 26
5
percent. 2015 capital spending declined 35 percent, and extensive efforts were
advanced to streamline the organization leading to a 22 percent reduction in SG&A
expenses, the lowest levels in nearly a decade. Given ongoing market challenges, the
company continues to drive cost improvements at all levels of the organization.
Preserving liquidity while reducing debt
. The company continued to preserve
liquidity in 2015 by completing a bond offering, modifying its credit agreement, reducing
costs and lowering capital spending. Peabody and its advisors are currently in
discussions with debt holders to evaluate financial alternatives, including potential debt
exchanges, debt buybacks and new financing, to preserve liquidity and delever the
balance sheet. Peabody also has a number of committed obligations that expire or
meaningfully decline in the next two years:
o
The company’s final PRB reserve installment of approximately $250 million is
scheduled to be paid in the second half of 2016. The payment is related to the
company’s last lease-by-application process in 2012. As a result of investments
in prior years, Peabody’s PRB reserves represent more than 25 years of current
production, which provides a competitive advantage relative to other producers.
o
Peabody’s existing currency and fuel hedges decline in 2016 and expire by the
end of 2017. As these positions expire, the company expects progressively
lower cash settlements in 2016 and 2017 relative to realized 2015 hedge losses
of $436.8 million.
o
The company proactively assigned excess Australian port capacity to another
producer, which is expected to reduce infrastructure costs by approximately $60
million through 2020. In addition, Peabody recently amended contracts to reduce
certain U.S. transportation and logistics costs expected to be due in early 2017.
In connection with these amendments, Peabody will realize a net reduction of
approximately $45 million in estimated liquidated damage payments that
otherwise would have become due in early 2017.
o
The company recently amended its 2013 agreement with the United Mine
Workers of America, improving Peabody’s expected 2017 cash flows by $70
million while deferring the 2016 payments over 10 months.
Reshaping the portfolio to unlock value
. Peabody announced the planned sale of its
New Mexico and Colorado assets for $358 million in November, and the purchaser is
currently arranging financing. Peabody also announced plans to divest its interest in the
Prairie State Energy Campus for $57 million. In 2015, the company realized cash
proceeds of $70 million related to its ongoing resource management activities through
the sale of surplus land and coal reserves. Peabody continues to evaluate its portfolio to
6
target the best markets, with a filter that includes strategic fit, value consideration,
growth and cash requirements as the company further emphasizes its core mining
assets in the PRB, Illinois Basin and Australia.
OUTLOOK
Peabody has lowered 2016 U.S. sales guidance by 18 to 28 million tons below 2015
levels. As a result, projected 2016 U.S. production is now fully priced, with 2017 production 35
to 45 percent unpriced based on targeted 2016 production levels. After incorporating deferrals
to later periods and a change in customer mix, Peabody now has 116 million tons of PRB priced
for 2016 delivery at an average of $13.30 per ton.
2016 U.S. revenues and costs per ton targets primarily reflect a reduced proportion of
PRB sales compared to 2015. In the PRB, the company is working to optimize production
levels and mix at the North Antelope Rochelle Mine to maximize margins. 2016 guidance
includes the contributions from mines in Colorado and New Mexico, for which a sales
agreement is in place.
In Australia, Peabody is lowering targeted metallurgical coal production levels in 2016 to
reflect operational changes made in 2015, which is expected to result in lower PCI sales. The
company also plans to place the Burton Mine on care and maintenance by the end of 2016.
Peabody expects first quarter Adjusted EBITDA to reflect current reduced seaborne coal
pricing, lower PRB volumes, the impact of planned longwall moves at the Wambo and
Twentymile mines, and the realization of fuel and currency hedges that are expected to improve
each quarter as the year progresses. While cost improvements continue to remain a priority for
Peabody, current pricing levels are a strong headwind. The company also expects to have an
approximately $70 million benefit to continuing operations from the recently amended 2013
agreement with the United Mine Workers of America.
2016 Guidance Sales Volumes (tons in millions)
U.S. Australia
Trading & Brokerage Total 150 – 160 34 – 36 11 – 14 195 – 210 U.S. Operations
Revenues Per Ton
Costs Per Ton $19.65 – $19.95 $14.70 – $15.00
Australia Operations
Metallurgical Coal Sales Export Thermal Coal Sales Domestic Thermal Coal Sales Costs Per Ton
14 – 15 million tons 12 – 13 million tons
~8 million tons $45 – $48
Selling & Administrative Expenses
7
Depreciation, Depletion and Amortization
$470 – $530 million
Capital Expenditures $120 – $140 million
Notes: Peabody classifies its Australian mines with the Australian Metallurgical or Thermal Mining segments based on the primary customer base and reserve type. A small portion of the coal mined by the Australian Metallurgical Mining segment is of a thermal grade and vice versa. Also, Peabody may market some of its metallurgical coal products as a thermal product from time to time depending on market conditions.
Peabody Energy is the world’s largest private-sector coal company and a global leader
in sustainable mining, energy access and clean coal solutions. The company serves
metallurgical and thermal coal customers in 25 countries on six continents. For further
information, visit PeabodyEnergy.com.
-End-
Certain statements in this press release are forward-looking as defined in the Private Securities Litigation Reform Act of 1995. The company uses words such as “anticipate,” “believe,” “expect,” “may,” “forecast,” “project,” “should,” “estimate,” “plan,” “outlook,” “target,” “likely,” “will,” “to be” or other similar words to identify forward-looking
statements. These forward-looking statements are based on numerous assumptions that the company believes are reasonable, but they are open to a wide range of uncertainties and business risks that may cause actual results to differ materially from expectations as of Feb. 11, 2016. These factors are difficult to accurately predict and may be beyond the company’s control. The company does not undertake to update its forward-looking statements. Factors that could affect the company’s results include, but are not limited to: supply and demand for the company’s coal products; price volatility and customer procurement practices, particularly in international seaborne products and in the company’s trading and brokerage businesses; impact of alternative energy sources, including natural gas and renewables; global steel demand and the downstream impact on metallurgical coal prices; impact of weather and natural disasters on demand, production and transportation; reductions and/or deferrals of purchases by major customers and the company’s ability to renew sales contracts; credit and performance risks associated with customers, suppliers, contract miners, co-shippers, and trading, banks and other financial counterparties; geologic, equipment, permitting,site access, operational risks and new technologies related to mining; transportation availability, performance and costs; availability, timing of delivery and costs of key supplies, capital equipment or commodities such as diesel fuel, steel, explosives and tires; impact of take-or-pay agreements for rail and port commitments for the delivery of coal; successful implementation of business strategies, including, without limitation, the actions we are implementing to improve our organization and respond to current market conditions; negotiation of labor contracts, employee relations and workforce availability; our ability to successfully consummate the planned sale of our assets in New Mexico and Colorado (including the purchaser's ability to successfully obtain financing) and the divestiture of our interest in the Prairie State Energy Campus; changes in postretirement benefit and pension obligations and their related funding requirements; replacement and development of coal reserves; our ability to successfully negotiate transactions with our debt holders, including debt exchanges and debt buybacks; adequate liquidity and the cost, availability and access to capital and financial markets, including our ability to secure new financing; ability to appropriately secure the company’s obligations for reclamation, federal and state workers’ compensation, federal coal leases and other obligations related to our operations, including our ability to remain eligible for self-bonding and/or successfully access the commercial surety market; impacts of the degree to which we are leveraged and our ability to comply with financial and other restrictive covenants in our credit agreement; effects of changes in interest rates and currency exchange rates (primarily the Australian dollar); effects of acquisitions or divestitures; economic strength and political stability of countries in which the company has operations or serves customers; legislation, regulations and court decisions or other government actions, including, but not limited to, new environmental and mine safety requirements, changes in income tax regulations, sales-related royalties, or other regulatory taxesand changes in derivative laws and regulations; any additional liabilities or obligations that we may have as a result of the Patriot Coal bankruptcy, including, without limitation, as a result of litigation filed by third parties in relation to that bankruptcy; litigation, including claims not yet asserted; terrorist attacks or security threats, including cybersecurity threats; impacts of pandemic illnesses; and other risks detailed in the company’s reports filed with the Securities and Exchange Commission (SEC).
Included in the company’s release of financial information accounted for in accordance with generally accepted accounting principles (GAAP) are certain non-GAAP financial measures, as defined by SEC regulations. The company has defined below the non-GAAP financial measures that are used and has included in the tables following this release reconciliations of these measures to the most directly comparable GAAP measures.
8 Adjusted EBITDA is used by management as the primary metric to measure our segments’ operating performance. We also believe non-GAAP performance measures are used by investors to measure operating performance and lenders to measure our ability to incur and service debt. Adjusted EBITDA is defined as (loss) income from continuing operations before deducting net interest expense, income taxes, asset retirement obligation expense, depreciation, depletion and amortization, asset impairment and mine closure costs, charges for the settlement of claims and litigation related to previously divested operations and changes in deferred tax asset valuation allowance and amortization of basis difference related to equity affiliates. A reconciliation of income (loss) from continuing operations to Adjusted EBITDA is included in this release. Adjusted EBITDA is not intended to serve as an alternative to U.S. GAAP measures of performance and may not be comparable to similarly-titled measures presented by other companies.
Adjusted (Loss) Income from Continuing Operations and Adjusted Diluted EPS are defined as (loss) income from continuing operations and diluted earnings per share from continuing operations, respectively, excluding the impacts of asset impairment and mine closure costs and charges for the settlement of claims and litigation related to
previously divested operations, net of tax, and the remeasurement of foreign income tax accounts on the company’s income tax provision. The company calculates income tax benefits related to asset impairment and mine closure costs and charges for the settlement of claims and litigation related to previously divested operations based on the enacted tax rate in the jurisdiction in which they have been or will be realized, adjusted for the estimated
recoverability of those benefits. Management also believes that excluding the impact of the remeasurement of foreign income tax accounts represents a meaningful indicator of the company's ongoing effective tax rate.
9
Condensed Consolidated Statements of Operations (Unaudited)For the Quarters and Years Ended Dec. 31, 2015 and 2014
(In Millions, Except Per Share Data)
Quarter Ended Year Ended
Dec. Dec. Dec. Dec.
2015 2014 2015 2014
Tons Sold 57.9 64.3 228.8 249.8
Revenues $ 1,313.1 $ 1,684.5 $ 5,609.2 $ 6,792.2
Operating Costs and Expenses (1) 1,233.3 1,401.2 5,007.7 5,716.9
Depreciation, Depletion and Amortization 141.6 171.8 572.2 655.7 Asset Retirement Obligation Expenses 5.1 34.5 45.5 81.0 Selling and Administrative Expenses 47.6 55.5 176.4 227.1 Restructuring and Pension Settlement Charges 0.5 26.0 23.5 26.0 Other Operating (Income) Loss:
Net Gain on Disposal of Assets (24.8) (15.5) (45.0) (41.4)
Asset Impairment 377.0 154.4 1,277.8 154.4
Loss from Equity Affiliates:
Results of Operations (1) 3.5 9.6 12.0 49.6
Change in Deferred Tax Asset Valuation Allowance (0.6) 52.3 (1.0) 52.3
Amortization of Basis Difference 0.7 1.7 4.9 5.7
Loss from Equity Affiliates 3.6 63.6 15.9 107.6
Operating Loss (470.8) (207.0) (1,464.8) (135.1)
Interest Income (1.1) (3.7) (7.7) (15.4)
Interest Expense:
Interest Expense 121.4 103.7 465.0 414.0
Interest Charges Related to Litigation — 1.5 0.4 12.6
Loss on Debt Extinguishment — — 67.8 1.6
Interest Expense 121.4 105.2 533.2 428.2
Loss from Continuing Operations Before Income Taxes (591.1) (308.5) (1,990.3) (547.9) Income Tax (Benefit) Provision:
(Benefit) Provision (44.4) 169.1 (59.2) 203.9
Tax Benefit Related to Asset Impairment (7.9) — (75.3) — Remeasurement Expense (Benefit) Related to Foreign Income Tax
Accounts 0.5 1.2 (0.5) (2.7)
Income Tax (Benefit) Provision (51.8) 170.3 (135.0) 201.2 Loss from Continuing Operations, Net of Income Taxes (539.3) (478.8) (1,855.3) (749.1) Income (Loss) from Discontinued Operations, Net of Income Taxes 20.5 (34.2) (182.2) (28.2)
Net Loss (518.8) (513.0) (2,037.5) (777.3)
Less: Net (Loss) Income Attributable to Noncontrolling Interests (0.8) 1.6 7.1 9.7 Net Loss Attributable to Common Stockholders $ (518.0) $ (514.6) $ (2,044.6) $ (787.0)
Adjusted EBITDA $ 53.0 $ 207.7 $ 434.6 $ 814.0
Diluted EPS - Loss from Continuing Operations (2)(3) $ (29.55) $ (26.88) $ (102.62) $ (42.52)
Diluted EPS - Net Loss Attributable to Common Stockholders (2) $ (28.43) $ (28.79) $ (112.66) $ (44.09)
Adjusted Diluted EPS (2) $ (9.27) $ (18.18) $ (36.39) $ (34.03)
(1) Excludes items shown separately.
(2) Weighted average diluted shares outstanding were 18.2 million and 17.9 million for the quarters ended Dec. 31, 2015 and 2014, respectively, and 18.1 million and 17.9 million for the years ended Dec. 31, 2015 and 2014, respectively,as retroactively restated to reflect the company's 1-for-15 reverse stock split that became effective on Oct. 1, 2015.
(3) Reflects loss from continuing operations, net of income taxes less net (loss) income attributable to noncontrolling interests.
10
Supplemental Financial Data (Unaudited)For the Quarters and Years Ended Dec. 31, 2015 and 2014
Quarter Ended Year Ended
Dec. Dec. Dec. Dec.
2015 2014 2015 2014
Revenue Summary (In Millions)
U.S. Mining Operations $ 840.4 $ 983.6 $ 3,529.4 $ 4,023.8
Australian Mining Operations 465.6 676.3 2,005.4 2,671.8
Trading and Brokerage Operations 0.1 12.1 42.8 58.4
Other 7.0 12.5 31.6 38.2
Total $ 1,313.1 $ 1,684.5 $ 5,609.2 $ 6,792.2
Tons Sold (In Millions)
Powder River Basin Mining Operations 35.7 37.3 138.8 142.6
Midwestern U.S. Mining Operations 4.6 6.1 21.2 25.0
Western U.S. Mining Operations 4.2 5.8 17.9 23.8
Australian Metallurgical Mining Operations 4.0 4.8 15.7 17.2
Australian Thermal Mining Operations 5.1 5.5 20.1 21.0
Trading and Brokerage Operations 4.3 4.8 15.1 20.2
Total 57.9 64.3 228.8 249.8
Revenues per Ton - Mining Operations
Powder River Basin (1) $ 13.23 $ 13.02 $ 13.45 $ 13.49
Midwestern U.S. (2) 45.59 45.99 46.18 47.99 Western U.S. 37.30 37.86 38.09 37.90 Total - U.S. (1)(2) 18.87 20.02 19.84 21.03 Australian Metallurgical 64.63 87.97 75.04 93.81 Australian Thermal 40.71 46.39 41.00 50.46 Total - Australia 51.18 65.97 55.96 69.99
Operating Costs per Ton - Mining Operations (3)
Powder River Basin (1) $ 9.64 $ 9.62 $ 9.97 $ 9.92
Midwestern U.S. 34.64 34.31 33.49 35.70 Western U.S. 28.43 28.08 27.78 26.69 Total - U.S. (1) 14.01 14.84 14.57 15.37 Australian Metallurgical 68.65 84.33 76.20 102.60 Australian Thermal 32.95 35.40 31.36 37.87 Total - Australia 48.58 58.44 51.07 67.03
Gross Margin per Ton - Mining Operations (3)
Powder River Basin (1) $ 3.59 $ 3.40 $ 3.48 $ 3.57
Midwestern U.S. (2) 10.95 11.68 12.69 12.29 Western U.S. 8.87 9.78 10.31 11.21 Total - U.S. (1)(2) 4.86 5.18 5.27 5.66 Australian Metallurgical (4.02) 3.64 (1.16) (8.79) Australian Thermal 7.76 10.99 9.64 12.59 Total - Australia 2.60 7.53 4.89 2.96
Other Supplemental Financial Data (In Millions)
Adjusted EBITDA - U.S. Mining $ 216.2 $ 254.3 $ 937.2 $ 1,082.8
Adjusted EBITDA - Australian Mining 23.7 77.3 175.4 113.0
Adjusted EBITDA - Trading and Brokerage (3.4) 7.2 27.0 14.9
Adjusted EBITDA - Resource Management (4) 14.9 16.2 32.2 30.9
Corporate Hedging Results (110.2) (42.4) (436.8) (49.6)
Selling and Administrative Expenses (47.6) (55.5) (176.4) (227.1)
Restructuring and Pension Charges (0.5) (26.0) (23.5) (26.0)
Other Operating Costs, Net (5) (40.1) (23.4) (100.5) (124.9)
Adjusted EBITDA 53.0 207.7 434.6 814.0
Operating Cash Flows 76.2 86.5 (14.4) 336.6
Acquisitions of Property, Plant and Equipment 49.9 86.9 126.8 194.4
Coal Reserve Lease Expenditures 187.4 187.3 277.2 276.7
(1) The finalization of pricing under a customer sales agreement resulted in additional Powder River Basin revenues per ton, operating costs per ton, and gross margin per ton of $0.23, $0.04, and $0.19, respectively, for the year ended Dec. 31, 2014. The impact on Total - U.S. revenues per ton, operating costs per ton, and gross margin per ton was $0.18, $0.04, and $0.14, respectively, for that period.
(2) The finalization of pricing under a customer sales agreement resulted in lower Midwestern U.S. revenues per ton and gross margin per ton of $1.56 for the quarter ended Dec. 31, 2014. The impact on Total - U.S. revenues per ton and gross margin per ton was $0.19 for that period.
(3) Includes revenue-based production taxes and royalties; excludes depreciation, depletion and amortization; asset retirement obligation expenses; selling and administrative expenses; restructuring and pension settlement charges; asset impairment; and certain other costs related to post-mining activities.
(4) Includes certain asset sales, property management costs and revenues, and coal royalty expense.
(5) Includes loss from equity affiliates (before the impact of related changes in deferred tax asset valuation allowance and amortization of basis difference), costs associated with post-mining activities, and minimum charges on certain transportation-related contracts.
11
Condensed Consolidated Balance SheetsAs of Dec. 31, 2015 and 2014 (In Millions)
(Unaudited)
Dec. 31, 2015 Dec. 31, 2014
Cash and Cash Equivalents $ 261.3 $ 298.0
Accounts Receivable, Net 221.3 563.1
Inventories 307.8 406.5
Deferred Income Taxes 53.5 80.0
Other Current Assets 402.1 363.4
Total Current Assets 1,246.0 1,711.0
Property, Plant, Equipment and Mine Development, Net 9,258.5 10,577.3
Deferred Income Taxes 2.2 0.7
Investments and Other Assets 466.0 902.1
Total Assets $ 10,972.7 $ 13,191.1
Current Portion of Long-Term Debt $ 23.0 $ 21.2
Accounts Payable and Accrued Expenses 1,446.3 1,809.2
Other Current Liabilities 15.6 32.7
Total Current Liabilities 1,484.9 1,863.1
Long-Term Debt, Less Current Portion 6,292.6 5,965.6
Deferred Income Taxes 69.1 89.1
Other Noncurrent Liabilities 2,256.2 2,546.8
Total Liabilities 10,102.8 10,464.6
Stockholders' Equity 869.9 2,726.5
Total Liabilities and Stockholders' Equity $ 10,972.7 $ 13,191.1
12
Reconciliation of Non-GAAP Financial Measures (Unaudited)For the Quarters and Years Ended Dec. 31, 2015 and 2014
(In Millions, Except Per Share Data) Quarter Ended Year Ended
Dec. Dec. Dec. Dec.
2015 2014 2015 2014
Adjusted EBITDA $ 53.0 $ 207.7 $ 434.6 $ 814.0
Depreciation, Depletion and Amortization 141.6 171.8 572.2 655.7
Asset Retirement Obligation Expenses 5.1 34.5 45.5 81.0
Change in Deferred Tax Asset Valuation Allowance Related to Equity
Affiliates (0.6) 52.3 (1.0) 52.3
Amortization of Basis Difference Related to Equity Affiliates 0.7 1.7 4.9 5.7
Interest Income (1.1) (3.7) (7.7) (15.4)
Interest Expense 121.4 105.2 533.2 428.2
Income Tax (Benefit) Provision, Excluding Tax Items Shown Separately
Below (44.4) 169.1 (59.2) 203.9
Adjusted Loss from Continuing Operations (1) (169.7) (323.2) (653.3) (597.4)
Asset Impairment 377.0 154.4 1,277.8 154.4
Tax Benefit Related to Asset Impairment (7.9) — (75.3) —
Remeasurement Expense (Benefit) Related to Foreign Income Tax Accounts 0.5 1.2 (0.5) (2.7)
Loss from Continuing Operations, Net of Income Taxes $ (539.3) $ (478.8) $ (1,855.3) $ (749.1)
Net (Loss) Income Attributable to Noncontrolling Interests $ (0.8) $ 1.6 $ 7.1 $ 9.7
Diluted EPS - Loss from Continuing Operations (2) $ (29.55) $ (26.88) $ (102.62) $ (42.52)
Asset Impairment, Net of Income Taxes 20.25 8.62 66.26 8.63
Remeasurement Expense (Benefit) Related to Foreign Income Tax Accounts 0.03 0.08 (0.03) (0.14)
Adjusted Diluted EPS $ (9.27) $ (18.18) $ (36.39) $ (34.03)
(1) In order to arrive at the numerator used to calculate Adjusted Diluted EPS, it is necessary to deduct net (loss) income attributable to noncontrolling interests from this amount.
(2) Reflects loss from continuing operations, net of income taxes, less net (loss) income attributable to noncontrolling interests.
This information is intended to be reviewed in conjunction with the company's filings with the SEC.
Supplemental Hedging Data As of January 31, 2016
Australian Dollar Hedging 1Q 2016 2Q 2016 3Q 2016 4Q 2016 FY 2017
Percent Hedged - as of 1/31/16 60% 58% 41% 36% 26%
Hedge Rate $0.95 $0.91 $0.90 $0.91 $0.88
All-in Rate $0.85 $0.83 $0.79 $0.78 $0.74
Fuel Derivatives Hedging 1Q 2016 2Q 2016 3Q 2016 4Q 2016 FY 2017
Percent Hedged - as of 1/31/16 70% 62% 67% 74% 45%
Hedge Price (per gallon equivalent) $2.48 $2.61 $2.41 $2.38 $2.35 All-in Price (per gallon equivalent) $2.02 $2.00 $1.97 $2.06 $1.73
Cost Sensitivity
Unhedged AUD position sensitivity to $0.05 move $10 $10 $15 $16 $74 Unhedged Fuel position sensitivity to $0.25/gal move $2 $3 $3 $2 $18
Note: Hedge percentages only include economic hedges expected to be realized in each respective period presented. Estimated hedge percentages and cost sensitivities based on 2016 projected requirements of ~$2.0 billion AUD and ~130 million gallons of diesel fuel. Fuel hedge percentages include derivative hedges, such as swaps or options, and exclude Coal Supply Agreement hedges, which are a fuel cost pass-through provision in certain customer contracts.
UNITED STATES
SECURITIES AND EXCHANGE COMMISSION
Washington, D.C. 20549
_____________________________________________
FORM 10-K
þ ANNUAL REPORT PURSUANT TO SECTION 13 OR 15(d) OF THE SECURITIES EXCHANGE ACT OF 1934
For the Fiscal Year Ended December 31, 2014 or
¨ TRANSITION REPORT PURSUANT TO SECTION 13 OR 15(d) OF THE SECURITIES EXCHANGE ACT OF 1934
Commission File Number 1-16463
____________________________________________
PEABODY ENERGY CORPORATION
(Exact name of registrant as specified in its charter)
Delaware
(State or other jurisdiction of incorporation or organization) (I.R.S. Employer Identification No.)13-4004153
701 Market Street, St. Louis, Missouri
(Address of principal executive offices) (Zip Code)63101
(314) 342-3400
Registrant’s telephone number, including area code
Securities Registered Pursuant to Section 12(b) of the Act:
Title of Each Class Name of Each Exchange on Which Registered
Common Stock, par value $0.01 per share New York Stock Exchange
Securities Registered Pursuant to Section 12(g) of the Act:
None
Indicate by check mark if the registrant is a well-known seasoned issuer, as defined in Rule 405 of the Securities Act. Yes þ No ¨ Indicate by check mark if the registrant is not required to file reports pursuant to Section 13 or Section 15(d) of the Act. Yes ¨ No þ
Indicate by check mark whether the registrant (1) has filed all reports required to be filed by Section 13 or 15(d) of the Securities Exchange Act of 1934 during the preceding 12 months (or for such shorter period that the registrant was required to file such reports) and (2) has been subject to such filing requirements for the past 90 days. Yes þ No ¨
Indicate by check mark whether the registrant has submitted electronically and posted on its corporate Web site, if any, every Interactive Data File required to be submitted and posted pursuant to Rule 405 of Regulation S-T (§ 232.405 of this chapter) during the preceding 12 months (or for such shorter period that the registrant was required to submit and post such files). Yes þ No ¨
Indicate by check mark if disclosure of delinquent filers pursuant to Item 405 of Regulation S-K (§ 229.405 of this chapter) is not contained herein, and will not be contained, to the best of registrant’s knowledge, in definitive proxy or information statements incorporated by reference in Part III of this Form 10-K or any amendment to this Form 10-K. þ Indicate by check mark whether the registrant is a large accelerated filer, an accelerated filer, a non-accelerated filer, or a smaller reporting company. See the definitions of “large accelerated filer,” “accelerated filer” and “smaller reporting company” in Rule 12b-2 of the Exchange Act. (Check one):
Large accelerated filer þ Accelerated filer ¨ Non-accelerated filer ¨ Smaller reporting company ¨ (Do not check if a smaller reporting company)
Indicate by check mark whether the registrant is a shell company (as defined in Rule 12b-2 of the Exchange Act). Yes ¨ No þ
Aggregate market value of the voting stock held by non-affiliates (shareholders who are not directors or executive officers) of the Registrant, calculated using the closing price on June 30, 2014: Common Stock, par value $0.01 per share, $4.4 billion.
Number of shares outstanding of each of the Registrant’s classes of Common Stock, as of February 20, 2015: Common Stock, par value $0.01 per share, 274,817,605 shares outstanding.
DOCUMENTS INCORPORATED BY REFERENCE
Portions of the Company’s Proxy Statement to be filed with the Securities and Exchange Commission in connection with the Company’s 2015 Annual Meeting of Shareholders (the Company’s 2015 Proxy Statement) are incorporated by reference into Part III hereof. Other documents incorporated by reference in this report are listed in the Exhibit Index of this Form 10-K.
Source: PEABODY ENERGY CORP, 10-K, February 25, 2015 Powered by Morningstar® Document Research℠
The information contained herein may not be copied, adapted or distributed and is not warranted to be accurate, complete or timely. The user assumes all risks for any damages or losses arising from any use of this information, except to the extent such damages or losses cannot be limited or excluded by applicable law. Past financial performance is no guarantee of future results.
Table of Contents
PEABODY ENERGY CORPORATION CONSOLIDATED BALANCE SHEETS
December 31,
2014 2013
(Amounts in millions, except per share data)
ASSETS
Current assets
Cash and cash equivalents $ 298.0 $ 444.0
Accounts receivable, net of allowance for doubtful accounts of $5.8 at December 31, 2014 and $7.4 at December 31, 2013 563.1 557.9
Inventories 406.5 506.7
Assets from coal trading activities, net 57.6 36.1
Deferred income taxes 80.0 66.4
Other current assets 305.8 381.6
Total current assets 1,711.0 1,992.7
Property, plant, equipment and mine development, net 10,577.3 11,082.5
Deferred income taxes 0.7 7.8
Investments and other assets 902.1 1,050.4
Total assets $ 13,191.1 $ 14,133.4
LIABILITIES AND STOCKHOLDERS’ EQUITY
Current liabilities
Current maturities of long-term debt $ 21.2 $ 31.7
Liabilities from coal trading activities, net 32.7 6.1
Accounts payable and accrued expenses 1,809.2 1,764.0
Total current liabilities 1,863.1 1,801.8
Long-term debt, less current maturities 5,965.6 5,970.7
Deferred income taxes 89.1 40.9
Asset retirement obligations 722.3 691.8
Accrued postretirement benefit costs 781.9 684.0
Other noncurrent liabilities 1,042.6 996.3
Total liabilities 10,464.6 10,185.5
Stockholders’ equity
Preferred Stock — $0.01 per share par value; 10.0 shares authorized, no shares issued or outstanding as of December 31, 2014
or December 31, 2013 — —
Perpetual Preferred Stock — 0.8 shares authorized, no shares issued or outstanding as of December 31, 2014 or December 31,
2013 — —
Series Common Stock — $0.01 per share par value; 40.0 shares authorized, no shares issued or outstanding as of December 31,
2014 or December 31, 2013 — —
Common Stock — $0.01 per share par value; 800.0 shares authorized, 285.7 shares issued and 271.7 shares outstanding as of
December 31, 2014 and 283.9 shares issued and 270.1 shares outstanding as of December 31, 2013 2.9 2.8
Additional paid-in capital 2,383.3 2,340.0
Treasury stock, at cost — 14.0 shares as of December 31, 2014 and 13.8 shares as of December 31, 2013 (467.1) (464.7)
Retained earnings 1,570.5 2,449.8
Accumulated other comprehensive loss (764.8) (419.2)
Peabody Energy Corporation stockholders’ equity 2,724.8 3,908.7
Noncontrolling interests 1.7 39.2
Total stockholders’ equity 2,726.5 3,947.9
Total liabilities and stockholders’ equity $ 13,191.1 $ 14,133.4
See accompanying notes to consolidated financial statements
Peabody Energy Corporation 2014 Form 10-K F- 4
Source: PEABODY ENERGY CORP, 10-K, February 25, 2015 Powered by Morningstar® Document Research℠
The information contained herein may not be copied, adapted or distributed and is not warranted to be accurate, complete or timely. The user assumes all risks for any damages or losses arising from any use of this information, except to the extent such damages or losses cannot be limited or excluded by applicable law. Past financial performance is no guarantee of future results.
Table of Contents
PEABODY ENERGY CORPORATION
NOTES TO CONSOLIDATED FINANCIAL STATEMENTS — (Continued)
Financial Instruments with Off-Balance Sheet Risk
As of December 31, 2014, the Company had the following financial instruments with off-balance-sheet risk:
Reclamation
Obligations ObligationsCoal Lease
Workers’ Compensation
Obligations Other(1) Total (Dollars in millions) Self bonding $ 1,361.4 $ — $ — $ — $ 1,361.4 Surety bonds 325.2 103.8 92.3 11.4 532.7 Bank guarantees 319.8 — — 117.4 437.2 Letters of credit 17.6 — 34.1 100.9 152.6 $ 2,024.0 $ 103.8 $ 126.4 $ 229.7 $ 2,483.9
(1) Other includes the $79.7 million in letters of credit related to Dominion Terminal Associates and the PBGC, as described below, and an additional $150.0 million in bank guarantees, letters of credit and surety bonds related to road maintenance, performance guarantees and other operations.
The Company owns a 37.5% interest in Dominion Terminal Associates, a partnership that operates a coal export terminal in Newport News, Virginia under a 30-year lease that permits the partnership to purchase the terminal at the end of the lease term for a nominal amount. The partners have severally (but not jointly) agreed to make payments under various agreements which in the aggregate provide the partnership with sufficient funds to pay rents and to cover the principal and interest payments on the floating-rate industrial revenue bonds issued by the Peninsula Ports Authority, and which are supported by letters of credit from a commercial bank. As of December 31, 2014, the Company’s maximum reimbursement obligation to the commercial bank was in turn supported by four letters of credit totaling $42.7 million.
The Company is party to an agreement with the PBGC and TXU Europe Limited, an affiliate of the Company’s former parent corporation, under which the Company is required to make special contributions to two of the Company’s defined benefit pension plans and to maintain a $37.0 million letter of credit in favor of the PBGC. If the Company or the PBGC gives notice of an intent to terminate one or more of the covered pension plans in which liabilities are not fully funded, or if the Company fails to maintain the letter of credit, the PBGC may draw down on the letter of credit and use the proceeds to satisfy liabilities under the Employee Retirement Income Security Act of 1974, as amended. The PBGC, however, is required to first apply amounts received from a $110.0 million guarantee in place from TXU Europe Limited in favor of the PBGC before it draws on the Company’s letter of credit. On November 19, 2002, TXU Europe Limited was placed under the administration process in the U.K. (a process similar to bankruptcy proceedings in the U.S.) and continues under this process as of December 31, 2014. As a result