arXiv:1509.04098v2 [cs.SI] 10 Nov 2015
Fame for sale: efficient detection of fake Twitter followers
✩Stefano Crescia,b, Roberto Di Pietrob, Marinella Petrocchia, Angelo Spognardia,1,∗, Maurizio Tesconia aIIT-CNR, Via G. Moruzzi, 1 – 56124 Pisa, Italy
bBell Labs, Alcatel-Lucent, Paris, France
Abstract
Fake followers are those Twitter accounts specifically created to inflate the number of followers of a target account. Fake followers are dangerous for the social platform and beyond, since they may alter concepts like popularity and influence in the Twittersphere—hence impacting on economy, politics, and society. In this paper, we contribute along different dimensions. First, we review some of the most relevant existing features and rules (proposed by Academia and Media) for anomalous Twitter accounts detection. Second, we create a baseline dataset of verified human and fake follower accounts. Such baseline dataset is publicly available to the scientific community. Then, we exploit the baseline dataset to train a set of machine-learning classifiers built over the reviewed rules and features. Our results show that most of the rules proposed by Media provide unsatisfactory performance in revealing fake followers, while features proposed in the past by Academia for spam detection provide good results. Building on the most promising features, we revise the classifiers both in terms of reduction of overfitting and cost for gathering the data needed to compute the features. The final result is a novelClass Aclassifier, general enough to thwart overfitting, lightweight thanks to the usage of the less costly features, and still able to correctly classify more than 95% of the accounts of the original training set. We ultimately perform an information fusion-based sensitivity analysis, to assess the global sensitivity of each of the features employed by the classifier.
The findings reported in this paper, other than being supported by a thorough experimental methodology and interesting on their own, also pave the way for further investigation on the novel issue of fake Twitter followers.
Keywords: Twitter, fake followers, anomalous account detection, baseline dataset, machine learning
✩An extended version of this preprint has been accepted for publication on Elsevier’s journal Decision Support Systems http:// dx.doi.org/ 10.1016/ j.dss.2015.09.003. Please, cite this work as: “Cresci, S., Di Pietro, R., Petrocchi, M., Spognardi, A., & Tesconi, M. (2015). Fame for sale: Efficient detection of fake Twitter followers. Decision Support Systems, 80, 56-71”.
∗Corresponding author
Email addresses: stefano.cresci@iit.cnr.it(Stefano Cresci),roberto.di_pietro@alcatel-lucent.com(Roberto Di Pietro),marinella.petrocchi@iit.cnr.it(Marinella Petrocchi),angelo.spognardi@iit.cnr.it(Angelo Spognardi), maurizio.tesconi@iit.cnr.it (Maurizio Tesconi)
1. Introduction
Originally started as a personal microblogging site, Twitter has been transformed by common use to an information publishing venue. Statistics reported about a billion of Twitter subscribers, with 302 million monthly active users2. Twitter annual advertising revenue in 2014 has been estimated to around $480
million3. Popular public characters, such as actors and singers, as well as traditional mass media (radio, TV, and newspapers) use Twitter as a new media channel.
Such a versatility and spread of use have made Twitter the ideal arena for proliferation of anomalous accounts, that behave in unconventional ways. Academia has mostly focused its attention on spammers, those accounts actively putting their efforts in spreading malware, sending spam, and advertising activities of doubtful legality [1, 2, 3, 4]. To enhance their effectiveness, these malicious accounts are often armed with automated twitting programs, as stealthy as to mimic real users, known asbots. In the recent past, media have started reporting that the accounts of politicians, celebrities, and popular brands featured a suspicious inflation of followers4. So-called fake followers correspond to Twitter accounts specifically exploited to
increase the number of followers of a target account. As an example, during the 2012 US election campaign, the Twitter account of challenger Romney experienced a sudden jump in the number of followers. The great majority of them has been later claimed to be fake5. Similarly, before the last general Italian elections
(February 2013), online blogs and newspapers had reported statistical data over a supposed percentage of fake followers of major candidates6. At a first glance, acquiring fake followers could seem a practice limited
to foster one’s vanity—a maybe questionable, but harmless practice. However, artificially inflating the number of followers can also be finalized to make an account more trustworthy and influential, in order to stand from the crowd and to attract other genuine followers [5]. Recently, banks and financial institutions in U.S. have started to analyze Twitter and Facebook accounts of loan applicants, before actually granting the loan7. Thus, to have a “popular” profile can definitely help to augment the creditworthiness of the applicant.
Similarly, if the practice of buying fake followers is adopted by malicious accounts, as spammers, it can act as a way to post more authoritative messages and launch more effective advertising campaigns [6]. Fake followers detection seems to be an easy task for many bloggers, that suggest their “golden rules” and provide a series of criteria to be used as red flags to classify a Twitter account behavior. However, such rules are
2C. Smith, By The Numbers: 150+ Amazing Twitter Statistics, http://goo.gl/o1lNi8 - June 2015. Last checked: July 23,
2015.
3Statistic Brain, Twitter statistics, http://goo.gl/XEXB1 - March 2015. Last checked: July 23, 2015.
4Corriere Della Sera (online ed.), Academic Claims 54% of Grillo’s Twitter Followers are Bogus, http://goo.gl/qi7Hq - July
2012. Last checked: July 23, 2015.
5New York Times (online ed.), Buying Their Way to Twitter Fame, http://goo.gl/VLrVK, - August 2012. Last checked:
July 23, 2015.
6The Telegraph (online ed.), Human or bot? Doubts over Italian comic Beppe Grillo’s Twitter followers,
http://goo.gl/2yEgT - July 2012. Last checked: July 23, 2015.
7Le Monde (online ed.), Dis-moi combien d’amis tu as sur Facebook, je te dirai si ta banque va t’accorder un prˆet,
usually paired neither with analytic algorithms to aggregate them, nor with validation mechanisms. As for Academia, researchers have focused mainly on spam and bot detection, with brilliant results characterizing Twitter accounts based on their (non-)human features, mainly by means of machine-learning classifiers trained over manually annotated sets of accounts.
To the best of our knowledge, however, despite fake followers constitute a widespread phenomenon with both economical and social impacts, in the literature the topic has not been deeply investigated yet. Contributions
The goal of this work is to shed light on the phenomenon of fake Twitter followers, aiming at overcoming current limitations in their characterization and detection. In particular, we provide the following contribu-tions. First, we build a baseline dataset of Twitter accounts where humans and fake followers are knowna priori. Second, we test known methodologies for bot and spam detection on our baseline dataset. In partic-ular, we test the Twitter accounts in our reference set against algorithms based on: (i) single classification rules proposed by bloggers, and (ii) feature sets proposed in the literature for detecting spammers. The results of the analysis suggest that fake followers detection deserves specialized mechanisms: specifically, algorithms based on classification rules do not succeed in detecting the fake followers in our baseline dataset. Instead, classifiers based on features sets for spambot detection work quite well also for fake followers de-tection. Third, we classify all the investigated rules and features based on the cost required for gathering the data needed to compute them. Building on theoretical calculations and empirical evaluations, we show how the best performing features are also the most costly ones. The novel results of our analysis show that data acquisition cost often poses a serious limitation to the practical applicability of such features. Finally, building on the crawling cost analysis, we design and implement lightweight classifiers that make use of the less costly features, while still being able to correctly classify more than 95% of the accounts of our training dataset. In addition, we also validated the detection performances of our classifiers over two other sets of human and fake follower accounts, disjoint from the original training dataset.
Road map
The remainder of this paper is structured as follows. Section 2 considers and compares related work in the area of Twitter spam and bot detection. Section 3 describes our baseline dataset. In Section 4, we evaluated a set of criteria for fake Twitter followers detection promoted by Social Media analysts using our baseline dataset. In Section 5, we examine features used in previous works for spam detection of Twitter accounts. In Section 6 we compute the cost for extracting the features our classifiers are based on. A lightweight and efficient classifier is also provided, attaining a good balance between fake followers detection capability and crawling cost. Finally, Section 7 concludes the paper.
2. Related Work
Quoting from [7], “A fake Twitter account is considered as one form of deception (i.e., deception in both the content and the personal information of the profiles as well as deception in having the profile follow others not because of personal interest but because they get paid to do so).” The second characterization for deception is exactly the one we deal with in our paper. We specifically considerfake followers as those Twitter accounts appropriately created and sold to customers, which aim at magnifying their influence and engagement to the eyes of the world, with the illusion of a big number of followers.
So defined fake followers are only an example of anomalous accounts which are spreading over Twitter. Anomalies have been indeed identified in the literature as either spammers (i.e. accounts that advertise unsolicited and often harmful content, containing links to malicious pages [8]), or bots (i.e., computer programs that control social accounts, as stealthy as to mimic real users [9]), or cyborgs (i.e., accounts that interweave characteristics of both manual and automated behavior [10]). Finally, there are fake followers, accounts massively created to follow a target account and that can be bought from online accounts markets. 2.1. Grey literature and Online Blogs
Before covering the academic literature, we briefly report on online documentation that presents a series of intuitive fake follower detection criteria, though not proved to be effective in a scientific way. The reason why we cite this work is twofold: on the one hand, online articles and posts testify the quest for a correct discrimination between genuine and fake Twitter followers; on the other hand, we aim at assessing in a scientific manner whether such criteria could actually be employed for fake followers detection.
As an example, a well-known blogger in [11] indicates as possible bots-like distinctive signals the fact that bots accounts: 1) have usually a huge amount of following and a small amount of followers; 2) tweet the same thing to everybody; and, 3) play the follow/unfollow game, i.e. they follow and then unfollow an account usually within 24 hours. Criteria advertised by online blogs are mainly based on common sense and the authors usually do not even suggest how to validate them.
A series of reports published by the firmDigital evaluations [12] have attracted the attention of Italian and European newspapers and magazines, raising doubts on the Twitter popularity of politicians and leading international companies. A number of criteria, inspired by common sense and denotinghumanbehavior, are listed in the reports and used to evaluate a sample of the followers of selected accounts. For each criterion satisfied by a follower, a human score is assigned. For each not fulfilled criterion, either a bot or neutral score is assigned. According to the total score, Twitter followers are classified either as humans, as bots or as neutral (in the latter case, there is not enough information to assess their nature), providing a quality score of the effective influence of the followed account. The results in [12], however, lack a validation phase. Finally, some companies specialized in social media analysis offer online services to estimate how much a Twitter account is genuine in terms of its followers [13, 14, 15]. However, the criteria used for the
analysis are not publicly disclosed and just partially deductible from information available on their web sites. Moreover, as demonstrated in our previous work [16], these analyses are affected by several biases like small and statistically unsound sampling strategies.
2.2. Academic literature
In recent years, spam detection on Twitter has been the matter of many investigations, approaching the issue from several points of view. As an example, a branch of research focused on the textual content of tweets [4, 3, 17], studying the redirection of embedded URLs in tweets [18], and classifying the URLs landing pages [19]. Other works tackled the problem of deception on Twitter via epistemology. For instance, in [20] authors evaluate 4 epistemological features for the task of deception detection: authority, plausibility and support, independent corroboration, and presentation.
Work in [21] overcomes the limitation of not being able to correctly label those tweets without URLs as spam tweets, by proposing a composite tool, able to match incoming tweets with underlying templates commonly used by spammers. Instead of considering the content of tweets, work in [7] tries to classify if an account can be trusted or not based on possibly inconsistent information originating from the profile of the account only.
A series of works investigate spammers on microblogging platforms through a multi-feature approach, including features on the profile, the behavior, and the timeline of an account. Within this research line, we cite here [8], [2], and [22]. The work in [8] presents an analysis on how spammers operate on Facebook, Twitter, and MySpace, reporting that the suspicious accounts shared some common traits on specific fea-tures. Those served as input to a machine learning-based classifier [23] leading to the detection of more than 15,000 spam profiles, that Twitter promptly deleted. In [2], the authors propose a taxonomy of cri-teria for detecting Twitter spammers. A series of experiments show how the newly designed cricri-teria have higher detection rates, when compared to the existing ones. In [22], the authors leverage a combination of behavioral features (such as tweeting and retweeting activities), network features (such as the number of an account’s followers and friends), and content-based features to develop a hybrid mathematical model for spammer detection in Weibo, the Chinese microblogging site resembling Twitter.
The authors of [10] classify Twitter accounts in three classes: humans, bot, and cyborgs. The latter class represents either bot-assisted humans or human-assisted bots. The authors used a decision maker based on three specialized components that considered the content and timing of tweets and some account properties. The algorithms proposed in [24, 4] aim at spotting groups of automated malicious Twitter accounts as quickly as possible, to avoid the accounts’ owners from taking advantage of them.Thus, authors apply clustering algorithms to group accounts created within a short period of time, considering, among others, name- and content-based features.
online services offering their subscribers to provide followers in exchange for a fee, and to spread promotional tweets on their behalf. In another work [26], the same research team provides more details about the account markets, analyzing additional properties and characteristics of their customers (e.g., the dynamics of followers and friends and the ability of generating engagement), and providing a classifier for the detection of both markets and market customers. The authors of [27] monitor prices, availability, and fraud perpetrated by a set of merchants of Twitter accounts over the course of a ten-months period. Such a research is a spotlight on techniques and methodologies that accounts markets exploit to create and register fraudulent accounts, from CAPTCHA solving services, to deceitful email credentials and a diverse pool of IP addresses to evade blacklisting. In collaboration with Twitter itself, the authors developed a classifier to detect such fraudulent accounts, which were consequently suspended.
It is worth noting that the cited selection of academic works is not exhaustive. However, it considers a huge collection of criteria, which we further leverage for our approach to fake Twitter followers detection. There are other works for spam detection, not detailed here, like [1, 28, 29, 30, 31, 32], which base their results on subsets, or on slightly modified versions, of criteria considered by the selected set of related work. 2.3. Differences and similarities with our approach
The goal of our research is the automatic detection of those Twitter accounts specifically created to inflate the number of followers of some target account (so called fake Twitter followers). A priori, both spammers, bots, and genuine users’ accounts could fall in the macro-category of fake followers, and specific features already proved effective in the literature for spotting spammers and bots could work also in the case of fake followers. It was indeed this observation that initially drove the authors of this paper towards the direction of testing rules and features from past works on a reference dataset of genuine accounts and fake followers. This contributed to prune those rules and features that behaved worst in detecting fake followers, and leave the ones that well behave.
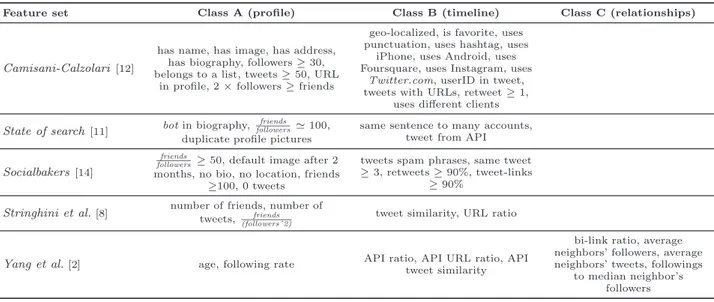
From a technical point of view, in our experiments we rely on machine learning-based classifiers exploiting features of 1) profile, 2) activity, and 3) relationships of the accounts, similarly to [8, 2]. Instead, we do not rely on features inherent to specific contents of tweets, such as the presence of URLs and the semantics of the text [17, 19]. We move beyond the mere application of already tested features to a new dataset, since we revise our classifiers to reduce overfitting and cost for data gathering, as illustrated in Sections 5 and 6. Finally, similarly to [26], we bought fake Twitter followers from different markets available on the Web. We conducted such an exercise independently from [26] and, moreover, goals of the two works are quite different, ours focusing on accounts sold by these markets, while the other targeting their customers. As for the genuine part of our baseline dataset, werecruit accounts of people that have voluntarily adhered to our campaign, and leverage a dataset of annotated accounts, belonging to people active on Twitter within a particular period of time on a specific domain, and whose authenticity has been verified. However, willing
to test our classifiers over a representative sample of the entire Twitter population, we also approach the construction of a test set by randomly picking: 1) a sample of Barack Obama’s followers, and 2) a sample of the Twitter population.
3. Baseline datasets
In this section we present the datasets of Twitter accounts used to conduct our empirical study throughout the paper. We detail how we collected each of them and how we verified if they were genuine humans or fake followers. Despite the final size of the baseline dataset, to perform our research, we altogether crawled 9 millions of Twitter accounts and about 3 millions of tweets. To foster investigation on the novel issue of fake Twitter followers, our baseline dataset has been made publicly available for research purposes [33]. 3.1. The Fake Project
The Fake Project started its activities on December 12, 2012, with the creation of the Twitter account @TheFakeProject. Its profile reports the following motto: “Follow me only if you are NOT a fake” and explains that the initiative is linked with a research project owned by researchers at IIT-CNR, in Pisa-Italy. In a first phase, the owners contacted further researchers and journalists to advertise the initiative and also foreign journalists and bloggers supported the initiative in their countries. In a twelve days period (Dec 12-24, 2012), the account has been followed by 574 followers. Through the Twitter APIs, we crawled a series of public information about these followers together with that of their followers and followings. For this dataset, we crawled the 574 accounts, leading to the collection of 616,193 tweets and 971,649 relationships (namely, linked Twitter accounts).
All those followers voluntarily joined the project. To include them in our reference set of humans, we also launched a verification phase. Each follower received a direct message on Twitter from @TheFakeProject, containing an URL to a CAPTCHA, unique for each follower. We consider as “certified humans” all the 469 accounts out of the 574 followers that successfully completed the CAPTCHA. In the remainder of this section this dataset is referred to asTFP.
3.2. #elezioni2013 dataset
The #elezioni2013 dataset, henceforthE13, was born to support a research initiative for a sociological study carried out in collaboration with the University of Perugia and the Sapienza University of Rome. The study focused on the strategic changes in the Italian political panorama for the 3-year period 2013-2015. Researchers identified 84,033 unique Twitter accounts that used the hashtag #elezioni2013 in their tweets, during the period between January 9 and February 28, 2013. Identification of these accounts has been based on specific keyword-driven queries on the username and biography fields of the accounts’ profiles. Keywords include blogger, journalist, social media strategist/analyst, and congressperson. Specific names of political parties have been also searched. In conclusion, all the accounts belonging to politicians and candidates,
parties, journalists, bloggers, specific associations and groups, and whoever somehow was officially involved in politics, have been discarded. The remaining accounts (about 40k) have been classified ascitizens. This last set has been sampled (with confidence level 95% and confidence interval 2.5), leading to a final set of 1488 accounts, that have been subject to a manual verification to determine the nature of their profiles and tweets. The manual verification process has been carried out by two sociologists from the University of Perugia, Italy. It involved the analysis of profile pictures, biographies, and timeline of the accounts under investigation. Accounts not having a biography or a profile picture have been discarded. URLs in biographies have also been manually checked to allow for a deeper analysis of the subject. Only accounts labeled as humans by both the sociologists have been included in the E13 dataset. Overall, the manual verification phase lasted roughly two months. As a result, 1481 accounts became part of datasetE13.
3.3. Baseline dataset of human accounts
The above introduced datasets form our final set, labeled HUM, of 1950 verified human accounts. It is worth noting how the two subsets differ from each other. The TFP set consists of accounts that have been recruited on a volunteer base: people involved in the initiative aimed to be part of an academic study for discovering fake followers on Twitter, and are a mixture of researchers and social media experts and journalists, mostly from Italy, but also from US and other European countries. The E13 set consists of particularly active Italian Twitter users, with different professional background and belonging to diverse social classes, sharing a common interest for politics, but that do not belong to the following categories: politicians, parties, journalists, bloggers.
3.4. Baseline dataset of fake followers
In April, 2013, we bought 3000 fake accounts from three different Twitter online markets. In particular, we bought 1000 fake accounts fromhttp:// fastfollowerz.com, 1000 fromhttp:// intertwitter.com, and 1000 fake accounts fromhttp:// twittertechnology.com, at a price of $19, $14 and $13 respectively. Surprisingly, fastfollowerz and intertwitter gave us a few more accounts than what we paid for, respectively 1169 and 1337 instead of 1000. We crawled all these accounts to build a fastfollowerz dataset, labeled FSF, and an intertwitter dataset labeled INT. Instead, we were unable to crawl all the 1000 fake followers bought from twittertechnology since 155 of them got suspended almost immediately. The remaining 845 accounts constitute thetwittertechnology dataset, which is labeledTWT.
We acknowledge that our fake followers dataset is just illustrative, and not exhaustive, of all the possible existing sets of fake followers. However, it is worth noting that we found the Twitter accounts marketplaces by simply Web searching them on the most common search engines. Thus, we can argue that our dataset represents what was easily possible to find on the Web at the time of searching.
relationships
dataset accounts tweets followers friends total
TFP (@TheFakeProject) 469 563,693 258,494 241,710 500,204
E13 (#elezioni2013) 1481 2,068,037 1,526,944 667,225 2,194,169
FSF (fastfollowerz) 1169 22,910 11,893 253,026 264,919
INT (intertwitter) 1337 58,925 23,173 517,485 540,658
TWT (twittertechnology) 845 114,192 28,588 729,839 758,427
HUM (human dataset) 1950 2,631,730 1,785,438 908,935 2,694,373
FAK (fake dataset) 1950 118,327 34,553 879,580 914,133
BAS (baseline dataset: HUM ∪FAK) 3900 2,750,057 1,819,991 1,788,515 3,608,506 Table 1: Statistics about total collected data [33].
3.5. Baseline dataset of fake followers and human accounts
The final baseline dataset exploited in our experiments is composed of both fake and human profiles. In the following, we briefly discuss the distribution between fake and human accounts that has been chosen for this dataset. Many machine-learning techniques are affected by the imbalance of the natural distributions of the minority and majority classes. This is why, for example, works in the literature have studied how the decision tree-based techniques perform when varying the distribution of the training set. In particular, Weiss and Provost, in [34], considered the performances of decision-tree based classifiers to predict the samples of 26 different datasets, with different distributions between the minority and majority classes. The conclusions of their investigation have shown that the metric used to evaluate the performance of the different classifiers changes the optimal distribution of the classes for the training set. For example, after their empirical analysis, using accuracy as evaluation metric, 9 out of the 26 datasets have the optimal distribution very different from the natural one, while, when using the AUC as evaluation metric, this number grows to 14 out of the 26. Moreover, the optimal distribution has an oversampling of the minority class (there are also cases when the best classifier is obtained with an oversampling up to 90% of the minority class samples).
Here, we face another fundamental issue: we do not precisely know the real (natural) distribution of fake followers and human accounts. In 2013, the Twitter staff conjectured that the number of “false or spam accounts should represent less than 5% of our MAUs” (where MAUs refer to monthly active users) [35]. However, MAUs can be assimilated neither to a random sample of Twitter accounts nor to the followers of a given account. Moreover, if an account has bought fake followers, then its distribution of fake followers and human followers can vary dramatically from the natural distribution that one can find, either among MAUs, or among all the Twitter accounts in the Twittersphere. In conclusion, the estimation of 5% as false or spam accounts, in the whole Twitter, can not be directly extended to the fake followers of a given account.
Although Twitter has never disclosed the total number of registered users, unofficial sources claim that the Twitter accounts created up to date are many more than the MAUs. This is why we made a conservative assumption, considering a balanced distribution of fake followers and human followers as our baseline dataset.
To validate this assumption, we performed the experiments in [34] to our dataset. We progressively varied the class distribution of fake followers and human followers in the dataset, from 5%–95% to 95%–5% (respectively 100 humans–1900 fake followers, 1900 humans–100 fake followers), and used the obtained dataset to train J48 classifiers, considering their performances with cross-validation. The trained classifiers obtained their best results on a balanced distribution of humans and fake followers. To obtain a balanced dataset, we randomly undersampled the total set of fake accounts (i.e., 3351) to match the size of theHUM dataset of verified human accounts. Thus, we built a baseline dataset of 1950 fake followers, labeledFAK. The final baseline dataset for this work includes both theHUM dataset and theFAK dataset for a total of 3900 Twitter accounts. This balanced dataset is labeledBAS in the remainder of the paper and has been exploited for all the experiments described in this work (where not otherwise specified). Table 1 shows the number of accounts, tweets and relationships contained in the datasets described in this section.
4. Fake detection with algorithms based on classification rules
In this section, we detail three procedures, originally proposed by bloggers and social media analysts, explicitly conceived for fake followers and bot accounts detection. These proposals were introduced in [12, 11, 14]. The work we focus on in this section is not directly attributable to academic work. However, it is an example of the spreading interest on the phenomenon of fake Twitter followers by Media and Social Marketing companies. Although we do not expect these proposals to satisfactorily perform for the complex task of fake followers detection, we believe a thorough analysis of the proposed criteria could still provide some useful insights. Coincidentally, all the procedures are proposed as algorithms relying on a list of rules, or criteria: each account to be classified is checked against all the rules and the outputs of the checks must be combined together in order to obtain the final classification. Unfortunately in many cases, details on how to combine the criteria to obtain the final classification of an account is not publicly available. Details on how aggregation has been performed are provided in [12] only. Driven by the provided details, we implement the full algorithm described in [12] and we present its detection performances in Section 4.5. In addition, for each of the procedures, we report the criteria as indicated by the original sources and we further specify how we have implemented them into rules suitable to be applied over our datasets. We also detail the reasons for our implementation choices.
In this section, we mainly focus on the application of each single rule over our dataset to assess its strength (or weakness) in discriminating fake followers. In Section 6, we combine all the rules together with the features analyzed in Section 5, to assess their collective classification power. This is because a single rule – or feature – alone may not perform well in classifying fake and human accounts, but it may improve the detection if used in combination with other ones. Indeed, it is worth noting that some of the criteria analyzed in this section have been actually exploited by the classifiers built in Section 6.
1. the profile contains a name; 12. it has used a hashtag in at least one tweet; 2. the profile contains an image; 13. it has logged into Twitter using an iPhone; 3. the profile contains a physical address; 14. it has logged into Twitter using an Android device; 4. the profile contains a biography; 15. it is connected with Foursquare;
5. the account has at least 30 followers; 16. it is connected with Instagram; 6. it has been inserted in a list by other Twitter users; 17. it has logged intotwitter.com website;
7. it has written at least 50 tweets; 18. it has written the userID of another user in at least one tweet, that is it posted a@reply or amention;
8. the account has been geo-localized; 19. (2*number followers)≥(number of friends);
9. the profile contains a URL; 20. it publishes content which does not just contain URLs; 10. it has been included in another user’s favorites; 21. at least one of its tweets has been retwitted by other
accounts (worth 2 points);
11. it writes tweets that have punctuation; 22. it has logged into Twitter through different clients (worth 3 points).
Table 2: Camisani-Calzolari rule set.
Throughout the sequel of the paper we use the term “friends” to denote the users followed by an account (i.e., ifAfollowsB,B is a friend ofA).
4.1. Followers of political candidates
Camisani-Calzolari [12] carried out a series of tests over samples of Twitter followers of Romney and Obama, for the last US presidential elections, as well as for popular Italian politicians. In [12] it is detailed an algorithm to evaluate an account based on some of its public features. The cited algorithm has enough details to be reproducible: it assignshuman/active and bot/inactive scores and classifies an account considering the gap between the sum of the two scores. In particular, the algorithm assigns to the examined accounts 1 (or more, where specified)human point for each of the criteria in Table 2. Moreover, the account receives 2 bot points if it only uses APIs. Finally, for each criterion that fails to be verified, the account receives 1 bot point, with the exception of criteria 8, 13, 14, 15, 16 and 17: in this cases, no bot points are assigned. To verify those rules, we referred to the source metadata of the tweets, that contains a different value representing the platform used to post a tweet. In particular, concerning the above rules, we considered thesource metadata with the valuesiphone, android, foursquare, instagram and web, respectively, and we assigned 1human point for each of the values found at least once within the collected tweets of the account. For the criterion 21, 2botpoints are assigned if no tweets of the account have been retweeted by other users. Considering rule 8,geo-localization is related to tweets. Consequently, we set this rule as satisfied when at least one tweet of the account has been geo-localized. For the rule 11, punctuation has been searched in both the profile biography and in its timeline.
4.2. Stateofsearch.com
Among the several bloggers that propose their golden rules to identify suspicious Twitter accounts, we consider the“7 signals to look out for recognizing Twitter bots”, according to the founder of the social media websitestateofsearch.com[11]. The “7 signals to look out for” to recognize Twitter bots are listed in Table 3.
1. the biography of the profile clearly specifies that it is a bot account;
5. accounts that tweet from API are suspicious;
2. the friends
followers ratio is in the order of 100:1; 6. the response time (follow →reply) to tweets of other ac-counts is within milliseconds;
3. the account tweets the same sentence to many other accounts;
7. the account tends to follow → unfollow other accounts within a temporal arc of 24 hours.
4. different accounts with duplicate profile pictures are suspicious;
Table 3: Stateofsearch.com rule set.
The rule 3 has been implemented considering the tweet as a single unit. We consider the last 20 tweets of each timeline. For the rule 4, we consider the existence of a duplicate profile picture when at least 3 accounts within the dataset have the same profile picture. For the rule 5, we consider as tweets posted from API all those tweets not being posted from the websitetwitter.com. For rules 6 and 7, when looking for an account’s friends or followers list, Twitter only gives information about the current list, with no details about past friends or followers. Moreover, Twitter does not disclose any temporal data related to the moment a user stared following, or got followed by, another user. This means that the only way to check a user’s follow/unfollow behavior (rule 7) is to continuously monitor full friends and followers complete lists. The same applies with respect to the measurement of the delay experienced when a user follows (and replies to) other users (rule 6). As further detailed in Section 6, the Twitter rate limits in the use of the APIs makes it practically infeasible to monitor friends and followers lists of even a small group of users. Therefore, we did not apply rules 6 and 7 to our datasets, since that would require to continually monitor those accounts. This also means that those rules cannot be used to support an automatic detection process, since they require an interactive process to be evaluated.
4.3. Socialbakers’ FakeFollowerCheck
Several companies provide online tools to classify Twitter followers based on theirfakenessdegree. Here, we consider the “FakeFollowerCheck tool”, by Socialbakers [14]. While the company website provides eight criteria to evaluate the fakeness degree of the followers of a certain account, it omits details on how to combine such criteria to classify the accounts. We contacted their customer service, but we were answered that “how the respective criteria are measured is rather an internal information”. The FakeFollowerCheck tool analyzes the followers of an account and considers them likely fake when the criteria listed in Table 4 are satisfied.
For the rule 2, we consider as spam phrases expressions like “diet” or “make money” or “work from home” (both English and Italian translations), as suggested by the website of Socialbakers.
4.4. Evaluation methodology
All the criteria detailed above have been applied to the 2 verified human accounts datasets (TFP and
1. the ratio friends
followers of the account under investigation is 50:1, or more;
5. more than 90% of the account tweets are links;
2. more than 30% of all the tweets of the account use spam phrases, such as “diet”, “make money” and “work from home”;
6. the account has never tweeted;
3. the same tweets are repeated more than three times, even when posted to different accounts;
7. the account is more than two months old and still has a default profile image;
4. more than 90% of the account tweets are retweets; 8. the user did not fill in neither bio nor location and, at the same time, he/she is following more than 100 accounts. Table 4: Socialbakers rule set.
INT ∪TWT), as described in Section 3.
We conducted one experiment for each rule, considering two classes of accounts, the fake followers and the human ones. To summarize the outcomes of each experiment, we considered some evaluation metrics based on four standard indicators, namely:
• True Positive (TP): the number of those fake followers recognized by the rule as fake followers; • True Negative (TN): the number of those human followers recognized by the rule as human followers; • False Positive (FP): the number of those human followers recognized by the rule as fake followers; • False Negative (FN): the number of those fake followers recognized by the rule as human followers. The meaning of each indicator is graphically highlighted by the matrix in Table 5 (called the confusion matrix), where each column represents the instances in the predicted class, while each row represents the instances in the actual class [36]: In order to evaluate the application of each single rule to the accounts in
predicted class
actual class human fake
human TN FP
fake FN TP
Table 5: Confusion matrix.
the baseline dataset, we consider the following standard evaluation metrics:
• Accuracy: the proportion of predicted true results (both true positives and true negatives) in the population, that is TP+TN
TP+TN+FP+FN;
• Precision: the proportion of predicted positive cases that are indeed real positive, that is TP TP+FP; • Recall (or also Sensitivity): the proportion of real positive cases that are indeed predicted positive,
that is TP+FNTP ;
• Matthew Correlation Coefficient (MCC from now on) [37]: the estimator of the correlation between the predicted class and the real class of the samples, defined as:
TP·TN - FP·F N
p
(TP+FN)(TP+FP)(TN+FP)(TN+FN)
Each of the above measures captures a different aspect of the prediction quality of the samples that belong to the relevant class (the fake followers, in our dataset). Accuracymeasures how many samples are correctly identified in both of the classes, but it does not express if the relevant class is better recognized than the other one. Moreover, there are situations where some predictive models perform better than others, even having a lower accuracy [38]. A highPrecision indicates that many of the samples identified as relevant are correctly recognized, but it does not give any information about the relevant samples which have not been identified. This information is provided by theRecall metric, that expresses how many samples, in the whole set of relevant samples, have been correctly recognized: a low recall means that many relevant samples are left unidentified. F-Measure and MCC try to convey in one single value the quality of a prediction, combining the other metrics. Furthermore,MCC is considered the unbiased version of theF-Measure, since it uses all the four elements of the confusion matrix [38]. AnMCC value close to 1 means that the prediction is really accurate; a value close to 0 means that the prediction is no better than random guess, and a value close to -1 means that the prediction is heavily in disagreement with the real class. Then, we consider as best rules those criteria whose application givesMCC≥0.6, since such rules have the strongest correlation with the typology of the accounts. For completeness, when available, we also report the area-under-the-curve metric (AUC), that is the area under the Receiver Operating Characteristic (ROC) curve [39]. The latter is the curve that depicts the performance of a classifier considering the percentage of true positive samples compared with the percentage of false positive samples. TheAUC is used to summarize ROC curves in a single value: the more the area approaches to 1, the more capable is the classifier.
Finally, we also report the Information Gain (I gain) and the Pearson Correlation Coefficient (Pcc). While the Pearson correlation coefficient can detect linear dependencies between a feature and the tar-get class, the information gain considers a more general dependence, leveraging probability densities (or frequencies, in case of discrete variables). More precisely, the information gain is a measure about the in-formativeness of a feature with respect to the predicting class and it is typically adopted to train machine learning classifiers. It can be informally defined as the expected reduction in entropy caused by the knowl-edge of the value of a given attribute [40]. We compute two information gains: I gain about the outcome of the rule andI gain* about the attribute used by the rule. ForI gain, a rule based on attributeAcan only assume the values 0 (not satisfied) and 1 (satisfied), while for I gain*, the attribute A can assume much heterogeneous values. For example, when evaluating the information gain of the rule “followers≥ 30”, a sample with 234 followers contributes with value 1 when we computeI gain, and with value 234 when we computeI gain∗. The Pearson correlation coefficient, instead, is a measure of the strength of the linear
rela-outcome
dataset real humans humans bots neutral
TFP (@TheFakeProject) 469 456 3 10
E13 (#elezioni2013) 1481 1480 0 1
FSF ∪INT ∪TWT (100% fake foll.) 0 2889 185 277
Table 6: Camisani-Calzolari algorithm prediction outcome.
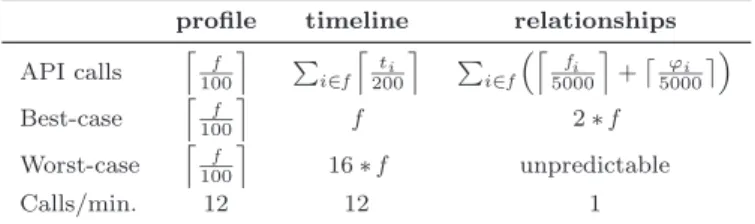
evaluation metrics
algorithm accuracy precision recall F-M. MCC
CC algorithm♯ 0.548 0.974 0.062 0.116 0.175
Table 7: Evaluation of Camisani-Calzolari algorithm (CC algorithm) [12]. Training set: BAS (1950 humans and 1950 fake followers). (♯): the CC algorithm classified 163 accounts as neutral.
tionship between two random variablesX andY [41, 42]. Again , we computePcc, considering the outcome of the satisfaction of the rule (namely: true=1 or false=0) and Pcc*, based on the value assumed by the attribute used to evaluate the rule. Our experiments in the following sections will show that, generally, a rule and the corresponding attribute assume very different values for the information gain and the Pearson correlation coefficient.
4.5. Evaluation of Camisani-Calzolari algorithm
The detection algorithm in [12] aggregates the 22 criteria for identifying human and bot behavior, introduced in Section 4.1. The algorithm evaluates every single rule on the account under investigation, and it assigns a positive human score or a negative bot score, according to the output of the rule application. The final outcome depends on the global score obtained by the account: if the result is a score greater than 0, then the account is marked ashuman; if it is between 0 and -4, it is marked asneutral; otherwise, it is marked asbot.
Table 6 details the results of running the algorithm over the complete dataset, including the FAK set, namely all the bought fake followers accounts. Although obtaining very good results in detecting the real human accounts, the algorithm achieves a poor fake follower account detection. Most of the accounts have been erroneously tagged as humans too, mainly because the fake followers in our dataset have characteristics that easily make them achieve a human score higher than the bot one.
The above inability to detect the fake accounts is evident in the results of our second experiment. To evaluate the algorithm, we used it to predict the class of the accounts of our baseline dataset (BAS), reporting the evaluation of the final prediction in Table 7. As expected, the algorithm has a poor accuracy (very close to 0.5) and a high precision, meaning that the (few) accounts identified as fake are effectively fake. However, it also has a very low recall, meaning that many of the other fake accounts were unidentified as fake. This poor performance is also expressed by aF-Measureclose to 0.1 and by the lowMCC value.
evaluation metrics
rule description accuracy precision recall F-M. MCC I gain I gain∗ Pcc Pcc∗
Camisani-Calzolari[12] (satisfaction of rules means human behavior)
1 profile has name 0.5 — — — — 0 0 0 0
2 profile has image 0.496 0.095 0.001 0.002 -0.06 0.003 0.003 0.06 0.06 3 profile has address 0.419 0.336 0.166 0.222 -0.187 0.026 0.026 0.187 0.187 4 profile has biography 0.621 0.811 0.316 0.455 0.306 0.072 0.072 0.306 0.306
5 followers≥30 0.881 0.834 0.95 0.888 0.768 0.493 0.525 0.768 0.045
6 belongs to a list 0.755 0.678 0.971 0.799 0.566 0.268 0.275 0.566 0.127
7 tweets≥50 0.865 0.909 0.811 0.857 0.735 0.439 0.621 0.735 0.289
8 geo-localization 0.667 0.602 0.986 0.748 0.434 0.163 0.166 0.434 0.188 9 has URL in profile 0.665 0.602 0.972 0.743 0.417 0.144 0.144 0.417 0.417
10 in favorites 0.738 0.848 0.579 0.689 0.502 0.195 0.44 0.502 0.30
11 uses punctuation in tweets 0.523 0.979 0.048 0.091 0.151 0.023 0.63 0.161 0.58
12 uses hashtags 0.608 0.965 0.224 0.364 0.337 0.1 0.677 0.337 0.521
13 uses iPhone to log in 0.705 0.633 0.977 0.768 0.489 0.202 0.219 0.489 0.293 14 uses Android to log in 0.669 0.603 0.991 0.75 0.442 0.164 0.176 0.446 0.242 15 has connected with Foursquare 0.565 0.535 0.996 0.696 0.257 0.173 0.173 0.442 0.199 16 has connected with Instagram 0.683 0.616 0.969 0.753 0.446 0.06 0.06 0.258 0.144 17 uses the website Twitter.com 0.508 0.572 0.067 0.12 0.036 0.003 0.347 0.061 0.374 18 has tweeted a userID 0.772 0.992 0.549 0.707 0.609 0.334 0.752 0.609 0.544 19 2*followers≥friends 0.721 0.642 0.998 0.781 0.531 0.26 0.26 0.531 0.531 20 tweets do not just contain URLs 0.53 0.947 0.064 0.12 0.167 0.299 0.673 0.587 0.403 21 retwitted tweets≥1 0.753 0.967 0.524 0.679 0.569 0.278 0.722 0.569 0.49 22 uses different clients to log in 0.524 0.819 0.061 0.113 0.125 0.018 0.629 0.144 0.55 Van Den Beld (State of search)[11] (satisfaction of rules means bot behavior)
1 botin biography 0.5 — — — — 0 0 0 0
2 following:followers = 100:1 0.541 0.541 1 0.15 0.205 0 0 0.006 0.006
3 same sentence to many accounts 0.438 0.438 0.78 0.146 -0.169 0.444 0.444 0.74 0.74
4 duplicate profile pictures 0.471 0.471 0.928 0.025 -0.146 0 0 0 0
5 tweet from API 0.118 0.118 0.017 0.2 -0.779 0.528 0.694 0.779 0.505
Socialbakers[14] (satisfaction of rules means fake behavior)
1 friends:followers≥50:1 0.581 0.997 0.162 0.279 0.296 0 0 0.011 0.011
2 tweets spam phrases 0.501 1 0.003 0.005 0.036 0.435 0.45 0.719 0.404
3 same tweet≥3 0.348 0.046 0.015 0.023 -0.407 0.166 0.317 0.441 0.284
4 retweets≥90% 0.499 0.452 0.007 0.014 -0.009 0 0.478 0.007 0.555
5 tweet-links≥90% 0.511 0.806 0.03 0.057 0.084 0.006 0.401 0.087 0.353
6 0 tweets 0.521 0.988 0.043 0.083 0.146 0.02 0.621 0.146 0.289
7 default image after 2 months 0.496 0.095 0.001 0.002 -0.06 0.003 0.003 0.06 0.06 8 no bio, no location, friends≥100 0.559 0.917 0.131 0.229 0.231 0.004 0.004 0.079 0.079
Table 8: Rules evaluation.
4.6. Single rule evaluation
In this section, we analyze the effectiveness of each single rule, as designed by the original authors, in order to evaluate which rule can be considered as a good criterion for the detection of fake Twitter followers. Table 8 summarizes the results obtained by the application of each rule introduced in Sections 4.1, 4.2, and 4.3 to our BAS dataset. In Table 8, we highlighted the rules achieving highMCCvalues. As shown, only three rules obtained a value higher than 0.6, namely: (1) the threshold of at least 30 followers, (2) the threshold of at least 50 tweets, and (3) the use of a userID in at least one tweet.
As expected by the definition ofMCC, such rules also exhibit a combination of high accuracy, precision, and recall. However, it is worth observing the values for the information gain and the Pearson correlation coefficient. The information gain of the rules (I gain) is always lower than the evaluation of the related attributeI gain*, while this is not true for the Pearson correlation coefficient (PccandPcc*). Actually, this happens becausePccevaluates the linear dependency between two variables that assume very similar values, namely the output of the rule and the class, while the Pcc* considers variables with more heterogeneous
values. In the first case, indeed, both the variables class and the output can assume only the values 0 and 1: the class can be either 0 (human) or 1 (fake), the rules can output either 0 (false, for example,account does not have more than 50 tweets) or 1 (true, for example,account has more than 50 tweets). Instead, for thePcc* , the attribute of a rule (in the example, the number of tweets) can assume much higher values (account has 234 tweets). This is clearly not linearly dependent on the class values, resulting in lower values for thePcc* with respect to the Pcc[41].
Thus, for each rule listed in Section 4.1 (top part of Table 8), it is meaningless to compare thePcc and Pcc∗ values. Instead, we need to focus only on the same type of metric, namely by column, to compare the linear dependency of the feature with the class. Then, directing our attention to the information gain, we notice that many of the rules take into account attributes that are effectively able to perform the discrimination between the two classes. If we consider as useful the rules and features that have an information gain value higher than 0.5, we observe that, even if many rules exhibit a very lowI gain, their “feature” version becomes much more interesting: for example, rules 18, 20, 21 and 22 have an evident increase in their information gain when used as features. Thus, we can derive that the rule is based on a right assumption (for example, the use of hashtags), but the rule definition is too simple to be effective: the algorithm proposed by [12] is simply too naive for the complex task of fake accounts detection in Twitter. Coincidentally, we have that the best performing rules also show the highest Pcc values, namely their satisfaction is more strongly related to the belonging class. Concerning the features underlying the rules, we find that thePcc∗ is strongly reduced because, as above noticed, they can (and indeed do) assume very high values and this severely affects the linear correlation with the class.
Observing the other rules of Table 8, we can notice how none of the criteria suggested by online blogs and by Socialbakers’ FakeFollowerCheck are successful in detecting the fake followers in our dataset. As an example, all rules by Van Den Beld have accuracy and precision close to 0.5 or a very low recall. Also, we observe that “tweet from API” has anMCC of -0.779, meaning that it is strictly related to the class of the account, but by an inverse factor: in our dataset, fake followers accounts almost never tweet from API (instead, they use Twitter.com to tweet), whereas human accounts have posted at least once from outside the website. This is exactly the opposite behavior than that suggested by the blogger for bots, that (are supposed to) almost exclusively post tweets using API. The relevance to the prediction task is also confirmed by both theI gain/I gain∗ and thePcc/Pcc∗ values.
Another interesting observation is that many rules proposed by Socialbakers haveMCC values close to 0, meaning that their outcomes are almost unrelated with the class of the accounts. Indeed, the large majority of the accounts are recognized as humans, resulting in a high precision, accuracy around 0.5 and very low recall. The exception is rule 6, “0 tweets”: as a rule, it has an information gain value of 0.02, but when considered as a feature (i.e., number of tweets) it obtains 0.621. Similarly, rules 4 and 5 are much more useful for the detection process when considering their underlying features (namely, number of retweets and
number of tweets with URLs). Summarizing, independently from the typology of the account, the rules are almost always satisfied, leading to a severe flaw when dealing with fake followers detection.
5. Fake detection with algorithms based on feature sets
In this section, we examine works in [8, 2] that address spam account detection on Twitter. Both of them propose a list of features to be extracted from manually classified datasets of accounts. Such feature sets are then used to train and test machine learning classifiers in order to distinguish between humans and spammers. Even if the proposed features have been originally designed for spam detection, here, for the first time, we consider them to spot another category of Twitter accounts, i.e., the fake followers. Although many other works exist in literature focused on Twitter spam detection (see Section 2), many of them consider features that can be in some way assimilated to those analyzed in this and in the previous section.
Differently from the rule-based algorithms in Section 4, features are here presented as quantifications of properties of the considered samples. Therefore, they are introduced without any prior knowledge about the values for the features that will characterize the considered classes. Only after the training phase, it will be possible to observe which are the most frequent values for the features within the different classes.
For our analysis, we employ classifiers that produce both box” and “black-box” models. In “glass-box” models, such as Decision Trees and Regression Models, the inner structure of the models can be understood by humans, also providing insights on how the classifiers identify fake accounts [39]. Instead, in “black-box” models, such as Support Vector Machines, the inner structure of the model does not have a direct human-explicable correspondence.
5.1. Detecting spammers in social networks
The study presented in [8] focuses on spambot detection. The authors exploit several characteristics that can be gathered crawling an account’s details, both from its profile and timeline. For each investigated account, such characteristics are exploited in a Random Forest algorithm [23, 43], that outputs if the account is a spambot or not. The results of the analysis in [8] depicted some interesting features of the spambot accounts under investigation, as reported in Table 9.
1. spambots do not have thousands of friends; 4. spambots have a high tweets containing URLstotal tweets ratio (URL ratio);
2. spambots have sent less than 20 tweets; 5. spambots have a high (followersˆ2friends ) ratio value (i.e., lower ratio values mean legitimate users).
3. the content of spambots’ tweets exhibits the so-called
message similarity;
Table 9: Feature set proposed by Stringhiniet al.[8].
To evaluate feature 3, we implement the notion of message similarity by checking the existence of at least two tweets, in the last 15 tweets of the account timeline, in which 4 consecutive words are equal. This notion has been given in a later work by the same authors [25].
Without the original training set, we were unable to reproduce the same classifier, but we picked the five features and used them to train a set of classifiers with ourBAS dataset. The results are reported in Table 12 of Section 5.3.
5.2. Fighting evolving Twitter spammers
The authors of [2] observed that Twitter spammers often modify their behavior in order to evade existing spam detection techniques. Thus, they suggested to consider some new features, making evasion more difficult for spammers. Beyond the features directly available from the account profile lookup, the authors propose some graph-, automation-, and timing-based features. In Table 10 we detail nine of them, together with the outcome of their analysis in [2].
1. age of the account (this feature also appears in [28]): the more an account is aged, the more it could be considered a good one;
6. API ratio(total number of tweetstweets sent from API): higher values for suspicious accounts;
2. bidirectional link ratio (bidirectional linksfriends ), where a bidirec-tional link occurs when two accounts follow each other: this feature has been tested to be lower for spammer accounts than for legitimate accounts;
7. API URL ratio(tweets sent from API and containing URLstotal number of tweets sent from API ): such ratio is higher for suspicious accounts;
3.average neighbors’ followers: the average number of followers of the account’s friends. This feature aims at reflecting the quality of the choice of friends of an account. The feature has been found to be commonly higher for legitimate accounts than for spammers;
8. API tweet similarity: this metric considers only the number of similar tweets sent from API. The notion of tweet similarity is as in Section 5.1. This metric is higher for suspicious accounts;
4. average neighbors’ tweets: the average number of tweets of the account’s followers. This feature is lower for spammers than for legitimate accounts;
9. following rate: this metric reflects the speed at which an accounts follows other accounts. Spammers usually feature high values of this rate.
5. followings to median neighbor’s followers: defined as the ratio between the number of friends and the median of the fol-lowers of its friends. This feature has been found higher for spammers than for legitimate accounts;
Table 10: Feature set proposed by Yanget al.[2].
The authors of [2] combine their features in four different machine learning classifiers and compare their implementation with other existing approaches. We were unable to completely reproduce the machine learning classifiers in [2], since we had a different dataset. Instead, here we evaluate how those features, which proved to be quite robust against evasion techniques adopted by spammers, perform in detecting fake Twitter followers. As in [2], the following rate (feature 9) has been approximated with the ratiofriends/age, since a precise evaluation would require to know the evolution of the number of friends of an account, but this is, indeed, publicly unavailable.
Finally, in [2] there are also other features in addition to those mentioned above. However, as claimed by the same authors, they are less robust with regards to evasion techniques and thus we decided not to include them in our evaluation.
evaluation metrics
feature description I gain Pcc
Stringhini et al.[8]
1 number of friends 0.263 0.030
2 number of tweets 0.621 0.289
3 content of tweets 0.444 0.740
4 URL ratio in tweets 0.401 0.353 5 (followersˆ2friends ) 0.733 0.169
Yang et al.[2]
1 age 0.539 0.436
2 bidirectional links ratio 0.905 0.875 3 avg. followers of friends 0.327 0.254 4 avg. tweets of friends 0.203 0.235 5 firends / med. foll. of friends 0.336 0.102
6 api ratio 0.544 0.635
7 api url ratio 0.058 0.113
8 api tweet similarity 0.460 0.748
9 following rate 0.355 0.214
Table 11: Evaluation of the single feature.
5.3. Evaluation
As done for the rule set in Section 4, we report in Table 11 the evaluation of the information gain and the Pearson correlation coefficient for all the features within the BAS dataset. Also in this case, since the Pccevaluates the linear dependence between the considered feature and the class (that can only be 0 or 1), it produces results that are slightly different when compared to the information gain. Observing the results in Table 11, we can identify several promising features: “number of tweets” (already noticed in Section 4), “ratio between friends and followersˆ2”, “bidirectional links ratio” and “API ratio”. The beneficial effect of the bi-link ratio will be further confirmed by the experiments of Section 5.4.3.
To evaluate the combined effectiveness of the feature sets described in Sections 5.1 and 5.2 on detecting fake follower accounts, we employed 8 classifiers, obtained from different machine learning-based algorithms, namely: Decorate (D), Adaptive Boost (AB), Random Forest (RF), Decision Tree (J48), Bayesian Net-work (BN), k-Nearest Neighbors (kNN), Multinomial Ridge Logistic Regression (LR) and a Support Vector Machine (SVM). Our SVM classifier exploits a Radial Basis Function (RBF) kernel and has been trained using libSVM as the machine learning algorithm [44]. During the training phase of the SVM, thecost and gammaparameters have been optimized via a grid search algorithm. Similarly, thek parameter of the kNN classifier and the ridge penalizing parameter of the LR model have been optimized via a cross validation parameter selection algorithm. All the classifiers and the optimization algorithms employed in this work are implemented within the Weka framework [43].
Among these algorithms, RF was the only one used in [8]. Instead, authors of [2] employed D, RF, J48 and BN. We have decided to include AB in our work, since it is considered one of the most effective machine learning algorithms for classification tasks [39]. Furthermore, we also added other well-known and widely adopted classifiers, which are based on different classification techniques, such as SVM, kNN and LR,
evaluation metrics
algorithm accuracy precision recall F-M. MCC AUC
Classifiers based on feature set by Yang et al. [2]
RF Random Forest 0.991 0.991 0.991 0.991 0.983 0.998 D Decorate 0.991 0.988 0.993 0.991 0.983 0.998 J48 Decision Tree 0.990 0.991 0.989 0.990 0.980 0.997 AB Adaptive Boosting 0.988 0.989 0.987 0.988 0.974 0.999 BN Bayesian Network 0.976 0.994 0.958 0.976 0.936 0.997 kNN k-Nearest Neighbors 0.966 0.966 0.966 0.966 0.932 0.983 LR Logistic Regression 0.969 0.966 0.973 0.969 0.939 0.996 SVM Support Vector Machine 0.989 0.985 0.993 0.989 0.976 0.989
Classifiers based on feature set by Stringhini et al. [8]
RF Random Forest 0.981 0.983 0.979 0.981 0.961 0.995 D Decorate 0.982 0.984 0.979 0.981 0.961 0.993 J48 Decision Tree 0.979 0.984 0.974 0.979 0.953 0.985 AB Adaptive Boosting 0.968 0.965 0.970 0.968 0.938 0.995 BN Bayesian Network 0.953 0.953 0.953 0.953 0.907 0.985 kNN k-Nearest Neighbors 0.954 0.961 0.946 0.953 0.907 0.974 LR Logistic Regression 0.927 0.921 0.935 0.928 0.855 0.974 SVM Support Vector Machine 0.959 0.967 0.950 0.958 0.917 0.958
Table 12: Performance comparison for 10-fold cross validation. Training set: BAS.
in order to perform a thorough evaluation of our detection system.We have built 8 classifiers adopting the features in Sections 5.1 and 5.2 and we have trained the models using our baseline (BAS) dataset. Then, we have used a 10-fold cross validation [23] to estimate the performances of each obtained classifier. As for the rule-based algorithms in Section 4.4, we look at the MCC as the preferred metric to assess the classifiers’ performances. Table 12 summarises the results. The highest values for each metric are shown in bold.
We can observe that all the classifiers have an excellent prediction capability. The ones built over the feature set of [2] achieve slightly better results. In particular, the RF, J48 and D classifiers haveMCCgreater than 0.98. Similarly, precision and recall are around 0.99 for all of them. In addition, all the classifiers based on the feature set by [2] have a higherAUC, when compared with the ones built with the feature set by [8]. Anyway, the latter also obtain high detection levels: accuracy, precision, and recall are around 0.98 for RF, D and J48, with a MCC of around 0.96. The lower precision and recall with respect to the ones obtained using the set of Yanget al.[2] show that the features of Stringhiniet al.[8] exhibit the tendency to consider as fake followers some human accounts. With both the [2] and [8] feature sets, BN, kNN and LR classifiers achieve, overall, worse performances. The SVM classifier, instead, achieves remarkable results, especially with the feature set of [2]. Indeed, in this experiment SVM scores only slightly worse than RF, D and J48, and better than AB. Whereas, AB achieves extremely high performances when evaluated with the AUC metric. Finally, among all the considered classifiers and evaluation metrics, RF and D are the ones that have been proved to be more consistent.
Overall, even if some small differences can be observed in the evaluation metrics, all the classifiers almost correctly distinguish between human and fake follower accounts, for our baselineBAS dataset. The feature-based classifiers are indisputably more accurate for fake follower detection when compared with the CC
algorithm, that does not perform well within our dataset, as observed in Section 4.5 above. 5.4. Discussion
By examining the internal structure of the classifiers, we get insights about the best features that con-tribute more to distinguish between human and fake followers. In the case of decision trees, the best features are the ones closer to the root and the classifier automatically finds the numeric thresholds characterizing, for a given feature, the borderline between human and fake followers. It is worth noting that also the Dec-orate, AdaBoost, and Random Forest algorithms exploit, ultimately, combinations of simple decision tree classifiers. Despite their very good performance, they have the disadvantage of being difficult to analyze, since they can consist in tens of individual trees that interact together. Then, we only focus on the J48 classifier (a single decision tree) to examine how the features are applied during the classification process. 5.4.1. Differences between fake followers and spam accounts
Looking at the tree structure, we observe some interesting differences between the fake followers in our
BAS dataset and the spam accounts characterized in [8] and [2]. For example, the featureURL ratio has been found to have a higher value for spammers than for legitimate users, as highlighted in [8] (Section 5.1). Observing the tree structure of our J48 classifier, instead, low values for this feature characterize fake followers, compared with higher values that indicate human accounts in our baseline dataset. More than 72% of the fake followers in our training dataset have a URL ratio lower than 0.05, oppositely to 14% of human accounts. Similarly, theAPI ratio feature has been found higher for spammers than for legitimate accounts ([2], see also Section 5.2). In our dataset, the API ratio is lower than 0.0001 for 78% of fake followers. A similar behavior has been observed for the average neighbor’s tweets feature, that has been found to be lower for spammers in [2], but higher for our fake followers.
These initial observations highlight a behavioral difference between a spam account and a fake follower. In particular, fake followers appear to be more passive compared to spammers and they do not make use of automated mechanisms for posting their tweets, as spammers usually do.
5.4.2. Reducing overfitting
It is well known that trained classifiers can be subject to “overfitting”, namely the problem of being too specialized on the training dataset and unable to generalize the classification to new and unseen data [45].
A simple way to avoid overfitting is to keep the classifier as simple as possible. In case of a decision tree algorithm, for example, one solution could be reducing the number of nodes and, possibly, the height of the tree. The decision tree obtained with the feature set of Stringhiniet al.[8] has 22 leaves, 43 nodes, and a height of 7, whereas the best feature is thefriends/(followersˆ2) ratio that places at the root. The decision tree with the feature set of Yanget al.[2] has 17 leaves, 33 nodes and a height of 8, with the bi-directional link ratio as the root.
tree details evaluation metrics
pruning method nodes leaves height accuracy precision recall F-M. MCC AUC
Decision tree based on feature set of Stringhini et al.[8]
subtree raising 0.25 43 22 7 0.979 0.984 0.974 0.979 0.953 0.985 reduced error 3 folds 31 16 5 0.975 0.971 0.971 0.971 0.943 0.989 reduced error 50 folds 9 5 4 0.964 0.957 0.957 0.957 0.914 0.984
Decision tree based on feature set of Yang et al.[2]
subtree raising 0.25 33 17 8 0.99 0.991 0.989 0.99 0.98 0.997
reduced error 3 folds 19 10 5 0.988 0.99 0.987 0.988 0.976 0.993 reduced error 50 folds 11 6 3 0.982 0.979 0.985 0.982 0.966 0.993
Decision tree based on feature set of Yang et al.[2], without the bi-link ratio feature
subtree raising 0.25 101 51 10 0.96 0.963 0.957 0.96 0.917 0.971 reduced error 3 folds 53 27 8 0.961 0.969 0.952 0.96 0.914 0.978 reduced error 50 folds 37 19 9 0.933 0.931 0.934 0.933 0.866 0.967
Table 13: Performance comparison with increased pruning. 10-fold cross validation. Training set:BAS.
A common practice to generalize the classifiers is the adoption of a more aggressive pruning strategy, e.g., by using the reduce-error pruning with small test sets [23, 43]. Adopting this strategy, we were able to obtain simpler trees with a lower number of nodes and a very reduced height. Such simpler trees generally use subsets of the feature set, still maintaining very good performance on ourBAS dataset.
Table 13 reports the characteristics and the performance of the experiments we have carried out, varying the pruning strategy. It is worth noting that the complexity of the tree is not always directly connected to an improvement in the detection capability: for example, for the feature set of Yanget al.[2], reducing the number of nodes from 33 to 11 decreases the accuracy of 0.007 and the MCC of 0.014, only. Similarly, the values for AUC remain almost the same between the pruned and the not pruned versions of the tree. Furthermore, we clearly observe that the pruned version of Stringhini et al.[8] reduces its recall of 0.017, while the one of Yanget al.[2] only drops of 0.004, meaning that the latter is able to miss fewer fakes than the former one after pruning. This is also evident from the higher reduction of bothF-Measure andMCC. We think that this increased effectiveness is a direct consequence of the quality of the used features. Overall, the results of this experiment show that, even reducing the features, it is possible to have a detection rate higher than 0.95 (as in the last lines of Table 13, for [8] and [2], respectively). For instance, in those two experiments, the features used by the pruned tree were onlybi-directional link ratio, theaverage neighbors’ followers, theage, and thefollowings to median neighbors’ followers as a subset of the original feature set of Yang et al. [2], and the friends/(followersˆ2), URL ratio, and number of friends as the subset for the Stringhiniet al. [8] original feature set.
5.4.3. Bidirectional link ratio
In Section 5.3 we observed that the bidirectional link ratio had the highest information gain among all the considered features. In order to test if this is the decisive feature to distinguish between humans and fake followers and how much it influences the detection process, we compare the results of the previous
![Table 1: Statistics about total collected data [33].](https://thumb-us.123doks.com/thumbv2/123dok_us/931930.2620796/9.892.150.745.178.347/table-statistics-about-total-collected-data.webp)
![Table 7: Evaluation of Camisani-Calzolari algorithm (CC algorithm) [12]. Training set: BAS (1950 humans and 1950 fake followers)](https://thumb-us.123doks.com/thumbv2/123dok_us/931930.2620796/15.892.257.638.308.374/table-evaluation-camisani-calzolari-algorithm-algorithm-training-followers.webp)