February 2008, Volume 24, Issue 1. http://www.jstatsoft.org/
statnet
: Software Tools for the Representation,
Visualization, Analysis and Simulation of Network
Data
Mark S. Handcock University of Washington
David R. Hunter Penn State University
Carter T. Butts University of California, Irvine
Steven M. Goodreau University of Washington
Martina Morris University of Washington
Abstract
statnetis a suite of software packages for statistical network analysis. The packages im-plement recent advances in network modeling based on exponential-family random graph models (ERGM). The components of the package provide a comprehensive framework for ERGM-based network modeling, including tools for model estimation, model evaluation, model-based network simulation, and network visualization. This broad functionality is powered by a central Markov chain Monte Carlo (MCMC) algorithm. The coding is optimized for speed and robustness.
Keywords: exponential-family random graph model, Markov chain Monte Carlo, networks, random graph models.
1. Introduction
statnet is a suite of software packages for statistical network analysis in R (R Development Core Team 2007) that implements recent advances in the statistical modeling of random networks. The models, based on statistical exponential families (“exponential-family random graph models,” or ERGMs), generalize the p1 (Holland and Leinhardt 1981) and Markov random graph (Frank and Strauss 1986) models first developed in the social network literature. These in turn derive from developments in spatial statistics (Besag 1974). The general form is sometimes referred to as “p-star” or “p∗” in the social network literature (Wasserman and Pattison 1996), reflecting its early origins.
Networks are a form of “relational data,” i.e., data whose properties cannot be reduced to the attributes of the individuals (nodes) involved. The relation, or “tie,” is the object of (and unit of) analysis. Relational data arise in many fields, and are central to the concept of “social” in the social sciences. In typical applications, the nodes in a network represent individuals, and the links (edges) represent a specified relationship between individuals. Nodes can also be used to represent larger social units (groups, families, organizations), objects (physical resources, servers, locations), or even abstract entities (concepts, texts, tasks, random variables). In network modeling, our goal is to predict the joint probability that a set of edges exists on nodes in a network. An edge can be binary or valued, directed or undirected. In general, these edges are not independent, and that is the challenge for both model specification and estimation. ERGMs were developed to address the complex dependencies within relational data structures and provide a flexible framework for representing them. Simple examples include degree distributions, stars, nodal attribute-based mixing, triangles and other higher order cycles that lead to clustering, and mutuality and transitivity in directed networks. These observed network statistics are properly regarded as outcomes, and the goal of the model is to specify the process that leads to their joint distribution. The terms in an ERG model that represent this process are also network statistics. The statistics for process and outcome may sometimes coincide – for example, a propensity for triad closure leading to a large number of triangles in a network would lead to a model with a term for the number of triangles. But the same outcome may arise from an alternative underlying process – for example, a propensity for within-group partners leads to triad closure when groups are small (Goodreau, Kitts, and Morris 2008b), and this would lead to a model with terms for the relative frequency of within-group ties. ERGMs provide a statistical framework for evaluating alternative hypotheses about the processes that lead to the observed outcomes.
Thestatnetsuite of packages provides a comprehensive framework for ERGM-based network modeling: tools for model estimation, for model evaluation and for model-based network simulation. This broad functionality is powered by a central Markov chain Monte Carlo (MCMC) algorithm that can easily handle networks of several thousand nodes or more, though the size of the problem is dictated more by the number of edges (and edge attributes) than by the number of nodes. See Hunter, Goodreau, and Handcock (2008a); Goodreau (2007); Goodreauet al.(2008b) for examples of large networks that may be handled bystatnet. For statistical inference, MCMC is used to approximate the likelihood function by sampling the space of possible networks. The sample is obtained by sequentially updating the values of dyads in the network according to a random schedule using a Metropolis-Hastings algorithm, creating a Markov chain of networks with the appropriate statistical properties (Hunter, Handcock, Butts, Goodreau, and Morris 2008b). The sequence produced by this algorithm can also be used as a method for simulating realizations of networks from the model, which in turn can be used for model evaluation. The algorithm can also be used to produce a dynamically changing network over time. The broad functionality of this MCMC algorithm provides a unifying coherent framework for modeling, and it extends the potential scope of network analysis: providing greater flexibility, range and insight into the generative principles of network formation, and a foundation for the analysis of diffusion across network structures. Network analysis is a rapidly growing field, and there are now a number of computer packages available that provide a wide range of analytical tools. The methodology in these packages falls into three general classes: descriptive techniques, permutation methods, and generative models. The classes range roughly along a continuum, from capturing static regularities in
network structure to testing models for the emergence of that structure.
Descriptive techniques include the traditional social network summaries drawn from the graph theoretic literature and reviewed inWasserman and Faust(1994). These seek to characterize the systematic patterns observed in networks (e.g., the degree distribution, the number of triangles, the centrality of nodes, or the centralization of the network as a whole), but there is no real statistical inference associated with these methods. Descriptive techniques are featured in established packages like UCINET (Borgatti, Everett, and Freeman 1999) and
Pajek(Batagelj and Mrvar 2007), and they are included in the sna (Butts 2007) package in R.
Permutation methods employ computationally intensive resampling to perform statistical in-ference for traditional statistical models on networks (e.g., the quadratic assignment proce-dure, QAP, for matrix regression). In this approach, the dependence among observations is treated simply as an obstacle to statistical inference that the permutation distribution al-lows one to ignore. Such procedures are available in UCINET (Borgatti et al. 1999), sna
and netperm (Butts 2006), and also in some traditional statistical environments like Stata (StataCorp. 2007).
Generative models provide a full stochastic representation of the process of network formation, which allows the dependence among observations to become the focus of the model. Simple examples include the Bernoulli model and the preferential attachment model, each of which represents a single type of network generating process, and the log-linear models for nodal attribute mixing that provide a class of generative mixing models. ERGMs are a very general class of generative models, which includes the Bernoulli, preferential attachment and mixing models as special cases. When fully specified, generative models also provide a framework for model evaluation and inference. Such fully specified ERGMs are currently available instatnet
andstocnet (Boer, Huisman, Snijders, and Zeggelink 2003).
2. Overview of
statnet
components
statnet(Handcock, Hunter, Butts, Goodreau, and Morris 2003b) is written in a combination of the open-source statistical languageR(RDevelopment Core Team 2007) and (ANSI standard) C (Kernighan and Ritchie 1988). It is usually used interactively, via a command line, from within theRgraphical user interface. It can also be used in non-interactive (or “batch”) mode to allow longer or multiple tasks to be processed without user interaction.
Thestatnet suite of packages, which includes two required components and several optional components, is available on the ComprehensiveRArchive Network (CRAN) athttp://CRAN. R-project.org/and also on thestatnet project Web site athttp://statnetproject.org/ The suite can be installed directly over the Internet using theinstall.packages command withinRas described inGoodreau, Handcock, Hunter, Butts, and Morris (2008a). To obtain a list of the functions available in any of thestatnet packages, type help(package = "<pkg name>"), as in
R> help(package = "ergm")
To obtain further information about a particular function, such as theergm function within the ergm package, typehelp("ergm")or simply?ergm for short.
The individual component packages of the statnet suite are listed below. Most of these packages are described in detail in the subsequent articles in this volume.
2.1. Required packages: ergm and network
ergm is a collection of functions to fit, simulate from, plot and evaluate exponential-family random graph models. The main functions within the ergm package are ergm, a function to fit exponential-family random graph models in which the probability of a network is dependent upon a vector of network statistics specified by the user;simulate, a function to simulate random networks using an ERGM; andgof, a function to evaluate the goodness of fit of an ERGM to the data. ergm contains many other functions as well; for a guide to the basic types of functionality these functions provide, see Hunter
et al. (2008b), Morris, Handcock, and Hunter (2008), and Goodreau et al. (2008a) in
this volume.
networkis a package to create, store, modify and plot the data in network objects. The network object class, defined in the network package (Butts, Handcock, and Hunter 2007; Butts 2008a), can represent a range of relational data types and it supports arbitrary vertex / edge / network attributes. Data stored as networkobjects can then be analyzed using all of the component packages in the statnetsuite.
2.2. Optional packages
The optional packages sna,degreenet,latentnet, and networksis are all available on CRAN:
sna: A set of tools for traditional social network analysis (Butts 2008b).
degreenet: This package was developed for the degree distributions of networks. It im-plements likelihood-based inference, bootstrapping, and model selection, and it includes power-law models such as the Yule and Waring as well as a range of alternative models that have been proposed in the literature. (Handcock 2003b). The theory behind these methods is described in Jones and Handcock (2003a,b); Handcock and Jones (2004, 2006).
latentnet: A package to fit and evaluate latent position and cluster models for statistical networks based on Hoff, Raftery, and Handcock (2002) and Handcock, Raftery, and Tantrum(2007). The probability of a tie is expressed as a function of distances between these nodes in a latent space as well as functions of observed dyadic level covariates. For details about this package, see Krivitsky and Handcock (2007) in this volume.
networksis: A package to simulate bipartite networks with fixed marginals through sequential importance sampling (Admiraal and Handcock 2007).
Additional optional packages are available on request, as described below.
dynamicnetwork: A set of tools for visualizing dynamically changing networks ( Bender-deMoll, Morris, and Moody 2008).
netperm: A package for permutation Models for relational data (Butts 2006). It pro-vides simulation and inference tools for exponential families of permutation models on relational structures.
rSoNIA: Provides a set of methods to facilitate exporting data and parameter settings and launchingSoNIA, which stands for Social Network Image Animator (Bender-deMoll and McFarland 2003). SoNIA facilitates interactive browsing of dynamic network data and exporting animations as a QuickTime (Apple Inc. 1999) movies.
3. Principles of ERGM-based network modeling
ERGMs represent the generative process of tie formation in networks, and there are two basic types of processes: dyadic dependent and dyadic independent. A dyad refers to a pair of nodes and the relations between them. Dyadic dependent processes are those in which the state of one dyad depends stochastically on the state of other dyads. A classic example is the concept that “the friend of my friend is my friend” — the presence of a friendship tie in dyads (i, j) and (j, k) increases the probability of a friendship tie in dyad (i, k). Dyadic independent processes exhibit no direct dependence among dyads: An example is the related social concept that “birds of a feather flock together” — if the two nodes in a dyad have similar attributes, the probability of a friendship tie is increased. The state of the dyad depends on the attributes of the two nodes, but not on the state of other dyads.
The distinction between these two types of processes affects the specification, estimation and behavior of ERG models. Models with only dyadic independent terms have a likelihood function that simplifies to a form that can be maximized using standard logistic regression methods. Intuition about how these models behave is usually straightforward, as for logistic regression models. By contrast, models for processes with dyadic dependence require compu-tationally intensive estimation and imply complex forms of feedback and global dependence that confound both intuition and estimation.
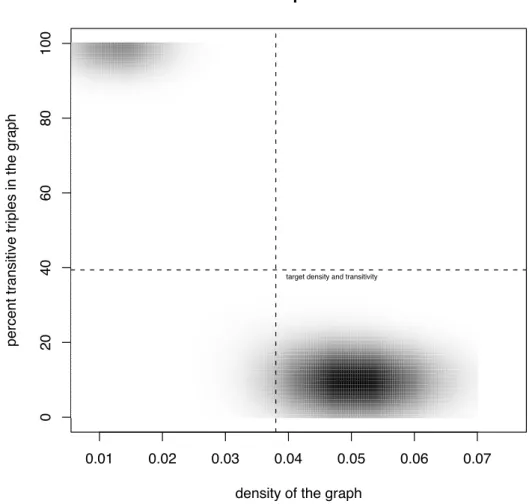
It can be difficult to specify a sensible model that contains dyadic dependent terms, since a model that seems reasonable may in fact have very counterintuitive implications. A good example comes from the recent literature on clustering in networks. Clustering is often rep-resented as a tendency to form closed triangles, and a common summary measure is the “mean clustering coefficient,” the number of triads with all three ties present divided by the number with at least two ties present. A natural ERGM analog for this is a model with two terms — the edge density and the mean clustering coefficient — and corresponding param-eters~θ= (θ1, θ2). The intuition seems straightforward; the density term governs the overall number of ties and the clustering term captures the propensity for, or against, triad closure relative to a Bernoulli random network. In most social networks, we would expect θ2 to be positive. But the distribution of networks produced by this model (obtained through sim-ulation) displays a bizarre pattern. First, for many combinations of possible values of the parameters in~θ, the model produces networks that are either full (every tie exists) or empty (no ties exist) with probability close to one. Second, even for parameters that do not produce these extremal networks, such as those illustrated in Figure 1, the distribution of networks produced by the model is often bimodal; one mode has low density and high triad closure, the other has high density and low triad closure. The model almost never produces networks at the average density and triad closure.
0.01 0.02 0.03 0.04 0.05 0.06 0.07 0 20 40 60 80 100
Distribution of Graphs from this model
density of the graph
percent transitive triples in the graph
target density and transitivity
Figure 1: Darker gray indicates higher probability density in this plot showing the true distribution of networks according to a particular two-statistic ERGM containing edge density and mean clustering coefficient. The population mean vector, specified by a particular choice of the model parameters, is shown at the intersection of the two dotted lines. The fact that there is very little probability mass near this mean is emblematic of degeneracy.
The technical term for this behavior is “model degeneracy,” and a detailed exposition of the topic and the example above can be found in Handcock (2003c) or Handcock (2003a). The intuition behind this problem is relatively simple. If we specify a model that is unlikely to produce the observed network, then one of two things can happen when this model is fit to the data: the maximum likelihood estimator (MLE) may exist, but it will not provide a good fit to the data, as in Figure 1; or the MLE may not exist, and the estimation will not converge properly (as in the extremal case above). Degeneracy is an indication of model mis-specification – not a shortcoming of the MCMC estimation procedure.
The solution to the degeneracy problem is to specify a model that is a better fit to the data, but this is often more difficult than usual. With linear models, for example, the estimated coefficients are linear functions of the observed data. These closed-form solutions can be used to construct predicted values, and mis-specification can be diagnosed by comparing observed to predicted values. With ERGMs, if the model is mis-specified and fails to produce an MLE,
the analyst can be left with little information to help guide the re-specification of the model. A technique that commonly leads to degeneracy when representing dyad dependent processes is the use of simple configuration counts or proportions (e.g., the number of triangles or the mean clustering coefficient) as model covariates. It may seem natural to represent a disproportionately high number of triangles in a network by a triangle term in the model. But because a single edge can complete a large number of triangles, the dyadic dependence effects amplify quickly, so a model with a positive coefficient on a triangle term will almost always lead to degenerate behavior. This is a form of “collapse” or threshold behavior well known in complex systems.
The goal is to develop substantively meaningful models in which the dependent process is properly constrained: to represent the additional heterogeneity in the process of tie formation that limits the range of dependence. One plausible mechanism is strong attribute mixing, which would reduce the impact of dependence beyond the preferred group of nodes: a triad created within the group is more likely than a triad created between groups. Another mecha-nism is a nonlinear impact of the dependent configuration, e.g., a tie completing two triangles is not twice as likely as a tie completing one triangle, but something less than that. This is similar to the classic declining marginal returns models in economics. The ergm package provides a flexible framework for representing such processes with “curved exponential family models” (Hunter and Handcock 2006). These allow one to specify a singleergm term that is a parametric summary of an entire distribution of statistics, such as degree statistics, instead of a nonparametric specification that uses one term for each value in the distribution. In some cases, model re-specification will simply require selecting differentergmterms from the list included in theergm package (Handcock, Hunter, Butts, Goodreau, and Morris 2003a). In other cases, it may require coding a newergm term using the methods provided for user-coded terms. As discussed in Morris et al. (2008), the terms in an ERGM are network statistics that must be calculated for the observed network, and for each step of the MCMC sequence. So every term requires its own algorithm. This is another way in which network ERGMs differ from traditional statistical models. In a traditional linear model, for example, the covariates are measured prior to estimation, and while they might be transformed as a part of model specification, most transformations are simple arithmetic operators on one or more vectors, and most interactions are simple products of vectors. Network statistics, by contrast, may require complex algorithms for their construction (e.g., a cycle census over the whole network). statnetincludes code for many of the most common network statistics used in the social network field, but the terms relevant for any particular network, or for networks outside the social sciences, may be different. Re-specifying an ERGM may not just be a simple matter of adding another term to the model; it may require writing a piece of program code to represent that term.
statnet provides a range of diagnostic tools to help identify when a model is degenerate, discussed in Goodreau et al. (2008a) and (Hunter et al. 2008b). Since statistical methods for simulating stochastic random networks have only recently been developed, the models and parameter values relevant to real networks are only beginning to be understood. A good discussion of model specification for social networks can be found inSnijders, Pattison, Robins, and Handcock(2006).
4. Other capabilities
statnet is a package that is undergoing long term development, and the statnet develop-ment team is continually adding functionality. We welcome your comdevelop-ments and even sug-gestions, though naturally we can not promise to respond to all requests! We also wel-come inquiries about becoming a member of the statnet development team. We sponsor a
statnet mail list for questions and discussions; sign-up is through the statnet Web page at http://statnetproject.org/. Further information about statnet is also available at the Web site.
Acknowledgments
The authors would like to acknowledge members of the statnet team, including Ryan Ad-miraal, Nicole Bohme, Susan Cassels, Krista Gile, Deven Hamilton, Aditya Khanna, Pavel Krivitsky, David Lockhart, and James Moody. This work was funded by two grants from the National Institutes of Health (R01-HD041877, R01-DA012831). DRH received additional funding from Le Studium, an agency of the Centre National de la Recherche Scientifique of France, and NIH grant R01-GM083603-01.
References
Admiraal R, Handcock MS (2007). networksis: Simulate Bipartite Graphs with Fixed Marginals Through Sequential Importance Sampling. Statnet Project http: //statnetproject.org/, Seattle, WA. R package version 1.0, URL http://CRAN. R-project.org/package=networksis.
Apple Inc (1999). QuickTime Multimedia Software Architecture. URLhttp://developer. apple.com/quicktime/.
Batagelj V, Mrvar A (2007). Pajek: Package for Large Network Analysis. University of Ljubljana, Slovenia. URL http://vlado.fmf.uni-lj.si/pub/networks/pajek/.
Bender-deMoll S, McFarland DA (2003). SoNIA: Social Network Image Animator. URL http://sonia.stanford.edu/.
Bender-deMoll S, Morris M, Moody J (2008). “Prototype Packages for Managing and Ani-mating Longitudinal Network Data: dynamicnetwork and rSoNIA.”Journal of Statistical Software,24(7). URL http://www.jstatsoft.org/v24/i07/.
Besag J (1974). “Spatial Interaction and the Statistical Analysis of Lattice Systems.”Journal of the Royal Statistical Society B,36, 192–236.
Boer P, Huisman M, Snijders TAB, Zeggelink EPH (2003). StOCNET: An Open Software System for the Advanced Statistical Analysis of Social Networks. ICS/SciencePlus, Universiy of Groningen, Groningen, Netherlands, version 1.7 edition. URLhttp://stat.gamma.rug. nl/stocnet/.
Borgatti SP, Everett MG, Freeman LC (1999). UCINET 6.0 for Windows: Software for Social Network Analysis. Analytic Technologies, Natick. URLhttp://www.analytictech. com/.
Butts CT (2006). netperm: Permutation Models for Relational Data. Rpackage version 0.2, URLhttp://erzuli.ss.uci.edu/R.stuff/.
Butts CT (2007). sna: Tools for Social Network Analysis. Statnet Project http: //statnetproject.org/, Seattle, WA. R package version 1.5, URL http://CRAN. R-project.org/package=sna.
Butts CT (2008a). “network: A Package for Managing Relational Data in R.” Journal of Statistical Software,24(2). URL http://www.jstatsoft.org/v24/i02/.
Butts CT (2008b). “Social Network Analysis withsna.”Journal of Statistical Software,24(6). URLhttp://www.jstatsoft.org/v24/i06/.
Butts CT, Handcock MS, Hunter DR (2007). network: Classes for Relational Data. Statnet Project http://statnetproject.org/, Seattle, WA. R package version 1.3, URL http: //CRAN.R-project.org/package=network.
Frank O, Strauss D (1986). “Markov Graphs.”Journal of the American Statistical Association,
81(395), 832–842.
Goodreau SM (2007). “Advances in Exponential Random Graph (p∗) Models Applied to a Large Social Network.”Social Networks,29(2), 231–248.
Goodreau SM, Handcock MS, Hunter DR, Butts CT, Morris M (2008a). “AstatnetTutorial.” Journal of Statistical Software,24(9). URL http://www.jstatsoft.org/v24/i09/. Goodreau SM, Kitts J, Morris M (2008b). “Birds of a Feather, or Friend of a Friend? Using
Exponential Random Graph Models to Investigate Adolescent Social Networks.” Demogra-phy,45. Forthcoming.
Handcock MS (2003a). “Assessing Degeneracy in Statistical Models of Social Networks.” Working Paper 39, Center for Statistics and the Social Sciences, University of Washington. URLhttp://www.csss.washington.edu/Papers/.
Handcock MS (2003b). degreenet: Models for Skewed Count Distributions Relevant to Net-works. Statnet Projecthttp://statnetproject.org/, Seattle, WA.Rpackage version 1.0, URLhttp://CRAN.R-project.org/package=degreenet.
Handcock MS (2003c). “Statistical Models for Social Networks: Inference and Degeneracy.” In R Breiger, K Carley, P Pattison (eds.), “Dynamic Social Network Modeling and Analysis,” volume 126, pp. 229–252. Committee on Human Factors, Board on Behavioral, Cognitive, and Sensory Sciences, National Academy Press, Washington, DC.
Handcock MS, Hunter DR, Butts CT, Goodreau SM, Morris M (2003a). ergm: A Package to Fit, Simulate and Diagnose Exponential-Family Models for Networks. Statnet Project http://statnetproject.org/, Seattle, WA. R package version 2.0, URL http://CRAN. R-project.org/package=ergm.
Handcock MS, Hunter DR, Butts CT, Goodreau SM, Morris M (2003b). statnet: Software Tools for the Statistical Modeling of Network Data. Statnet Project http: //statnetproject.org/, Seattle, WA. R package version 2.0, URL http://CRAN. R-project.org/package=statnet.
Handcock MS, Jones JH (2004). “Likelihood-Based Inference for Stochastic Models of Sexual Network Formation.”Theoretical Population Biology,65, 413–422.
Handcock MS, Jones JH (2006). “Interval Estimates for Epidemic Thresholds in Two-Sex Network Models.”Theoretical Population Biology,70, 125–134.
Handcock MS, Raftery AE, Tantrum JM (2007). “Model-based Clustering for Social Net-works.”Journal of the Royal Statistical Society A,170(2), 301–354.
Hoff PD, Raftery AE, Handcock MS (2002). “Latent Space Approaches to Social Network Analysis.”Journal of the American Statistical Association,97(460), 1090–1098.
Holland PW, Leinhardt S (1981). “An Exponential Family of Probability Distributions for Directed Graphs.”Journal of the American Statistical Association,76(373), 33–65. Hunter DR, Goodreau SM, Handcock MS (2008a). “Goodness of Fit for Social Network
Models.”Journal of the American Statistical Association,103, 248–258.
Hunter DR, Handcock MS (2006). “Inference in Curved Exponential Family Models for Networks.”Journal of Computational and Graphical Statistics,15(3), 565–583.
Hunter DR, Handcock MS, Butts CT, Goodreau SM, Morris M (2008b). “ergm: A Package to Fit, Simulate and Diagnose Exponential-Family Models for Networks.”Journal of Statistical Software,24(3). URL http://www.jstatsoft.org/v24/i03/.
Jones JH, Handcock MS (2003a). “An Assessment of Preferential Attachment as a Mechanism for Human Sexual Network Formation.”Proceedings of the Royal Society of London B,270, 1123–1128.
Jones JH, Handcock MS (2003b). “Sexual Contacts and Epidemic Thresholds.” Nature,
423(6940), 605–606.
Kernighan BW, Ritchie DM (1988). The C Programming Language. Prentice Hall Press, Upper Saddle River, NJ.
Krivitsky PN, Handcock MS (2007). latentnet: Latent Position and Cluster Models for Sta-tistical Networks. Statnet Projecthttp://statnetproject.org/, Seattle, WA. Rpackage version 2.0, URLhttp://CRAN.R-project.org/package=latentnet.
Morris M, Handcock MS, Hunter DR (2008). “Specification of Exponential-Family Random Graph Models: Terms and Computational Aspects.”Journal of Statistical Software,24(4). URLhttp://www.jstatsoft.org/v24/i04/.
R Development Core Team (2007). R: A Language and Environment for Statistical Com-puting. R Foundation for Statistical Computing, Vienna, Austria. ISBN 3-900051-07-0, Version 2.6.1, URL http://www.R-project.org/.
Snijders TAB, Pattison P, Robins GL, Handcock MS (2006). “New Specifications for Expo-nential Random Graph Models.”Sociological Methodology,36, 99–153.
StataCorp (2007). StataStatistical Software: Release 10. StataCorp LP, College Station, TX. URLhttp://www.stata.com/.
Wasserman SS, Faust K (1994). Social Network Analysis: Methods and Applications. Struc-tural Analysis in the Social Sciences. Cambridge University Press, Cambridge.
Wasserman SS, Pattison P (1996). “Logit Models and Logistic Regressions for Social Networks: I. An Introduction to Markov Graphs andp∗.”Psychometrika,61(3), 401–425.
Affiliation: Mark S. Handcock Department of Statistics University of Washington
Seattle, WA 98195, United States of America E-mail: [email protected]
URL:http://www.stat.washington.edu/handcock/
Journal of Statistical Software
http://www.jstatsoft.org/ published by the American Statistical Association http://www.amstat.org/Volume 24, Issue 1 Submitted: 2007-06-01